. 2021 Feb 4;28(2):273-284.e6.
doi: 10.1016/j.stem.2020.10.018. Epub 2020 Nov 19.

Membrane Tension Gates ERK-Mediated Regulation of Pluripotent Cell Fate

Affiliations

Membrane Tension Gates ERK-Mediated Regulation of Pluripotent Cell Fate

Henry De Belly et al. Cell Stem Cell. .

Abstract

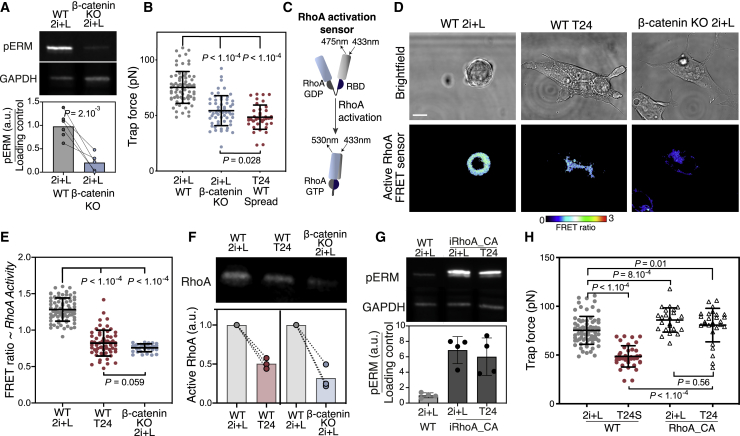
Cell fate transitions are frequently accompanied by changes in cell shape and mechanics. However, how cellular mechanics affects the instructive signaling pathways controlling cell fate is poorly understood. To probe the interplay between shape, mechanics, and fate, we use mouse embryonic stem cells (ESCs), which change shape as they undergo early differentiation. We find that shape change is regulated by a β-catenin-mediated decrease in RhoA activity and subsequent decrease in the plasma membrane tension. Strikingly, preventing a decrease in membrane tension results in early differentiation defects in ESCs and gastruloids. Decreased membrane tension facilitates the endocytosis of FGF signaling components, which activate ERK signaling and direct the exit from the ESC state. Increasing Rab5a-facilitated endocytosis rescues defective early differentiation. Thus, we show that a mechanically triggered increase in endocytosis regulates early differentiation. Our findings are of fundamental importance for understanding how cell mechanics regulates biochemical signaling and therefore cell fate.

Keywords: Beta-catenin; Cell fate choice; Cell surface mechanics; ERK; Embryonic stem cells; Endocytosis; Membrane tension; mechanical signalling; pluripotency.


Conflict of interest statement

Declaration of Interests The authors declare no competing interests.

Figures

None
Graphical abstract
Figure 1
Figure 1
Membrane Tension Is Reduced in ESCs during Early Differentiation (A) Top: schematic of experimental setup to investigate exit from naive pluripotency in ESCs; bottom: SEM images of ES and T48 cells. (B) Representative single z planes of T24 cells immunostained for Nanog and Otx2. (C) Quantification of Nanog and Otx2 levels (from images as in B) in round (gray dots) and spread (red dots) T24 cells (N = 3). (D) Schematic of membrane tension measurement using optical tweezers. (E) Left: trap force (direct readout of membrane tension) during exit from naive pluripotency of ES, T8, T16, T24, and T48 cells (means ± SDs; 5 independent experiments). The data are color coded based on cell shape (gray, round; orange, blebbing; red, spread). Right, same data as left panel but with all of the data grouped by shape (e.g., all of the blebbing cells correspond to all of the blebbing cells observed in T8, T16, and T24). (F) Representative fluorescent Western blot for pERM and His3 in ESCs and at various time points during exit from naive pluripotency and corresponding quantification (N = 4). p value was calculated using a 2-way analysis of variance (ANOVA). For all of the panels, graphical data represent means ± SDs. Unless otherwise indicated, for all panels, p values were established by Welch’s unpaired Student’s t test. Scale bars represent 10 μm.
Figure 2
Figure 2
The Decrease in Membrane Tension during Early Differentiation Is Induced by a β-Catenin and RhoA-Mediated Decrease in ERM Phosphorylation (A) Fluorescent Western blot and associated quantification for pERM and glyceraldehyde 3-phosphate dehydrogenase (GAPDH) of WT and β-catenin knockout (KO) cells cultured in 2i+L (N = 6). (B) Trap force measurements of β-catenin KO ESCs and WT ESCs and T24 spread (S) cells (N = 3). (C) Schematic of the FRET sensor for RhoA activity. RBD, Rho binding domain. (D) Representative images of the bright-field and FRET ratio of WT ESCs, T24 cells, and β-catenin KO ESCs expressing the RhoA activation FRET sensor. (E) Quantification of the average FRET ratio (~RhoA activity) per cell (N = 3). (F) Active RhoA pull-down assay. Top, representative fluorescent Western blot for RhoA in WT ESCs, T24, and β-catenin KO cells after active RhoA pull-down. Bottom, quantification of active RhoA pulled down. (N = 3). (G) Top, representative fluorescent Western blot for pERM and GAPDH in WT ESCs, iRhoA_CA ESCs, and T24 cells. Note that WT 2i+L is the same as in (A) (A and G are on the same gel). Bottom, corresponding quantification (N = 4). (H) Trap force measurement of WT ESCs, T24S, iRhoA_CA ESCs, and T24 cells (N = 3). WT data in (B) and (H) are from Figure 1E. The graphical data represent means ± SDs. p values established by Welch’s unpaired Student’s t test and indicated in the figure. Scale bars represent 10 μm.
Figure 3
Figure 3
Maintaining High Membrane Tension Impairs Early Differentiation (A) Representative images of WT (top) and iEZR_CA (bottom) ESCs and T48 cells. Scale bar, 50 μm. (B) Trap force, as a readout of membrane tension, for WT and iEZR_CA ESCs and T24 cells (N = 3; data for WT cells are same as Figure 1H). (C) Representative single z planes of a mix of WT and iEZR_CA (positive for the EZR_CA_ires_mCherry) T24 cells immunostained for Otx2 and Nanog. Scale bar represents 10 μm. (D) Quantification of Nanog and Otx2 expression in WT and iEZR_CA T24 cells, normalized to WT mean levels (N = 3). (E) Left: schematic of clonogenicity assay used as a functional measure of naive pluripotency. Right: quantification of the percentage of surviving replated cells in a clonogenicity assay using WT and iEZR_CA ESs. Cells replated directly from 2i+L are used as a positive control (N = 6). (F) Heatmap of relative expression of main pluripotency genes and early post-implantation genes. The mean normalized log2 counts for each time point in iEZR_CA cells is compared to mean normalized log2 counts in WT cells. Averages were computed over 3 biological replicates. (G) Principal-component analysis from RNA sequencing of iEZR_CA and WT ESCs in 2i+LIF, and 24 h (T24) and 48 h (T48). Each marker represents an independent biological replicate (3 replicates per condition). The principal components (“PC”) were computed based on the normalized expression of highly variable genes (n = 4,832 genes) (see Method Details). (H) Schematic presentation of the gastruloid culture protocol: 300 mouse ESCs were transferred into low-attachment wells. CHIR99021 was introduced from 48 to 72 h. Organoids were cultured for a total of 120 h and images acquired at 72, 96, and 120 h time points. (I) Representative bright-field microscope images of gastruloids initiated from WT cells (left) and iEZR_CA cells (right).Scale bar, 200 um. (J and K) Quantification of WT and iEZR_CA gastruloid size and shape. Maximum feret diameter and roundness (see STAR Methods) measured from the brightfield images taken at 72 h, 96 h, and 120h timepoints (N = 3). Graphical data represents mean ± SD. p values established by Welch's unpaired student t test (unless specified otherwise).
Figure 4
Figure 4
Membrane Tension Reduction, Not Cell Spreading, Is Responsible for Gating Early Differentiation (A) Schematic of the micropatterning assay. Cells cannot adhere on polyethylene glycol (PEG) regions (blue) and can only adhere on the micropatterns. (B) Representative single z plane images of fixed ES and T24 cells cultured on small (top) and large (bottom) micropatterns and immunostained for Nanog. (C) Quantification of Nanog expression in ES and T24 cells cultured on large (unconstrained, control) and small (constrained) micropatterns (here, p values were calculated using the Mann-Whitney U test, N = 4). (D) Membrane tension measurements in ESCs and T24 cells either grown on micropatterns (small, constrained; large, unconstrained) or cultured in an open gelatin-coated dish (ES and T48). The data for cells on gelatin are from Figure 2B (N = 2). (E) Similar quantifications as in (C), but for cells transfected with triple small interfering RNA (siRNA) against ERM or with Scrambled (SCR) siRNA as control (Mann-Whitney U test was used to calculate the p value; N = 4). (F) Representative images of ES and T24 cells cultured on laminin and E-cadherin. (G) Trap force measurements in ESCs and T24 cells cultured on either gelatin, laminin, or E-cadherin. The data for cells cultured on gelatin are the same as Figure 2B (N = 3). The graphical data represent means ± SDs. Unless otherwise specified, the p values were calculated using Welch’s unpaired Student’s t test. Scale bars represent 10 μm.
Figure 5
Figure 5
Endocytosis Regulates Early Differentiation (A) Schematic of endocytosis quantification using a fluid uptake assay with pH-sensitive fluorescent dextran. (B and C) Sum z projection images of representative ESCs and T24 cells in assay described in (A) and (B) and corresponding quantification (C; error bars are 95% confidence intervals; N = 3). (D) Left: schematic of endocytosis quantification assay with the use of drug treatment against endocytosis. Right: quantification of fluid phase uptake in ESCs and T24 cells treated with either DMSO (control), chlorpromazine hydrochloride (10 μM), pitstop2 (25 μM), or dynasore (10 μM). (E) Representative images of immunofluorescence against Nanog and Otx2 of a single z plane of T24 cells treated with either DMSO (control), chlorpromazine hydrochloride (10 μM), pitstop2 (25 μM), or dynasore (10 μM). (F and G) Quantification of Nanog and Otx2 expression in cells treated with drugs to inhibit endocytosis, normalized to control (DMSO) mean levels (N = 3). (H and I) Sum z projection images of representative WT ESCs, iEZR_CA-ESCs, and iEZR_CA-ESCs transfected with Rab5a in the assay described in (A) and associated quantifications. Error bars: 95% confidence intervals (N = 3). (J and K) Single z plane images of representative mixed populations of WT and iEZR_CA (positive in the mCherry channel) T24 cells, transfected with Rab5a and immunostained for Nanog and corresponding quantifications (N = 3). The non-transfected iEZR_CA data are from Figure 2D. The graphical data represent means ± SDs. p values calculated using Welch’s unpaired Student’s t test. Scale bars represent 10 μm.
Figure 6
Figure 6
Membrane-Tension-Mediated Endocytosis Promotes ERK Activation during Early Differentiation (A) Fluorescent Western blot for ERK, pERK, and histone3 in ESCs at different time points during exit from naive pluripotency. (B) Time course of the ratio of pERK levels (normalized to corresponding histone 3 levels) in WT and iEZR_CA cells during exit from naive pluripotency (N = 6). (C) Representative single z plane image of WT, iEZR_CA, and iEZR_CA T24 treated with 3 μM BI-D1870, an RSK-inhibitor (resulting in ERK activation) immunostained for Nanog and Otx2. (D) Quantification of Nanog and Otx2 expression in WT, iEZR_CA, iEZR_CA+BI-D1870 T24 cells, normalized to WT mean levels (N = 3). (E) Schematic of the FRET ERK sensor used to measure ERK activation at early endosomes (Palamidessi et al., 2019). (F) Left: time-lapse of a representative cell expressing the FRET ERK sensor and exiting pluripotency at 6 h (top, the cell is still round) and 18 h 20 min (bottom, the cell is spread). Right: time course of the FRET ratio for the cell is shown at left. (G) Quantification of the FRET ratio in ESCs exiting naive pluripotency; time is normalized to the time of spreading (means ± SEMs, n = 10, N = 3). Inset: FRET ratio for round and spread cells in the same dataset. (H) Mean FRET ratio for fixed ESCs and T24 cells in WT and iEZR_CA transfected or not with Rab5a (N = 3). (I) Schematic of the proposed mechanism for how membrane tension regulates signaling during exit from naive pluripotency. The graphical data represent means ± SDs. p values calculated using Welch’s unpaired Student’s t test (unless specified otherwise) and indicated in the figure. Scale bars represent 10 μm.

Comment in

References

    1. Anders S., Pyl P.T., Huber W. HTSeq--a Python framework to work with high-throughput sequencing data. Bioinformatics. 2015;31:166–169. - PMC - PubMed
    1. Arnold T.R., Stephenson R.E., Miller A.L. Rho GTPases and actomyosin: partners in regulating epithelial cell-cell junction structure and function. Exp. Cell Res. 2017;358:20–30. - PMC - PubMed
    1. Avior Y., Sagi I., Benvenisty N. Pluripotent stem cells in disease modelling and drug discovery. Nat. Rev. Mol. Cell Biol. 2016;17:170–182. - PubMed
    1. Baillie-Johnson P., van den Brink S.C., Balayo T., Turner D.A., Martinez Arias A. Generation of Aggregates of Mouse Embryonic Stem Cells that Show Symmetry Breaking, Polarization and Emergent Collective Behaviour In Vitro. J. Vis. Exp. 2015;(105):53252. - PMC - PubMed
    1. Bellas E., Chen C.S. Forms, forces, and stem cell fate. Curr. Opin. Cell Biol. 2014;31:92–97. - PMC - PubMed

Publication types