. 2020 Dec 14;38(6):872-890.e6.
doi: 10.1016/j.ccell.2020.10.010. Epub 2020 Nov 19.

Reduced Mitochondrial Apoptotic Priming Drives Resistance to BH3 Mimetics in Acute Myeloid Leukemia

Affiliations

Reduced Mitochondrial Apoptotic Priming Drives Resistance to BH3 Mimetics in Acute Myeloid Leukemia

Shruti Bhatt et al. Cancer Cell. .

Abstract

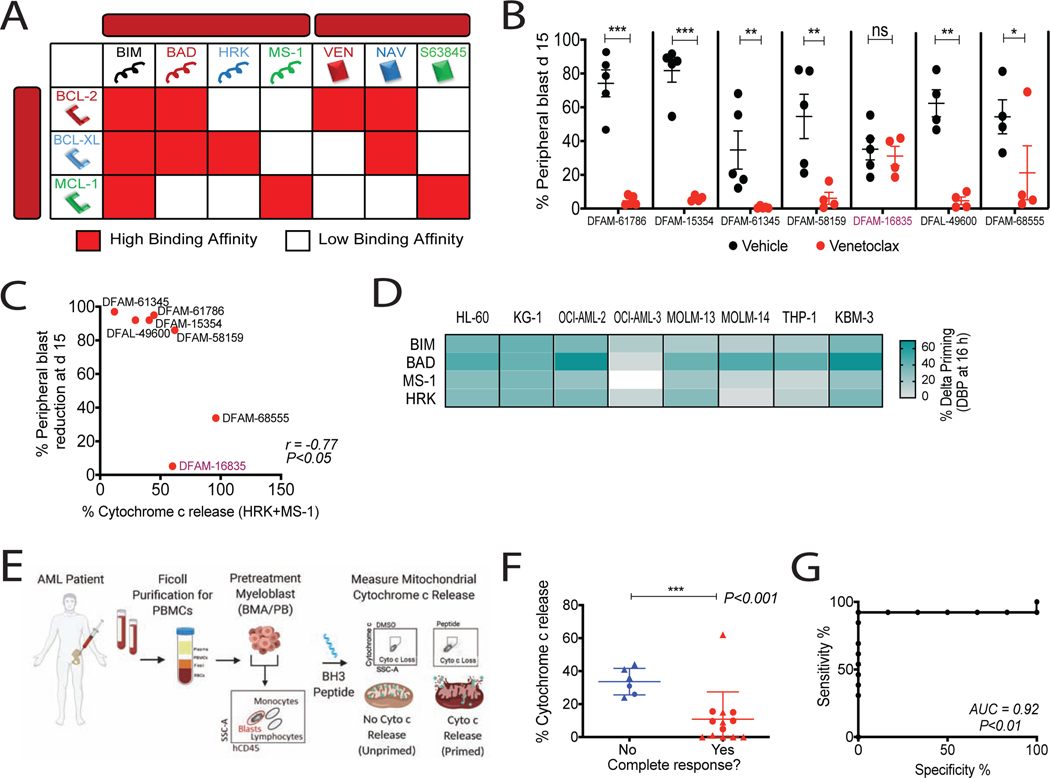
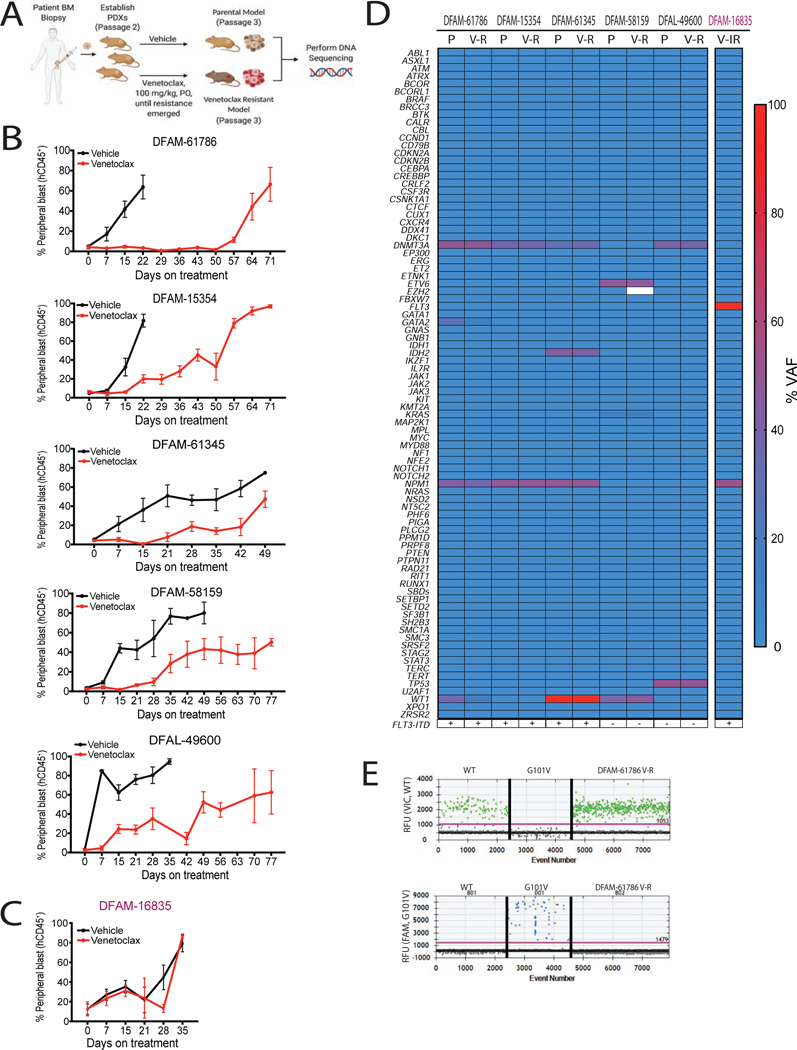
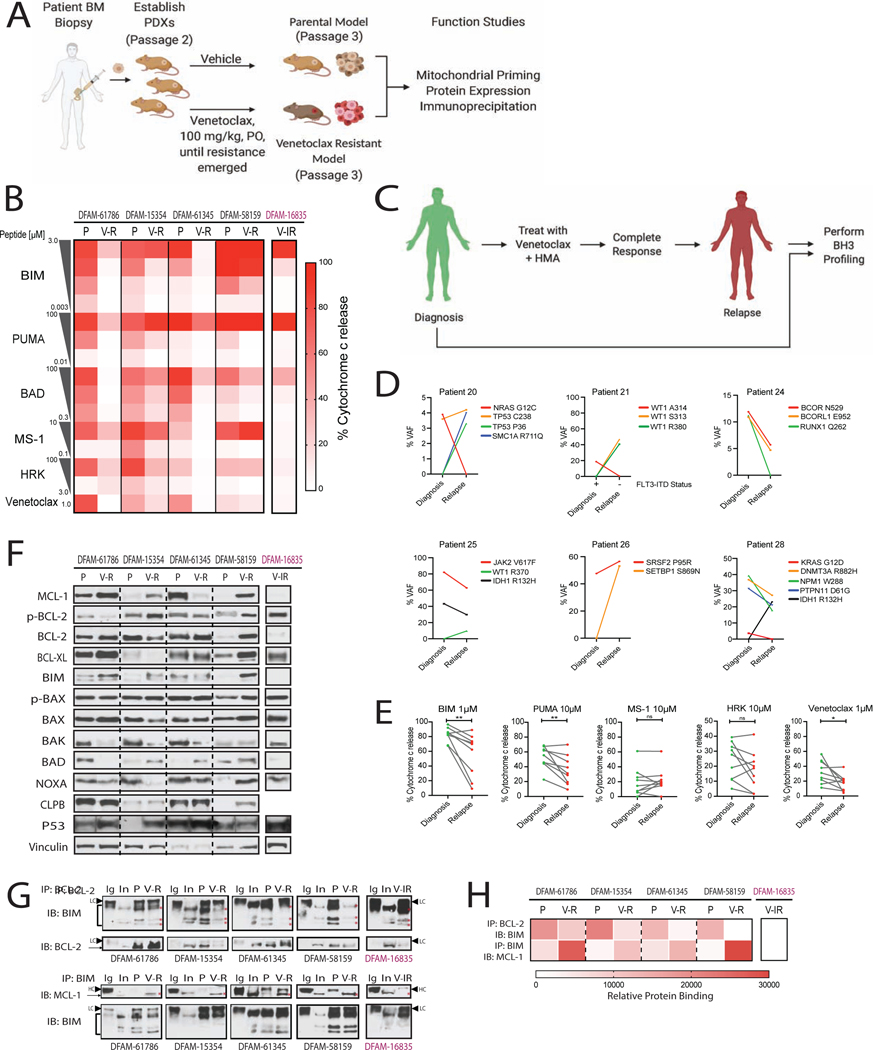
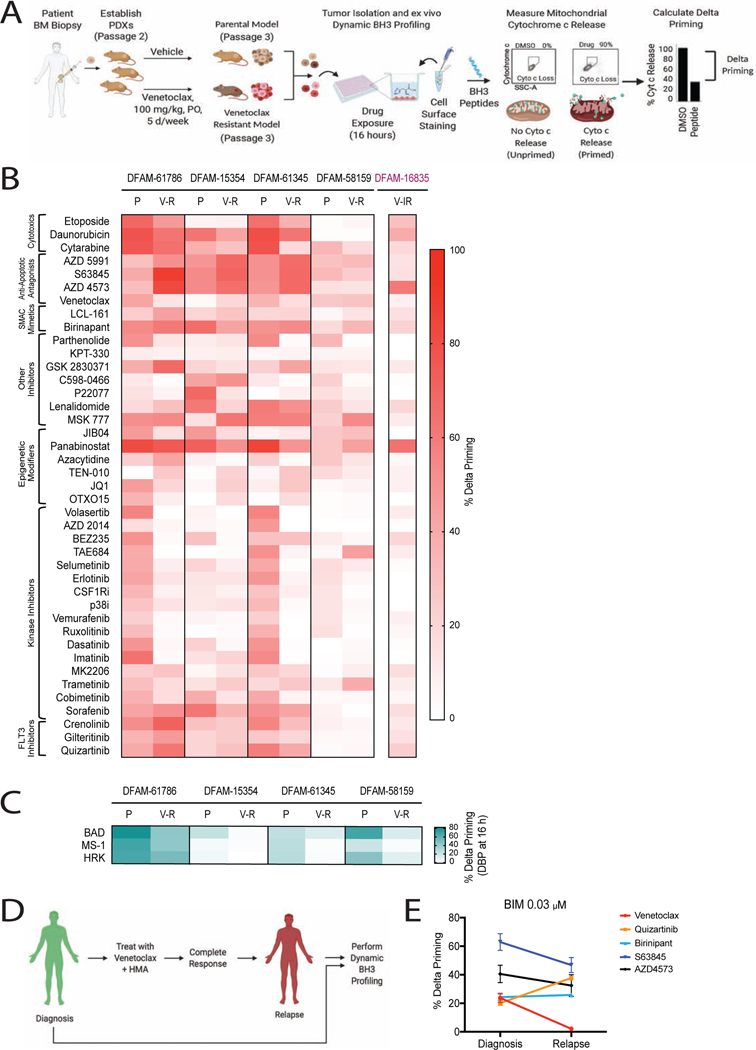
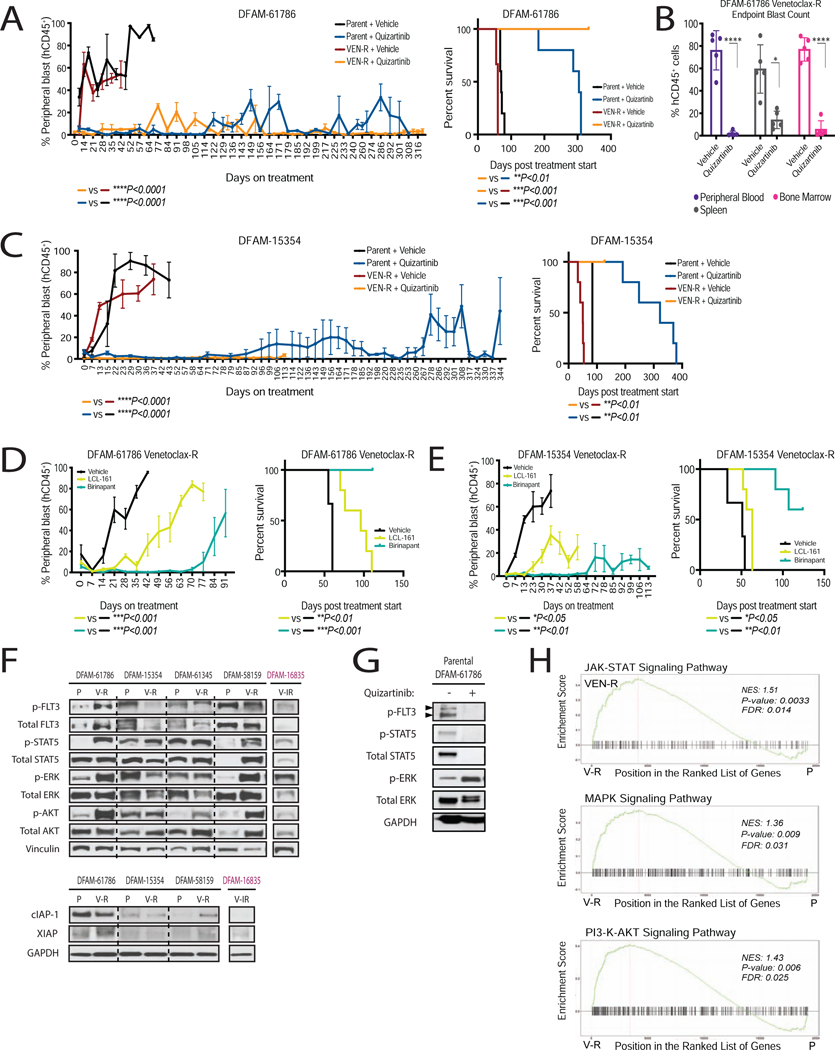
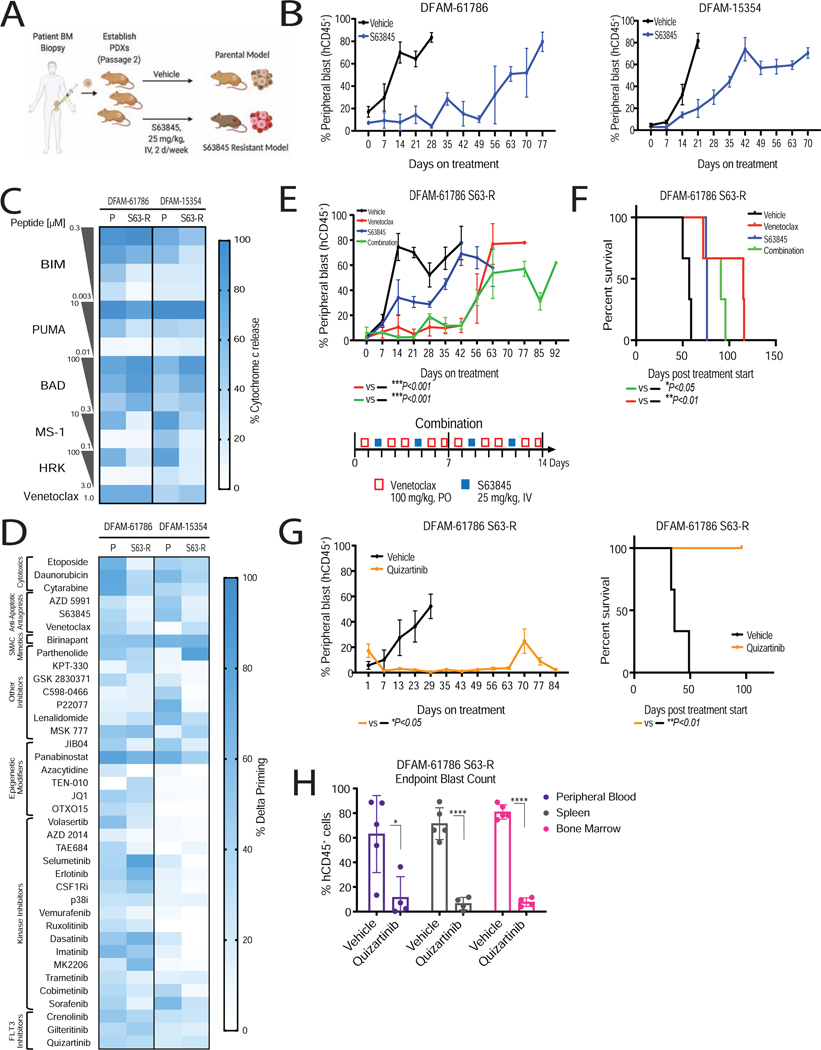
Acquired resistance to BH3 mimetic antagonists of BCL-2 and MCL-1 is an important clinical problem. Using acute myelogenous leukemia (AML) patient-derived xenograft (PDX) models of acquired resistance to BCL-2 (venetoclax) and MCL-1 (S63845) antagonists, we identify common principles of resistance and persistent vulnerabilities to overcome resistance. BH3 mimetic resistance is characterized by decreased mitochondrial apoptotic priming as measured by BH3 profiling, both in PDX models and human clinical samples, due to alterations in BCL-2 family proteins that vary among cases, but not to acquired mutations in leukemia genes. BCL-2 inhibition drives sequestered pro-apoptotic proteins to MCL-1 and vice versa, explaining why in vivo combinations of BCL-2 and MCL-1 antagonists are more effective when concurrent rather than sequential. Finally, drug-induced mitochondrial priming measured by dynamic BH3 profiling (DBP) identifies drugs that are persistently active in BH3 mimetic-resistant myeloblasts, including FLT-3 inhibitors and SMAC mimetics.

Keywords: BCL-2; BH3 mimetics; BH3 profiling; FLT-3; MCL-1; SMAC; leukemia; mitochondria; precision cancer medicine; venetoclax.


Conflict of interest statement

Declaration of Interests A.L. has consulted for and has received research support from AbbVie, Novartis, and AstraZeneca. He serves on the scientific advisory board of Flash Therapeutics, Dialectic Therapeutics, and Zentalis. J.S.G. received research funding from AbbVie, Genentech, Lilly, and Pfizer. She served on AbbVie advisory board. D.M.W. received research support from Novartis, Abbvie, AstraZeneca, Aileron, Daiichi-Sankyo, and Verastem. He is a founder and equity holder of Ajax Therapeutics and Travera. He serves on scientific advisory boards of Bantam Therapeutics, EDO Mundipharma, and Ajax Therapeutics.

Figures

Figure 1:
Figure 1:. Baseline BH3 profiling predicts clinical response to venetoclax and hypomethylating agent combination.
(A) Interaction map for BH3 peptides and BH3 mimetics with BCL-2 family proteins. Red, Kd < 100nM, determined by fluorescence polarization. Ven, venetoclax; Nav, navitoclax. (B) % hCD45+ circulating blasts in AML PDXs on venetoclax treatment (100 mg/kg, PO, 5 days/week) for 2 weeks. Mean ± SEM, n=5 mice; *P<0.05, **P<0.01, ***P<0.001, two-tailed Student’s t-test. (C) Spearman correlation between cytochrome c release caused by HRK+MS-1 peptides in pretreatment PDX myeloblasts and blast reduction at day 15 post therapy. (D) Heatmap of delta priming responses to indicated peptides in AML cell lines at 16h azacytidine treatment. Delta priming = % cytochrome c lossdrug - % cytochrome c lossDMSO (n=3 replicates). (E) Schematic of BH3 profiling of AML patient myeloblasts. (F) Cytochrome c release derived from BH3 profiling using HRK+MS-1 peptides in pretreatment myeloblasts compared with response status of patients treated with venetoclax plus HMA. Circles, phase 1b (NCT02203773) clinical trial patients (n=7); triangles, off-trial patients (n=12); horizontal line, median with interquartile range; ***P<0.001, one-tailed Wilcoxon-rank sum test. (G) Receiver operative characteristic (ROC) curve of HRK+MS-1-induced cytochrome c release versus clinical response. See also Figure S1 and Table S1 and S2.
Figure 2:
Figure 2:. In vivo resistance to venetoclax emerges in the absence of genetic mutations in known leukemia genes.
(A) Schematic of in vivo venetoclax-resistant models generation. (B-C) % hCD45+ circulating blasts after venetoclax or vehicle treatment in indicated PDXs. The models in B acquired resistance to venetoclax while the model in C was intrinsically resistant (IR). Mean ± SEM, n = 5. (D) Pair-wise comparison of parental and resistant PDX mutation status and variant allele frequency. (E) Representative electropherograms for detection of WT (top) and mutant BCL2 (Gly101Val, bottom) in myeloblasts derived from venetoclax-resistant DFAM-61786 by digital droplet PCR. Top, VIC fluorescence for WT BCL2 Gly101; Bottom, FAM fluorescence for BCL2 Gly101Val. Each dot is a droplet; RFU, relative fluorescence unit. See also Table S1 and Figure S2.
Figure 3:
Figure 3:. In vivo acquired resistance to venetoclax is accompanied by reduction in mitochondrial priming and displacement of BIM from BCL-2 to MCL-1
(A) Schematic of the experimental workflow. (B) Heatmap of baseline mitochondrial priming in PDXs before and after acquisition of venetoclax resistance (n=3 mice/group). (C) Schematic of paired-wise BH3 profiling in AML patients. (D, E) Pair-wise comparisons of (C) mutation status and variant allele frequency and (E) cytochrome c release using the indicated peptides in AML patient samples at diagnosis and at relapse on VEN+AZA (n=9 pairs). Each dot represents mean of 3 replicates *P<0.05, **P<0.01, two-tailed student t-test. (F) Immunoblotting (IB) for BCL-2 family proteins in parental and venetoclax-resistant PDX myeloblasts. (G, H) Immunoprecipitation (IP) for BCL-2 followed by IB for BIM (top). IP of BIM followed by IB for MCL-1 (bottom). red *, correct band size for proteins; HC, IgG heavy chain; LC, IgG light chain. (H) Heatmap for corresponding densitometry using Image J. P, parental; V-R, venetoclax-acquired resistant; V-IR, venetoclax-intrinsic resistance. See also Table S1 and Figure S3.
Figure 4:
Figure 4:. Dynamic BH3 profiling identifies drug vulnerabilities in in vivo venetoclax-resistant AML.
(A) Schematic of dynamic BH3 profiling (DBP) (B-C) Heatmap of DBP results comparing delta priming responses in the myeloblasts derived from parental and venetoclax-resistant PDXs at 16 h drug treatment. Delta priming response to (B) 40 targeted agents and to (C) azacytidine. Each result reflects 3 independent mice as biological replicates of 2 technical replicates each. (D) Schematic of pair-wise DBP in single AML patient (E) Comparison of delta priming response to BIM peptide in patient myeloblasts at diagnosis and relapse on VEN+AZA at 16 h treatment with indicated drugs. Mean±SD, n=3. See also Figure S3.
Figure 5:
Figure 5:. Mitochondrial sensitivities to BH3 peptides reveal basis for synergy between BH3 mimetics.
(A-B) Heat map of delta priming response in AML cell lines after treatment with (A) 5nM venetoclax and (B) 50nM S63845 for 16 h, determined by dynamic BH3 profiling (n=3). (C-D) Delta priming kinetics of MOLM-13 cell line after treatment with (C) venetoclax and (D) S63845. Mean±SD, n=3. (E) IP of BIM in MOLM-13 cell line to detect binding with MCL-1 and BCL-2 following 1h treatment with venetoclax and S63845 (F) Cell viability heatmap of indicated AML cell lines at 24 h treatment with venetoclax and S63845 (n= 3). (G) Spearman correlation between Loewe synergy score for venetoclax and S63845 combination and delta priming response to BAD+MS-1 peptides shown in A and B. (H) % hCD45+ leukemic cells in AML PDX subjected to venetoclax (50 mg/kg, PO, 5 days/week), S63845 (25 mg/kg, IV, 2 days/week) or combination. Mean±SEM, n=5 mice; *P<0.05, **P<0.01, one-way ANOVA. See also Figure S4.
Figure 6:
Figure 6:. Dual targeting of BCL-2 and MCL-1 inhibits leukemia progression of venetoclax-resistant PDX models.
(A) Cell viability of parental and venetoclax-resistant Molm-13 cells treated with MIK665 and +/− 1.3 μM venetoclax at 72 h. Mean±SEM, n=2. (B) Schematic of PDX treatment, n=5 mice/arm. (C) % hCD45+ leukemic cell burden after treatment with single agent venetoclax (100 mg/kg, PO, 5 days/week) or S63845 (25 mg/kg, IV, 2 days/week) or vehicle. Mean±SEM, n=5 mice. (D) Schematics of 5 different combination regimens for venetoclax and S63845. In Combination 3 group (“disease adaptive”) switch between treatments was made on nth day once circulating myeloblasts reached 50%. (E) % hCD45+ leukemic cell burden of PDXs in response to 5 different combination treatment strategies shown in D. Mean±SEM, n=5 mice; *P<0.05, **P<0.01, one-way ANOVA. (F) Kaplan-Meier curves showing in-vivo efficacy of 5 different combination regimen in venetoclax-resistant DFAM-61786 model. *P<0.05, **P<0.01, log-rank test. See also Figure S4 and S5.
Figure 7:
Figure 7:. Dynamic BH3 profiling identified FLT3 inhibition and IAP inhibition as an effective strategy in venetoclax-resistant settings.
(A-C) Parental or venetoclax-resistant myeloblasts from indicated PDXs were serially transplanted into NSG mice and assigned into treatment arms after 4 weeks post-transplant. (A and C) % hCD45+ peripheral blast count and corresponding survival curves in response to quizartinib. (B) % hCD45+ blast reduction across different compartments upon quizartinib treatment. Mean±SEM, n=5 mice; *P<0.05, **P<0.01, ***P<0.001 one-way ANOVA. Survival curve analysis; log-rank test. In C, VEN-R+quizartinib arm study was stopped before endpoint reached due to COVID. (D and E) % hCD45+ peripheral blast count and survival curves in response to SMAC mimetics birinapant (25 mg/kg, IP, 3 days/week), and LCL-161 (100 mg/kg 4 days/week, PO). Mean±SEM, n=5 mice; *P<0.05, **P<0.01, one-way ANOVA. survival curve analysis, *P<0.05, **P<0.01, log-rank test. (F) Immunoblots measuring levels of downstream effectors of FLT3 and SMAC mimetic targets in venetoclax-resistant PDXs. (G) Immunoblots measuring inhibition of FLT3 targets with ex-vivo quizartinib treatment at 4 h in parental DFAM-61786. (H) Gene set enrichment analysis (GSEA) showing overlaps of enrichment for JAK-STAT and FLT3/MAPK/PI3-K pathway signatures in 3 different venetoclax resistant PDXs (61786, 15354 and 61345) compared to parent counterparts. NES, normalized enrichment score; FDR, false discovery rate. See also Figure S6 and S7.
Figure 8:
Figure 8:. Dynamic BH3 profiling identified BCL-2 antagonism and FLT3 inhibition as an effective strategy in S63845 resistant settings.
(A) Schematic of modeling of in vivo S63845 resistance in AML PDXs. (B) Leukemic burden in indicated PDX models treated with S63845 (25 mg/kg, IV, 2 days/week) or vehicle treatment. Mean±SEM, n=5 mice. (C) Comparison of baseline mitochondrial priming of parental (P) and S63845 resistant (R) PDXs, determined by BH3 profiling (n=3 mice/group). (D) Heatmap of delta priming responses in the myeloblasts derived from parental and S63845-resistant PDXs at 16 h drug treatment, determined via DBP. Each entry reflects 3 independent mice as biological replicates of 2 technical replicates each. (E, F) S63845 resistant myeloblasts from DFAM-61786 were transplanted into NSG mice and assigned to treatment arms. (E) % hCD45+ peripheral blast reduction in response to venetoclax (100 mg/kg, PO, 5 days/week), S63845 (25 mg/kg, IV, 2 days/week), and combination treatment. Mean±SD, n=5 mice; ***P<0.001 one-way ANOVA. (F) Corresponding Kaplan-Meier survival curve. *P<0.05, **P<0.01, log-rank test. (G) % hCD45+ peripheral blast reduction and corresponding Kaplan-Meier survival curve in response to quizartinib (10 mg/kg, IP, 5 days/week). Mean±SD, n=5 mice. (H) % hCD45+ blast reduction across different compartments. Mean±SD, n=5 mice; *P<0.05, **P<0.05, two-tailed student t-test. See also Figure S8.

Comment in

References

    1. BLOMBERY P, ANDERSON MA, GONG JN, THIJSSEN R, BIRKINSHAW RW, THOMPSON ER, TEH CE, NGUYEN T, XU Z, FLENSBURG C, LEW TE, MAJEWSKI IJ, GRAY DHD, WESTERMAN DA, TAM CS, SEYMOUR JF, CZABOTAR PE, HUANG DCS & ROBERTS AW 2019. Acquisition of the Recurrent Gly101Val Mutation in BCL2 Confers Resistance to Venetoclax in Patients with Progressive Chronic Lymphocytic Leukemia. Cancer Discov, 9, 342–353. - PubMed
    1. BRUNELLE JK, RYAN J, YECIES D, OPFERMAN JT & LETAI A. 2009. MCL-1-dependent leukemia cells are more sensitive to chemotherapy than BCL-2-dependent counterparts. J Cell Biol, 187, 429–42. - PMC - PubMed
    1. CAENEPEEL S, BROWN SP, BELMONTES B, MOODY G, KEEGAN KS, CHUI D, WHITTINGTON DA, HUANG X, POPPE L, CHENG AC, CARDOZO M, HOUZE J, LI Y, LUCAS B, PARAS NA, WANG X, TAYGERLY JP, VIMOLRATANA M, ZANCANELLA M, ZHU L, CAJULIS E, OSGOOD T, SUN J, DAMON L, EGAN RK, GRENINGER P, MCCLANAGHAN JD, GONG J, MOUJALLED D, POMILIO G, BELTRAN P, BENES CH, ROBERTS AW, HUANG DC, WEI A, CANON J, COXON A & HUGHES PE 2018. AMG 176, a Selective MCL1 Inhibitor, Is Effective in Hematologic Cancer Models Alone and in Combination with Established Therapies. Cancer Discov, 8, 1582–1597. - PubMed
    1. CERTO M, DEL GAIZO MOORE V, NISHINO M, WEI G, KORSMEYER S, ARMSTRONG SA & LETAI A. 2006. Mitochondria primed by death signals determine cellular addiction to antiapoptotic BCL-2 family members. Cancer Cell, 9, 351–65. - PubMed
    1. CHEN X, GLYTSOU C, ZHOU H, NARANG S, REYNA DE, LOPEZ A, SAKELLAROPOULOS T, GONG Y, KLOETGEN A, YAP YS, WANG E, GAVATHIOTIS E, TSIRIGOS A, TIBES R & AIFANTIS I. 2019. Targeting Mitochondrial Structure Sensitizes Acute Myeloid Leukemia to Venetoclax Treatment. Cancer Discov, 9, 890–909. - PMC - PubMed

Publication types

MeSH terms