. 2020 Dec 15;119(12):2558-2572.
doi: 10.1016/j.bpj.2020.10.043. Epub 2020 Nov 18.

Substrate Resistance to Traction Forces Controls Fibroblast Polarization

Affiliations

Substrate Resistance to Traction Forces Controls Fibroblast Polarization

Dimitris Missirlis et al. Biophys J. .

Abstract

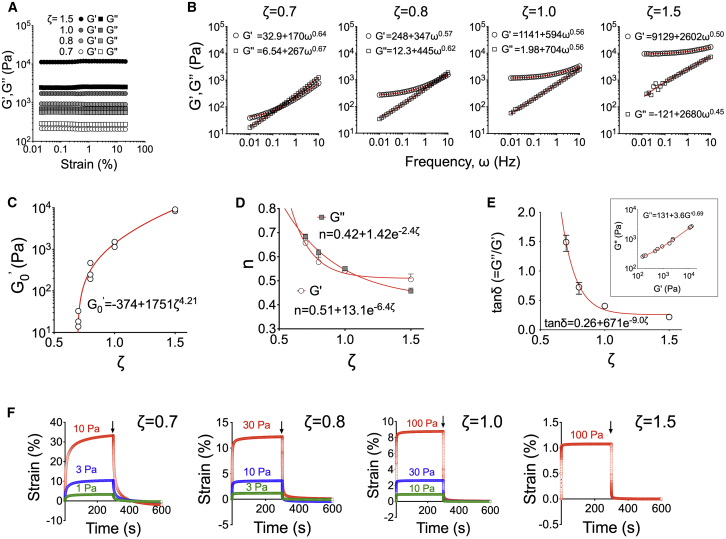
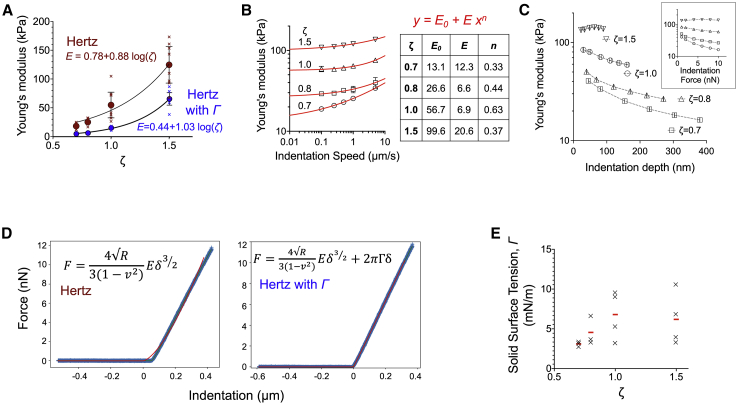
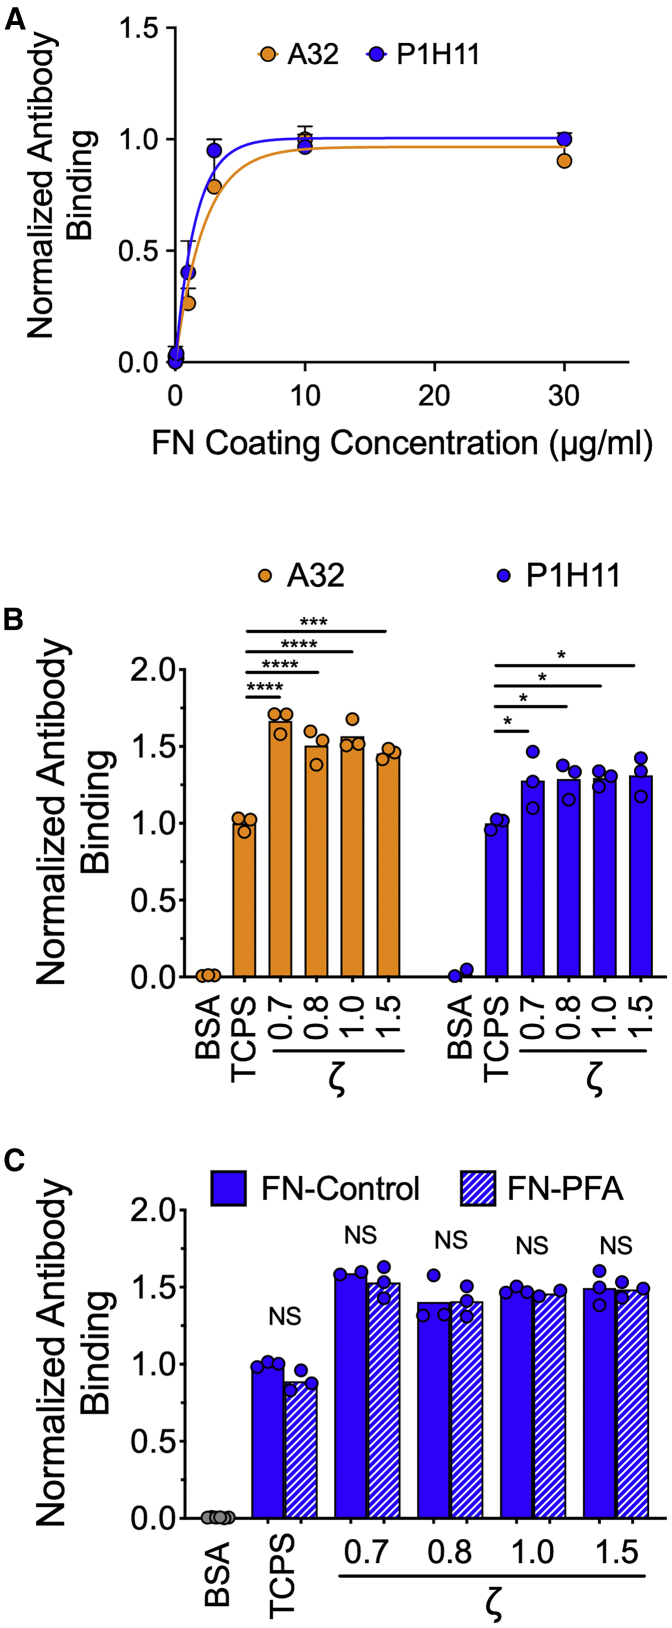
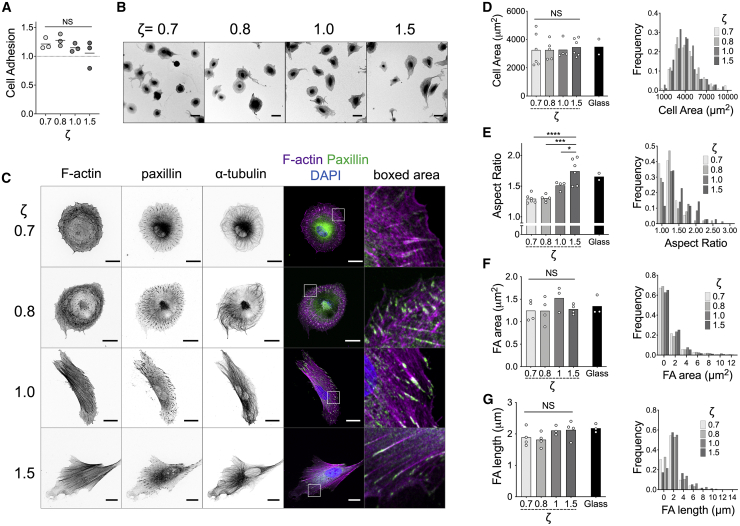
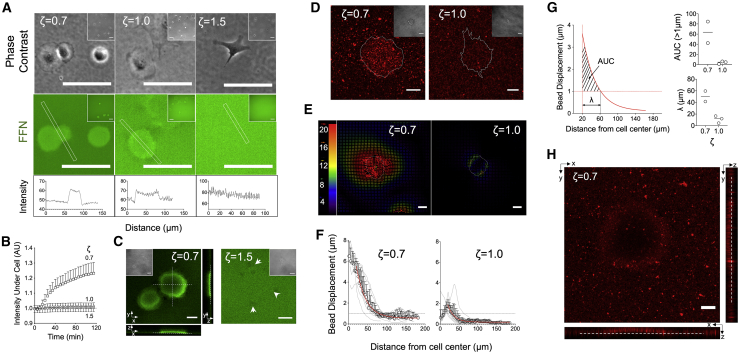
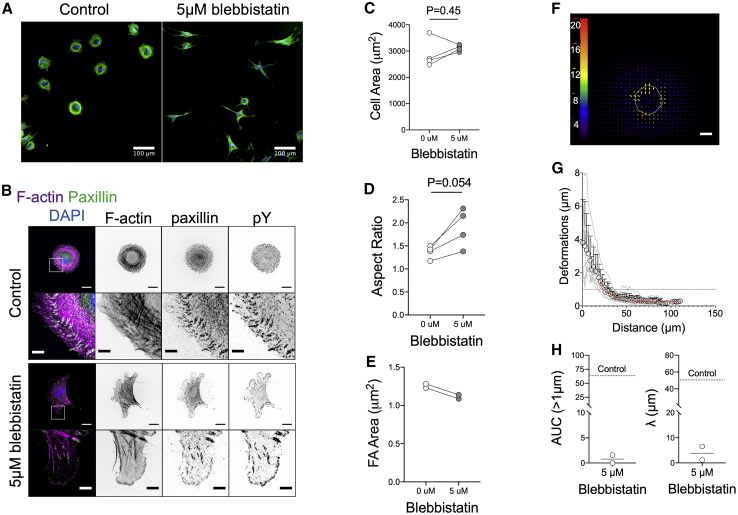
The mechanics of fibronectin-rich extracellular matrix regulate cell physiology in a number of diseases, prompting efforts to elucidate cell mechanosensing mechanisms at the molecular and cellular scale. Here, the use of fibronectin-functionalized silicone elastomers that exhibit considerable frequency dependence in viscoelastic properties unveiled the presence of two cellular processes that respond discreetly to substrate mechanical properties. Weakly cross-linked elastomers supported efficient focal adhesion maturation and fibroblast spreading because of an apparent stiff surface layer. However, they did not enable cytoskeletal and fibroblast polarization; elastomers with high cross-linking and low deformability were required for polarization. Our results suggest as an underlying reason for this behavior the inability of soft elastomer substrates to resist traction forces rather than a lack of sufficient traction force generation. Accordingly, mild inhibition of actomyosin contractility rescued fibroblast polarization even on the softer elastomers. Our findings demonstrate differential dependence of substrate physical properties on distinct mechanosensitive processes and provide a premise to reconcile previously proposed local and global models of cell mechanosensing.


Figures

Figure 1
Figure 1
Control over bulk viscoelasticity of silicone elastomers through the ratio of base polymer to cross-linker. (A) Storage (G) and loss (G) moduli were measured at a frequency of 1 Hz are independent of strain in the linear viscoelastic regime. (B) Gand G as a function of frequency for different ζ ratios. (C) Extrapolated values of storage modulus for zero frequency (G0) as a function of ζ. Data from N = 3 independent experiments are shown. (D) Dependence of exponent n (from G,G = a + bωn) on ratio ζ. Average values and range from N = 3. (E) Dependence of dissipation factor on ratio ζ (average values and range from N = 3); inset shows the relationship between G andG for data obtained from all elastomers and ζ ratios.G andG presented were obtained from measurements at 1 Hz frequency and 1% strain. (F) Creep experiments for elastomers with different ζ values and different imposed stresses (indicated on the graphs). For the stiffest elastomers (ζ = 1.5), applied stresses of 10 and 30 Pa did not produce measurable strains; therefore, only the maximal applied stress is presented. After stress removal (arrows), the elastomers relax to their original positions, indicating lack of bulk plastic deformations. To see this figure in color, go online.
Figure 2
Figure 2
The surface layer of silicone elastomers exhibits higher apparent stiffness because of solid surface tension. (A) Apparent Young’s moduli were determined by fitting F-d curves from AFM indentation measurements with the standard Hertz model (red data points) or a modified Hertz model that includes a linear term for the solid surface tension (blue data points). An indentation speed of 1 μm/s and a setpoint force of 10 nN were used for the measurements. The x marks indicate independent experiments, and the circles mean values and error bars SEM. (B) Apparent Young’s moduli were determined with the standard Hertz model as a function of indentation speed for elastomers of varying ζ. Data represent the average and error bars the SD from 75 measurements at different locations of the elastomers (one of two independent experiments shown). Data were fitted with a power law equation, with the fitted parameters given in the table. (C) Apparent Young’s moduli were determined with the standard Hertz model as a function of indentation depth for elastomers of varying ζ. The inset shows the data as a function of setpoint force. Data represent the average and error bars the SD from 75 measurements (one of two independent experiments shown). (D) A typical F-d curve derived from indentation of an elastomer with ζ = 0.7 along with best fits for the standard Hertz model and a modified Hertz model that includes a linear surface tension term. (E) Solid surface tension of silicone elastomers were derived from the modified Hertz model. The x symbols indicate independent experiments and the column the average value. To see this figure in color, go online.
Figure 3
Figure 3
Fibronectin coats elastomers of different mechanical properties with similar efficiency. (A) Coating efficiency of adsorbed FN on untreated silicone elastomers (ζ = 1.0) from FN solutions of different concentrations. FN was detected by a modified ELISA using two different monoclonal anti-FN antibodies; clone P1H11 recognizes the central cell binding domain and clone A32 the heparin II binding domain. Data from two independent experiments are presented; three replicates were measured in each experiment. Lines represent fits of the equation y = A(1 − e−kx). (B) Coating efficiency from a 10 μg/mL FN solution on untreated silicone elastomers of varying ζ, TCPS, and BSA-coated TCPS. FN adsorption to the substrate was similar on elastomers of different mechanical properties and higher compared to TCPS. Data from one (of two) independent experiment are presented; each data point represents one measurement and the column the mean value. Mean values for elastomers were compared to the control TCPS surface using one-way ANOVA: p < 0.05, ∗∗∗p < 0.001, and ∗∗∗∗p < 0.0001. (C) Coating efficiency from a 10 μg/mL FN solution on FN-coated substrates, untreated (control) or treated with 4% PFA to cross-link FN. Antibody (clone P1H11) binding to immobilized FN was not affected by PFA treatment. Data from one (of two) independent experiment are presented; each data point represents one measurement and the column the mean value. Mean values of PFA-treated samples were compared with controls for each substrate using an unpaired t-test: NSp > 0.05. To see this figure in color, go online.
Figure 4
Figure 4
Elastomer mechanics regulate fibroblast polarization but not spreading area or FA size. (A) Adhesion of pHDF on FN-coated elastomers, normalized to their adhesion on FN-coated TCPS, as a function of ζ. Each data point corresponds to an independent experiment with n = 3. Data were compared using one-way ANOVA: NSp > 0.05. (B) Confocal microscopy images of fixed pHDF seeded on FN-coated elastomers for 4 h and stained against F-actin using fluorescent phalloidin to highlight overall cell morphology. Scale bars, 50 μm. (C) High-magnification confocal microscopy images of fixed and immunostained pHDF seeded on FN-coated elastomer for 4 h. Scale bars, 20 μm. (DG) Column plots (left) showing the average values of cell area (D), aspect ratio (E), FA area (F), and FA length (G) of pHDF seeded on FN-coated elastomers as a function of ζ. Each data point corresponds to the mean value of an independent experiment. Histograms (right) show the relative distribution of values of one such independent experiment. FN-coated glass was used as a control. Mean values for the different elastomers in (DG) were compared using one-way ANOVA: p < 0.05; ∗∗∗p < 0.001; ∗∗∗∗p < 0.0001, and NSp > 0.05. To see this figure in color, go online.
Figure 5
Figure 5
Fibroblast traction forces lead to substrate deformations but not fibronectin fibril assembly. (A) Epifluorescence and phase contrast images of live pHDF seeded for 3 h on elastomers coated with fluorescently labeled FN (FFN). The intensity of FFN increased under the cell body on the softer (ζ = 0.7) elastomers. (B) Normalized FFN fluorescence intensity under the cell body normalized against background FFN intensity. Mean and SD from two independent experiments are presented (n = 10). (C) Confocal microscopy images of live pHDF seeded on FFN-coated elastomers. On the softer elastomers (ζ = 0.7), surface out-of-plane deformations were observed. Dashed lines and arrows are visual aids. (D) Confocal microscopy images of live pHDF seeded for 2 h on elastomers with immobilized fluorescent beads and coated with FN. (E) Particle image velocimetry (PIV) analysis from bead displacements on elastomers seeded with pHDF for 1 h was used to produce substrate deformation fields. The magnitude of the color-coded vectors is given in pixels, and the white line denotes the cell outline. (F) Bead displacements (deformations) as a function of distance from the cell center was calculated as detailed in the Methods for each cell (gray lines) and averaged (circles with SD). The data (mean ± SD, n = 9 for ζ = 0.7, and n = 14 for ζ = 1.0) were fitted using an exponential decay function (red line) starting from a distance of 20 μm, which corresponds to the typical cell radius. One of two independent experiments is presented. (G) Quantification of two parameters reflecting total substrate deformation and the deformation boundary from the cell edge based on the fitted curves from (F). A threshold value of 1 μm for the deformation vectors was selected to calculate the distance from the cell edge at which deformations drop below the threshold and the area under the fitted curve (AUC) correlating with total substrate deformation. Both the boundary distance and AUC were lower for the stiffer elastomers. Each data point corresponds to an independent experiment and the line the mean. (H) Confocal microscopy image of beads immobilized on a soft elastomer (ζ = 0.7), which is being deformed by a living cell. Orthogonal views are presented to better visualize the crater-like structure formed. Scale bars, 50 μm for (A) and 20 μm for (C, D, E, and H). To see this figure in color, go online.
Figure 6
Figure 6
Inhibition of myosin II contractility results in reduced substrate deformation and fibroblast polarization on soft elastomers. (A) Epifluorescence microscopy images of phalloidin-stained pHDF seeded for 3 h on soft elastomers (ζ = 0.7), treated with 5 μM blebbistatin or equivalent volume of carrier (DMSO). Nuclei are stained with 4′,6-diamidino-2-phenylindole (blue color). (B) Confocal microscopy images of fixed and immunostained pHDF seeded on soft, FN-coated elastomers (ζ = 0.7), treated with blebbistatin or DMSO. Scale bars, 20 μm/5 μm (details). Quantification of (C) cell area, (D) aspect ratio, and (E) FA area of pHDF cultured for 3 h on soft elastomers (ζ = 0.7), treated with 5 μM blebbistatin or equivalent volume of carrier (DMSO). Each data point represents the mean value of an independent experiment. Data in (C and D) were compared using unpaired t-tests. (F) Typical PIV analysis of bead displacements on an elastomer seeded with blebbistatin-treated pHDF for 1 h. The magnitude of the color-coded vectors is given in pixels and is the same as for Fig. 5E for comparison; the white line denotes the cell outline. Scale bar, 20 μm. (G) Deformation as a function of distance from the cell center for blebbistatin-treated pHDF cells. The data (mean ± SD, n = 8) were fitted using an exponential decay function (red line) starting from a distance of 20 μm, which corresponds to the typical cell radius. One of two independent experiments is presented. (H) Quantification of the boundary distance and AUC for the situation of blebbistatin-treated cells. Comparison with the mean value calculated for control cells (dashed line; data from Fig. 5G) shows how contractility inhibition lowers substrate deformations. To see this figure in color, go online.

Similar articles

Cited by

References

    1. Evans E.A., Calderwood D.A. Forces and bond dynamics in cell adhesion. Science. 2007;316:1148–1153. - PubMed
    1. Petridou N.I., Spiró Z., Heisenberg C.-P. Multiscale force sensing in development. Nat. Cell Biol. 2017;19:581–588. - PubMed
    1. Discher D.E., Smith L., Safran S. Matrix mechanosensing: from scaling concepts in 'omics data to mechanisms in the nucleus, regeneration, and cancer. Annu. Rev. Biophys. 2017;46:295–315. - PMC - PubMed
    1. Wolfenson H., Yang B., Sheetz M.P. Steps in mechanotransduction pathways that control cell morphology. Annu. Rev. Physiol. 2019;81:585–605. - PMC - PubMed
    1. Engler A.J., Sen S., Discher D.E. Matrix elasticity directs stem cell lineage specification. Cell. 2006;126:677–689. - PubMed

LinkOut - more resources