

ANK2 Hypermethylation in Canine Mammary Tumors and Human Breast Cancer
- PMID: 33218035
- PMCID: PMC7698701
- DOI: 10.3390/ijms21228697
ANK2 Hypermethylation in Canine Mammary Tumors and Human Breast Cancer
Abstract
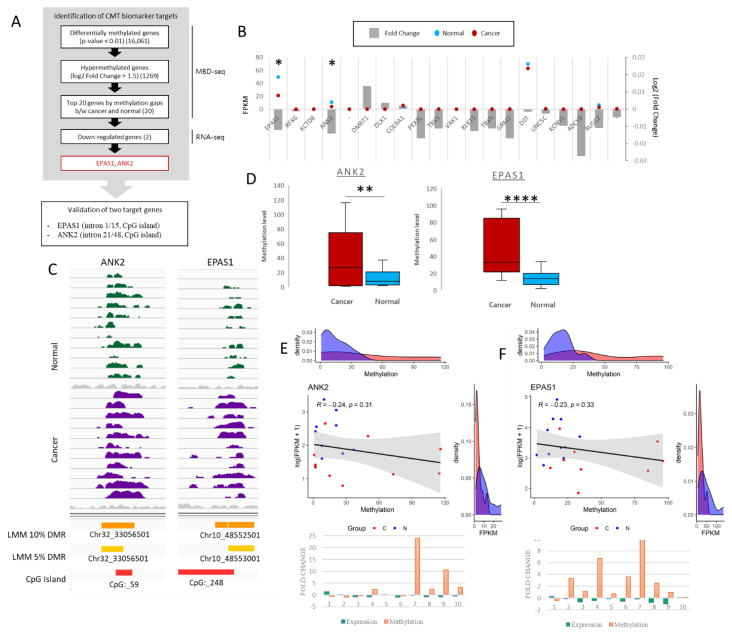
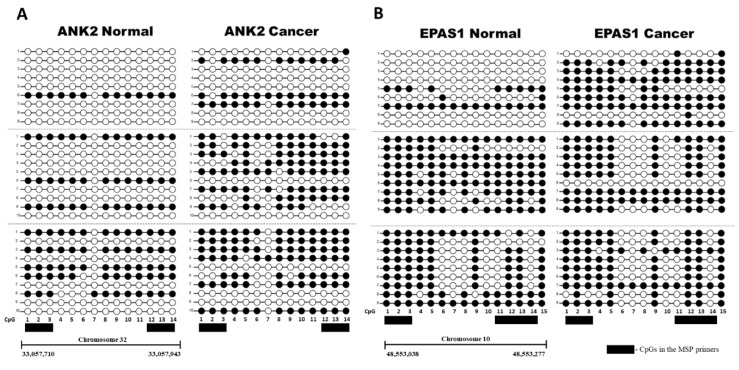
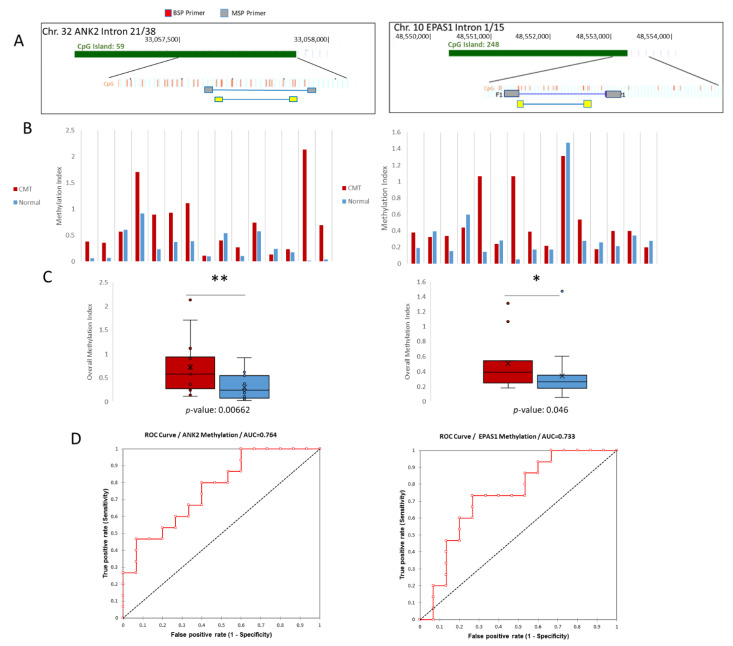
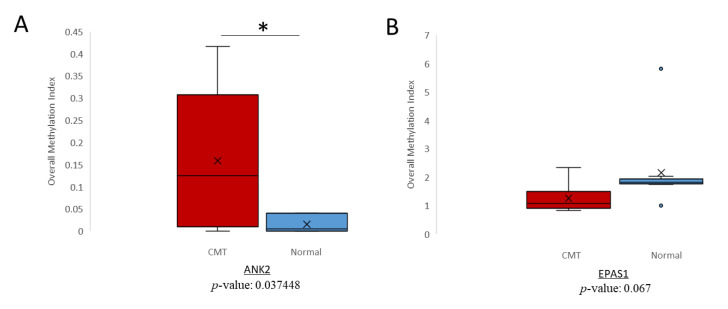
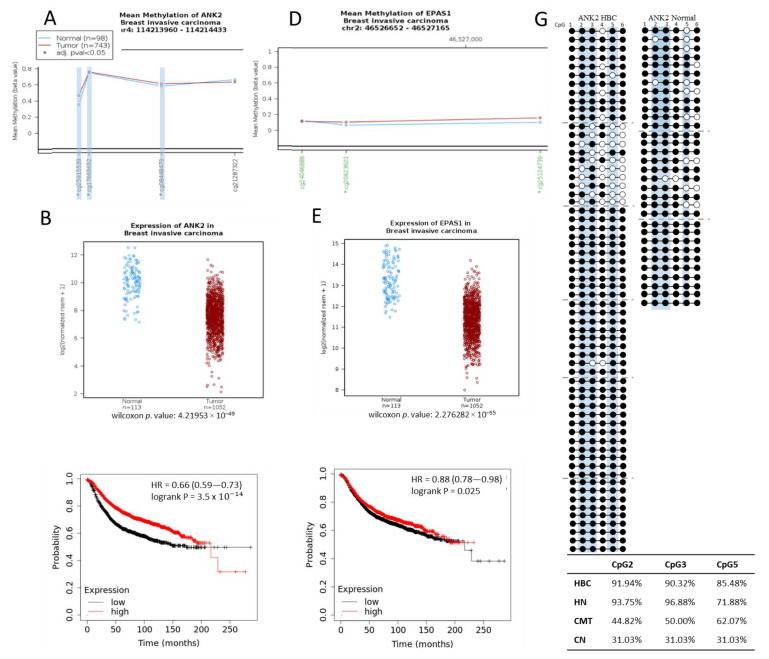
Canine mammary tumors (CMT) constitute the most common tumor types found in female dogs. Understanding this cancer through extensive research is important not only for clinical veterinary applications, but also in the scope of comparative oncology. The use of DNA methylation as a biomarker has been noted for numerous cancers in the form of both tissue and liquid biopsies, yet the study of methylation in CMT has been limited. By analyzing our canine methyl-binding domain sequencing (MBD-seq) data, we identified intron regions of canine ANK2 and EPAS1 as differentially methylated regions (DMGs) in CMT. Subsequently, we established quantitative methylation specific PCR (qMSP) of ANK2 and EPAS1 to validate the target hypermethylation in CMT tissue, as well as cell free DNA (cfDNA) from CMT plasma. Both ANK2 and EPAS1 were hypermethylated in CMT and highlighted as potential tissue biomarkers in CMT. ANK2 additionally showed significant hypermethylation in the plasma cfDNA of CMT, indicating that it could be a potential liquid biopsy biomarker as well. A similar trend towards hypermethylation was indicated in HBC at a specific CpG of the ANK2 target on the orthologous human region, which validates the comparative approach using aberrant methylation in CMT.
Keywords: CMT; HBC; biomarker; cfDNA; hypermethylation.
Conflict of interest statement
The authors declare no competing interests.
Figures
Similar articles
-
Alternative methylation of intron motifs is associated with cancer-related gene expression in both canine mammary tumor and human breast cancer.Clin Epigenetics. 2020 Jul 21;12(1):110. doi: 10.1186/s13148-020-00888-4. Clin Epigenetics. 2020. PMID: 32693820 Free PMC article.
-
Methylation of LINE-1 in cell-free DNA serves as a liquid biopsy biomarker for human breast cancers and dog mammary tumors.Sci Rep. 2019 Jan 17;9(1):175. doi: 10.1038/s41598-018-36470-5. Sci Rep. 2019. PMID: 30655558 Free PMC article.
-
Thyroglobulin as a negative marker for malignancy in canine and human breast tumors.Mol Carcinog. 2021 Jul;60(7):455-468. doi: 10.1002/mc.23304. Epub 2021 May 18. Mol Carcinog. 2021. PMID: 34003526
-
Molecular carcinogenesis of canine mammary tumors: news from an old disease.Vet Pathol. 2011 Jan;48(1):98-116. doi: 10.1177/0300985810390826. Epub 2010 Dec 13. Vet Pathol. 2011. PMID: 21149845 Review.
-
Current biomarkers of canine mammary tumors.Acta Vet Scand. 2018 Oct 29;60(1):66. doi: 10.1186/s13028-018-0417-1. Acta Vet Scand. 2018. PMID: 30373614 Free PMC article. Review.
Cited by
-
Dysregulated gene subnetworks in breast invasive carcinoma reveal novel tumor suppressor genes.Sci Rep. 2024 Jul 8;14(1):15691. doi: 10.1038/s41598-024-59953-0. Sci Rep. 2024. PMID: 38977697 Free PMC article.
-
The Analysis of E-Cadherin, N-Cadherin, Vimentin, HER-2, CEA, CA15-3 and SF Expression in the Diagnosis of Canine Mammary Tumors.Animals (Basel). 2022 Nov 6;12(21):3050. doi: 10.3390/ani12213050. Animals (Basel). 2022. PMID: 36359174 Free PMC article.
-
ALYREF enhances breast cancer progression by regulating EZH2.Heliyon. 2024 Sep 16;10(19):e37749. doi: 10.1016/j.heliyon.2024.e37749. eCollection 2024 Oct 15. Heliyon. 2024. PMID: 39386827 Free PMC article.
-
Comparative epigenomics to clinical trials in human breast cancer and canine mammary tumor.Anim Cells Syst (Seoul). 2025 Mar 19;29(1):12-30. doi: 10.1080/19768354.2025.2477024. eCollection 2025. Anim Cells Syst (Seoul). 2025. PMID: 40115961 Free PMC article. Review.
-
Antioxidant and Anti-inflammatory Effects of Marine Phlorotannins and Bromophenols Supportive of Their Anticancer Potential.Nutr Rev. 2025 Mar 1;83(3):e1225-e1242. doi: 10.1093/nutrit/nuae066. Nutr Rev. 2025. PMID: 38894623 Free PMC article. Review.
References
-
- Moe L. Population-based incidence of mammary tumours in some dog breeds. J. Reprod. Fertil. Suppl. 2001;57:439–443. - PubMed
MeSH terms
Substances
LinkOut - more resources
Full Text Sources
Other Literature Sources
Medical
