State-of-the-Art Optical Microfiber Coupler Sensors for Physical and Biochemical Sensing Applications
- PMID: 33218037
- PMCID: PMC7698761
- DOI: 10.3390/bios10110179
State-of-the-Art Optical Microfiber Coupler Sensors for Physical and Biochemical Sensing Applications
Abstract
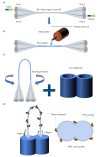
An optical fiber coupler is a simple and fundamental component for fiber optic technologies that works by reducing the fiber diameter to hundred nanometers or several micrometers. The microfiber coupler (MFC) has regained interest in optical fiber sensing in recent years. The subwavelength diameter rationales vast refractive index (RI) contrast between microfiber "core" and surrounding "cladding", a large portion of energy transmits in the form of an evanescent wave over the fiber surface that determines the MFC ultrasensitive to local environmental changes. Consequently, MFC has the potential to develop as a sensor. With the merits of easy fabrication, low cost and compact size, numerous researches have been carried out on different microfiber coupler configurations for various sensing applications, such as refractive index (RI), temperature, humidity, magnetic field, gas, biomolecule, and so on. In this manuscript, the fabrication and operation principle of an MFC are elaborated and recent advances of MFC-based sensors for scientific and technological applications are comprehensively reviewed.
Keywords: biosensors; chemical sensors; microfiber coupler; optical fiber; physical sensors; sensors.
Conflict of interest statement
The authors declare no conflict of interest.
Figures


Similar articles
-
Microfiber coupler based label-free immunosensor.Opt Express. 2014 Apr 7;22(7):8150-5. doi: 10.1364/OE.22.008150. Opt Express. 2014. PMID: 24718192
-
Modeling of a Single-Notch Microfiber Coupler for High-Sensitivity and Low Detection-Limit Refractive Index Sensing.Sensors (Basel). 2016 May 11;16(5):672. doi: 10.3390/s16050672. Sensors (Basel). 2016. PMID: 27187386 Free PMC article.
-
Microfiber Mach-Zehnder interferometer based on long period grating for sensing applications.Opt Express. 2013 Jan 14;21(1):154-64. doi: 10.1364/OE.21.000154. Opt Express. 2013. PMID: 23388906
-
Intensity-Modulated Polymer Optical Fiber-Based Refractive Index Sensor: A Review.Sensors (Basel). 2021 Dec 23;22(1):81. doi: 10.3390/s22010081. Sensors (Basel). 2021. PMID: 35009621 Free PMC article. Review.
-
Optical Fiber Probe Microcantilever Sensor Based on Fabry-Perot Interferometer.Sensors (Basel). 2022 Aug 1;22(15):5748. doi: 10.3390/s22155748. Sensors (Basel). 2022. PMID: 35957304 Free PMC article. Review.
Cited by
-
Study on a Plasmonic Tilted Fiber Grating-Based Biosensor for Calmodulin Detection.Biosensors (Basel). 2021 Jun 14;11(6):195. doi: 10.3390/bios11060195. Biosensors (Basel). 2021. PMID: 34198490 Free PMC article.
-
A Nano Refractive Index Sensing Structure for Monitoring Hemoglobin Concentration in Human Body.Nanomaterials (Basel). 2022 Oct 27;12(21):3784. doi: 10.3390/nano12213784. Nanomaterials (Basel). 2022. PMID: 36364566 Free PMC article.
-
A Nanoscale Structure Based on an MIM Waveguide Coupled with a Q Resonator for Monitoring Trace Element Concentration in the Human Body.Micromachines (Basel). 2021 Nov 11;12(11):1384. doi: 10.3390/mi12111384. Micromachines (Basel). 2021. PMID: 34832796 Free PMC article.
-
Microfluidic immunosensor based on a graphene oxide functionalized double helix microfiber coupler for anti-Müllerian hormone detection.Biomed Opt Express. 2023 Mar 2;14(4):1364-1377. doi: 10.1364/BOE.486717. eCollection 2023 Apr 1. Biomed Opt Express. 2023. PMID: 37078032 Free PMC article.
-
A Nanoscale Sensor Based on a Toroidal Cavity with a Built-In Elliptical Ring Structure for Temperature Sensing Application.Nanomaterials (Basel). 2022 Sep 28;12(19):3396. doi: 10.3390/nano12193396. Nanomaterials (Basel). 2022. PMID: 36234531 Free PMC article.
References
-
- Patrick H.J., Williams G.M. Hybrid fiber Bragg grating/long period fiber grating sensor for strain/temperature discrimination. IEEE Photonics Technol. Lett. 1996;8:1223–1225. doi: 10.1109/68.531843. - DOI
-
- Kersey A.D., Davis M.A. Fiber grating sensors. J. Lightwave Technol. 1997;15:1442–1463. doi: 10.1109/50.618377. - DOI
-
- Fu H.Y., Liu H.L., Dong X., Tam H.Y., Wai K.A., Lu C. High-speed fibre Bragg grating sensor interrogation using dispersion-compensation fibre. Electron. Lett. 2008;44:618–619. doi: 10.1049/el:20080859. - DOI
-
- Vengsarkar A.M. Long-period fiber grating as band-rejection filters. J. Lightwave Technol. 1996;14:58–65. doi: 10.1109/50.476137. - DOI
-
- Bock W.J., Chen J., Mikulic P., Eftimov T. A Novel Fiber-Optic Tapered Long-Period Grating Sensor for Pressure Monitoring. IEEE T Instrum. Meas. 2007;56:1176–1180. doi: 10.1109/TIM.2007.899904. - DOI
Publication types
MeSH terms
LinkOut - more resources
Full Text Sources

