

Melatonin Can Modulate the Effect of Navitoclax (ABT-737) in HL-60 Cells
- PMID: 33218059
- PMCID: PMC7698880
- DOI: 10.3390/antiox9111143
Melatonin Can Modulate the Effect of Navitoclax (ABT-737) in HL-60 Cells
Abstract
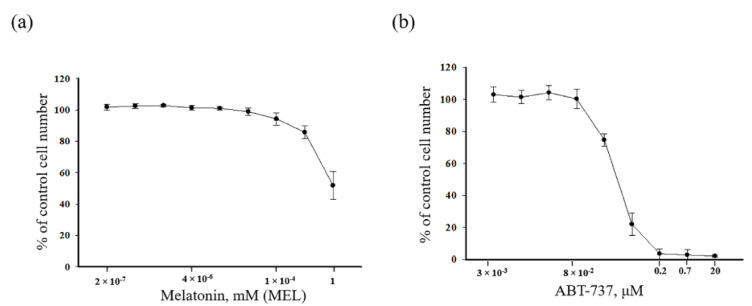
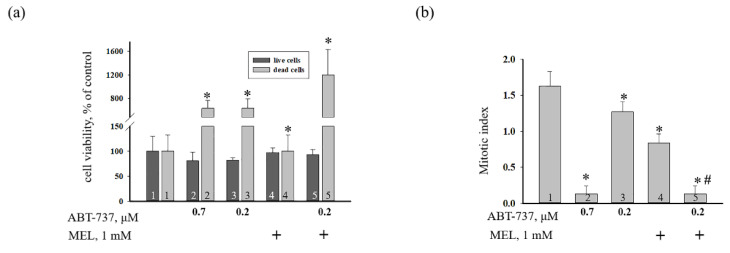
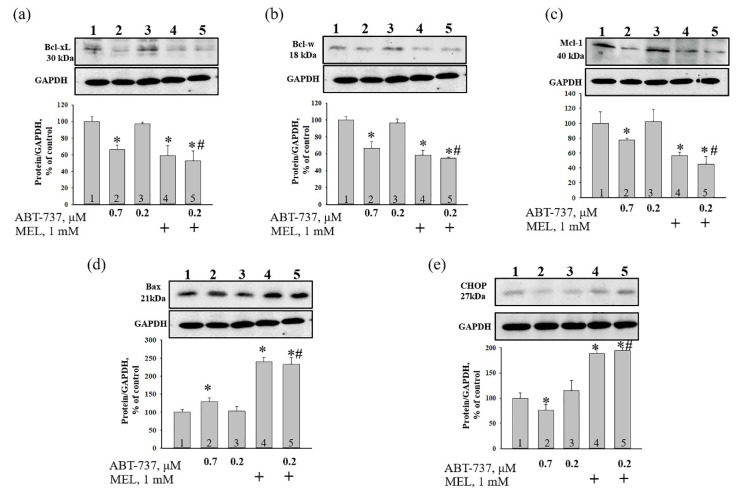
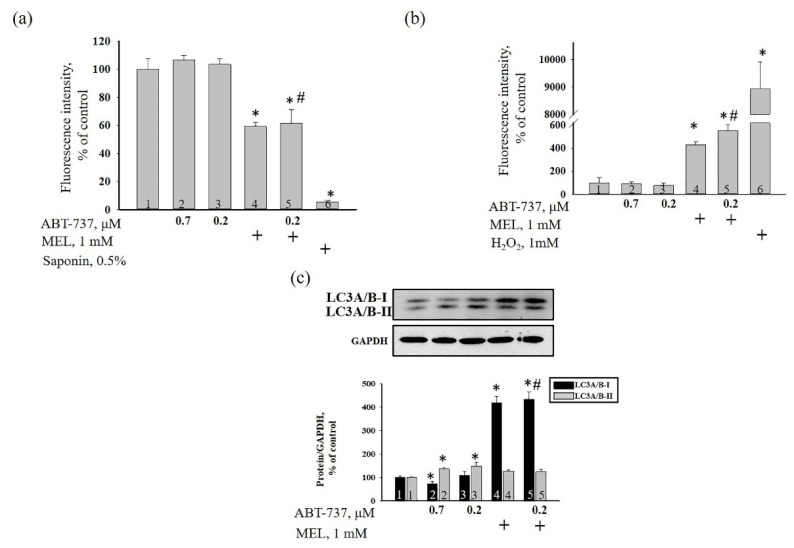
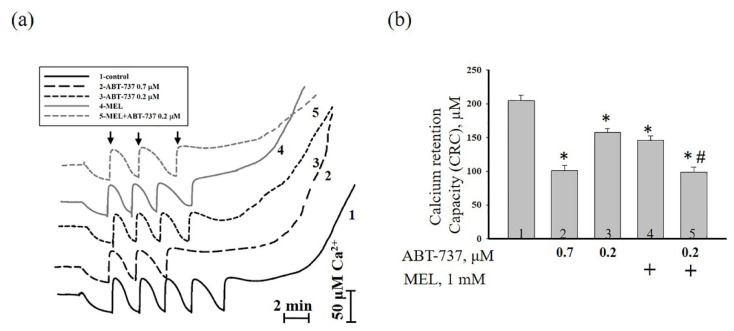
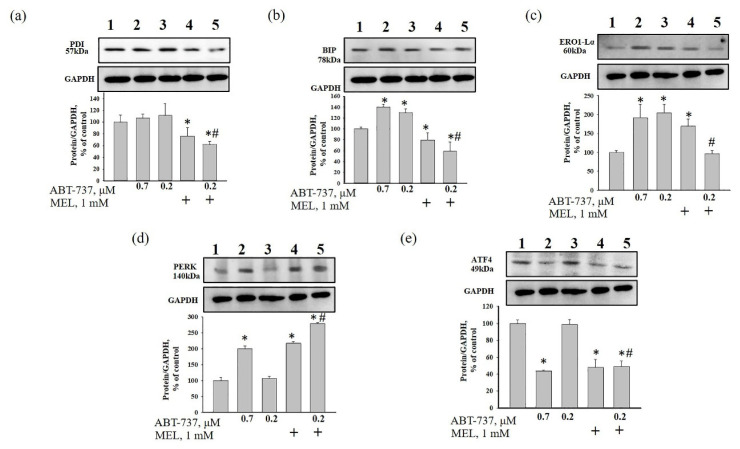
Melatonin (N-acetyl-5-methoxytryptamine MEL) is an indolamine that has antioxidant, anti-inflammatory and anti-tumor properties. Moreover, MEL is capable of exhibiting both anti-apoptotic and pro-apoptotic effects. In the normal cells, MEL possesses antioxidant property and has an anti-apoptotic effect, while in the cancer cells it has pro-apoptotic action. We investigated the combined effect of MEL and navitoclax (ABT-737), which promotes cell death, on the activation of proliferation in acute promyelocytic leukemia on a cell model HL-60. The combined effect of these compounds leads to a reduction of the index of mitotic activity. The alterations in the level of anti- and pro-apoptotic proteins such as BclxL, Bclw, Mcl-1, and BAX, membrane potential, Ca2+ retention capacity, and ROS production under the combined action of MEL and ABT-737 were performed. We obtained that MEL in combination with ABT-737 decreased Ca2+ capacity, dropped membrane potential, increased ROS production, suppressed the expression of anti-apoptotic proteins such as BclxL, Bclw, and Mcl-1, and enhanced the expression of pro-apoptotic BAX. Since, MEL modulates autophagy and endoplasmic reticulum (ER) stress in cancer cells, the combined effect of MEL and ABT-737 on the expression of ER stress and autophagy markers was checked. The combined effect of MEL and ABT-737 (0.2 μM) increased the expression of protein kinase R (PKR)-like endoplasmic reticulum kinase (PERK), leading to a decrease in the level of binding immunoglobulin protein (BIP) followed by an increase in the level of C/EBP homologous protein (CHOP). In this condition, the expression of ERO1 decreased, which could lead to a decrease in the level of protein disulfide isomerase (PDI). The obtained data suggested that melatonin has potential usefulness in the treatment of cancer, where it is able to modulate ER stress, autophagy and apoptosis.
Keywords: HL-60 cells; acute promyelocytic leukemia; apoptosis; autophagy; endoplasmic reticulum stress; melatonin; navitoclax (ABT-737); permeability transition pore.
Conflict of interest statement
The authors declare no conflict of interest.
Figures
Similar articles
-
Melatonin as a Potential Multitherapeutic Agent.J Pers Med. 2021 Apr 6;11(4):274. doi: 10.3390/jpm11040274. J Pers Med. 2021. PMID: 33917344 Free PMC article. Review.
-
Melatonin Can Enhance the Effect of Drugs Used in the Treatment of Leukemia.Biochemistry (Mosc). 2023 Jan;88(1):73-85. doi: 10.1134/S0006297923010078. Biochemistry (Mosc). 2023. PMID: 37068876
-
[Melatonin Enhances the Effect of ABT-737 in Acute Monocytic Leukemia THP-1 Cells].Mol Biol (Mosk). 2024 Jan-Feb;58(1):141-153. doi: 10.31857/S0026898424010136. Mol Biol (Mosk). 2024. PMID: 38943585 Russian.
-
ABT-263 exhibits apoptosis-inducing potential in oral cancer cells by targeting C/EBP-homologous protein.Cell Oncol (Dordr). 2019 Jun;42(3):357-368. doi: 10.1007/s13402-019-00431-5. Epub 2019 Mar 27. Cell Oncol (Dordr). 2019. PMID: 30919222
-
Melatonin and endoplasmic reticulum stress: relation to autophagy and apoptosis.J Pineal Res. 2015 Oct;59(3):292-307. doi: 10.1111/jpi.12264. Epub 2015 Aug 9. J Pineal Res. 2015. PMID: 26201382 Review.
Cited by
-
ABT‑737 increases cisplatin sensitivity through the ROS‑ASK1‑JNK MAPK signaling axis in human ovarian cancer cisplatin‑resistant A2780/DDP cells.Oncol Rep. 2024 Sep;52(3):122. doi: 10.3892/or.2024.8781. Epub 2024 Jul 26. Oncol Rep. 2024. PMID: 39054955 Free PMC article.
-
Melatonin as a Potential Multitherapeutic Agent.J Pers Med. 2021 Apr 6;11(4):274. doi: 10.3390/jpm11040274. J Pers Med. 2021. PMID: 33917344 Free PMC article. Review.
-
How We Can Change Clinical Practice Using Antioxidant Molecules?Antioxidants (Basel). 2022 Jun 4;11(6):1116. doi: 10.3390/antiox11061116. Antioxidants (Basel). 2022. PMID: 35740013 Free PMC article.
-
Melatonin as a regulator of apoptosis in leukaemia: molecular mechanism and therapeutic perspectives.Front Pharmacol. 2023 Aug 14;14:1224151. doi: 10.3389/fphar.2023.1224151. eCollection 2023. Front Pharmacol. 2023. PMID: 37645444 Free PMC article. Review.
-
Leonurine Protects Bone Mesenchymal Stem Cells from Oxidative Stress by Activating Mitophagy through PI3K/Akt/mTOR Pathway.Cells. 2022 May 24;11(11):1724. doi: 10.3390/cells11111724. Cells. 2022. PMID: 35681421 Free PMC article.
References
-
- Acuna-Castroviejo D., Escames G., Venegas C., Diaz-Casado M.E., Lima-Cabello E., Lopez L.C., Rosales-Corral S., Tan D.-X., Reiter R.J. Extrapineal melatonin: Sources, regulation, and potential functions. Cell. Mol. Life Sci. CMLS. 2014;71:2997–3025. doi: 10.1007/s00018-014-1579-2. - DOI - PMC - PubMed
-
- Reiter R.J., Tan D.X., Fuentes-Broto L. Melatonin: A multitasking molecule. Prog. Brain Res. 2010;181:127–151. - PubMed
-
- Fernandez-Mar M.I., Mateos R., Garcia-Parrilla M.C., Puertas B., Cantos-Villar E. Bioactive compounds in wine: Resveratrol, hydroxytyrosol and melatonin: A review. Food Chem. 2012;130:797–813. doi: 10.1016/j.foodchem.2011.08.023. - DOI
-
- Baburina Y.L., Odinokova I.V., Krestinina O.V. The proapoptotic effect of melatonin on the functioning of the nonspecific mitochondrial pore (mptp) in rat mitochondria. Neurochem. J. 2019;13:156–163. doi: 10.1134/S1819712419020028. - DOI
Grants and funding
LinkOut - more resources
Full Text Sources
Research Materials
Miscellaneous
