. 2020 Nov 18;21(22):8711.
doi: 10.3390/ijms21228711.

PNPLA3 I148M Up-Regulates Hedgehog and Yap Signaling in Human Hepatic Stellate Cells

Affiliations

PNPLA3 I148M Up-Regulates Hedgehog and Yap Signaling in Human Hepatic Stellate Cells

Francesca Virginia Bruschi et al. Int J Mol Sci. .

Abstract

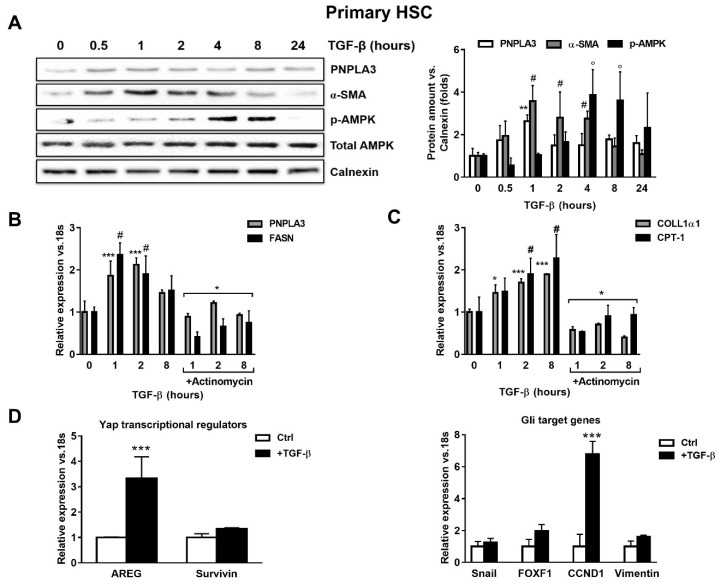
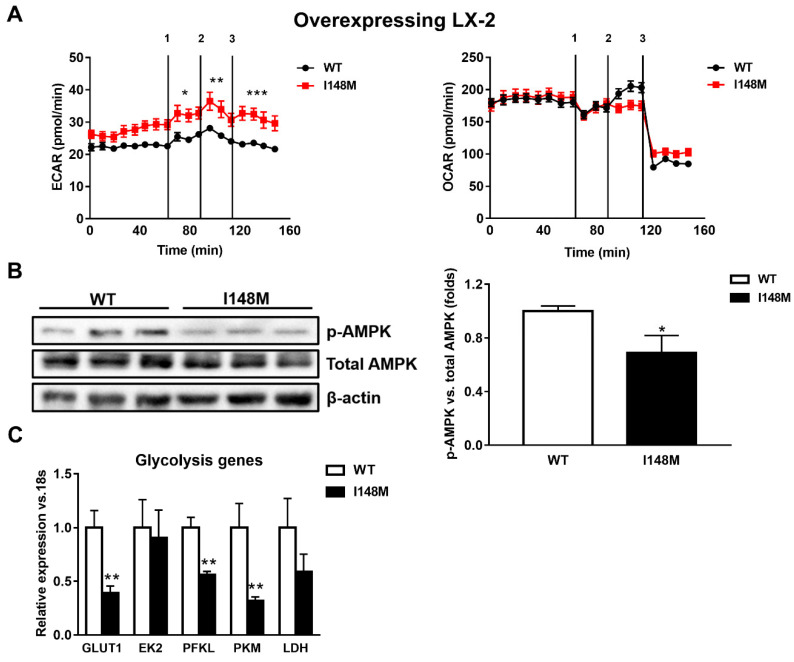
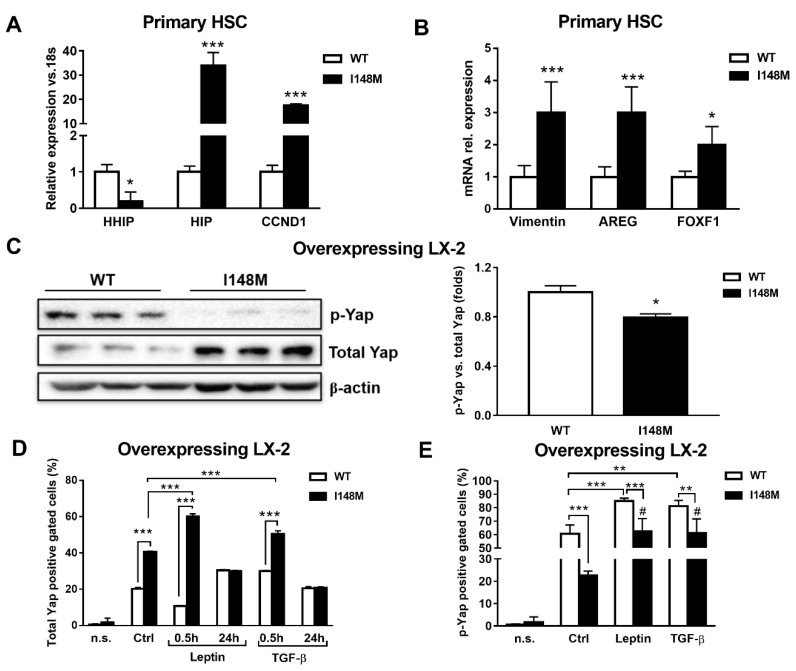
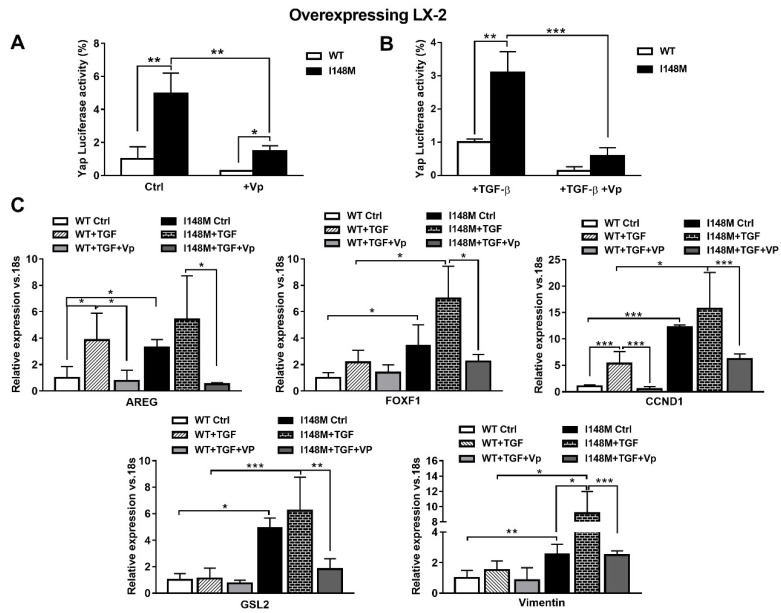
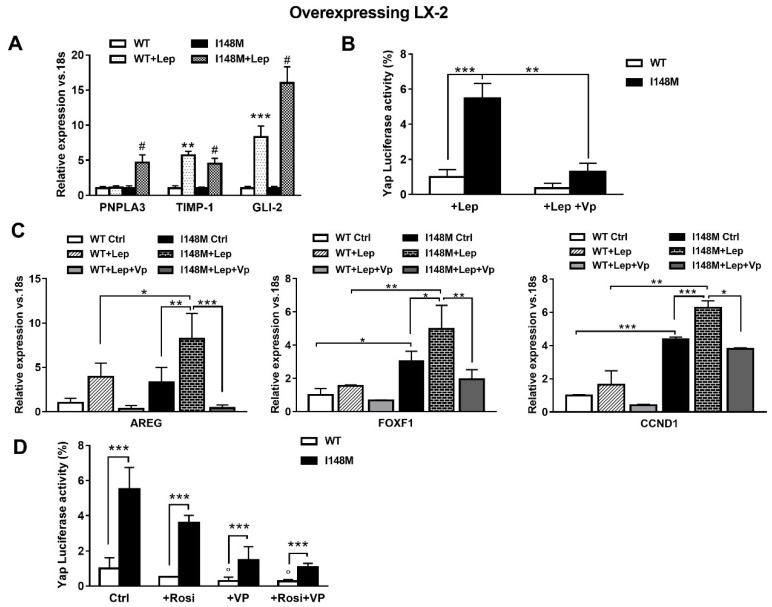
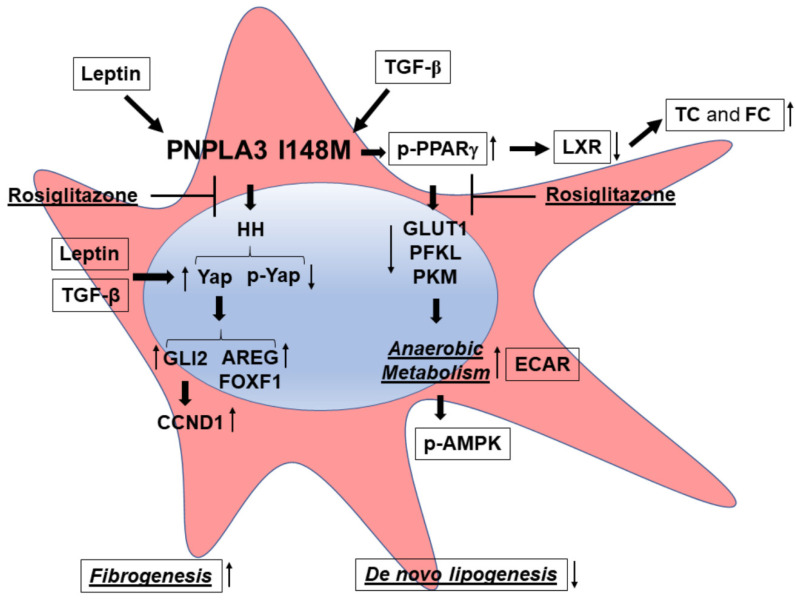
Liver fibrosis represents the wound healing response to sustained hepatic injury with activation of hepatic stellate cells (HSCs). The I148M variant of the PNPLA3 gene represents a risk factor for development of severe liver fibrosis. Activated HSCs carrying the I148M variant display exacerbated pro-inflammatory and pro-fibrogenic features. We aimed to examine whether the I148M variant may impair Hedgehog and Yap signaling, as key pathways implicated in the control of energy expenditure and maintenance of myofibroblastic traits. First, we show that TGF-β rapidly up-regulated the PNPLA3 transcript and protein and Yap/Hedgehog target gene expression. In addition, HSCs overexpressing PNPLA3 I148M boosted anaerobic glycolysis, as supported by higher lactate release and decreased phosphorylation of the energy sensor AMPK. These cells displayed higher Yap and Hedgehog signaling, due to accumulation of total Yap protein, Yap promoter activity and increased downstream targets expression, compared to WT cells. HSCs exposed to TGF-β and leptin rapidly increased total Yap, together with a reduction in its inhibited form, phosphorylated Yap. In line, Yap-specific inhibitor Verteporfin strongly abolished Yap-mediated genes expression, at baseline as well as after TGF-β and leptin treatments in HSCs with I148M PNPLA3. Finally, Yap transcriptional activity was strongly reduced by a combination of Verteporfin and Rosiglitazone, a PPARγ synthetic agonist. In conclusion, HSCs carrying the PNPLA3 variant show activated Yap/Hedgehog pathways, resulting in altered anaerobic glycolysis and enhanced synthesis of Hedgehog markers and sustained Yap signaling. TGF-β and leptin exacerbate Yap/Hedgehog-related fibrogenic genes expression, while Yap inhibitors and PPARγ agonists abrogate these effects in PNPLA3 I148M carrying HSCs.

Keywords: cell metabolism; genetic polymorphism; intracellular signaling; non-alcoholic fatty liver disease.


Conflict of interest statement

Michael Trauner received speaker fees from Bristol-Myers Squibb (BMS), Falk Foundation, Gilead, Intercept and Merck Sharp & Dohme (MSD); advisory board fees from Albireo, BiomX, Boehringer Ingelheim, Falk Pharma GmbH, GENFIT, Gilead, Intercept, Jannsen, MSD, Novartis, Phenex, and Regulus; travel grants from AbbVie, Falk, Gilead and Intercept; and unrestricted research grants from Albireo, CymaBay, Falk, Gilead, Intercept, MSD and Takeda. He is also coinventor of patents on the medical use of norUDCA filed by the Medical University of Graz. All the other authors declare no conflicts of interest.

Figures

Figure 1
Figure 1
TGF-β increases PNPLA3 and modulates AMPK signaling and Yap/Hedgehog target genes in hepatic stellate cells (HSCs). Primary HSCs (Ctrl) or treated with 5 ng/mL TGF-β at different time points, as indicated in the figure panel. Indicated cells were exposed to Actinomycin for 1h prior TGF-β stimulation. (A) Representative blots of PNPLA3, α-SMA, p-AMPK and total AMPK were performed on total protein extracts collected from primary HSCs. Densitometry analysis was calculated using ImageJ software and data were normalized to Calnexin. ** = p < 0.01 vs. PNPLA3 without TGF-β (time 0), # = p < 0.01 vs. α-SMA without TGF-β (time 0), ° = p < 0.001 vs. p-AMPK without TGF-β (time 0). (B,C) Expression of PNPLA3, FASN COLL1α1 and CPT-1 was analyzed by real-time PCR and normalized to 18s. *** = p < 0.001 vs. PNPLA3 without TGF-β (time 0), # = p < 0.01 vs. FASN without TGF-β (time 0), * = p < 0.001 vs. PNPLA3 and FASN with only TGF-β at different time points (1, 2, 8 h), * = p < 0.05, ***= p < 0.001 vs. COLL1α1 without TGF-β (time 0), # = p < 0.001 vs. CPT-1 without TGF-β (time 0) and * = p < 0.001 vs. COLL1α1 and CPT-1 treated with only TGF-β at different time points (1, 2, 8 h). (D) Expression of Yap regulators and glioma associated oncogene homolog (GLI) target genes expression: AREG, Survivin, Snail, FOXF1, CCND1 and Vimentin, were analyzed by real-time PCR and normalized to 18s. *** = p < 0.001 vs. Ctrl (without TGF-β, white bars). Data displayed represent four independent experiments performed in duplicates. Data shown as mean values ± SD.
Figure 2
Figure 2
LX-2 with the PNPLA3 genetic variant shows activated anaerobic glycolysis. LX-2 stably overexpressing cells (n = 3 each PNPLA3 genotype, WT or I148M) was obtained and cultivated in vitro, as described in Materials and Methods. (A) Lactate production (extracellular acidification rate (ECAR), pmol/min) and oxygen consumption rates (OCR, pmol/min) were measured in the culture medium, as described in Materials and Methods. * = p < 0.05, ** = p < 0.01, *** = p < 0.001 vs. WT cells. Separated injection of 1 = oligomycin; 2 = FCCP; and 3 = rotenone and antimycin A. (B) Representative blots of phospho-AMPK (p-AMPK) were performed on total protein extracts. Densitometry analysis was calculated using ImageJ software and data were normalized to β-actin. * = p < 0.05 vs. WT cells. (C) Expression of glycolytic genes, such as GLUT1, EK2, PFKL, PFKM and LDH was analyzed by real-time PCR and normalized to 18s. ** = p < 0.01 vs. WT cells. Data displayed represent three independent experiments performed in duplicates. Data shown as mean values ± SD.
Figure 3
Figure 3
Up-regulated Hedgehog targets result in activation of Yap in HSCs carrying I148M PNPLA3. Primary HSCs and LX-2 stably overexpressing cells (n = 3 each PNPLA3 genotype) were cultivated in vitro, as described in Materials and Methods. Where indicated, cells were stimulated with Leptin or TGF-β 1h prior to the analysis. (A,B) Expression of HHIP, HIP, CCND1, AREG, Vimentin and FOXF1 was analyzed by real-time PCR in primary HSCs carrying WT or I148M PNPLA3 and normalized to 18s. * = p < 0.05, *** = p < 0.001 vs. WT HSCs. (C) Representative blots of phosphorylated Yap (p-Yap) and total Yap were performed on total protein extracts collected from LX-2 overexpressing WT or I148M PNPLA3. Densitometry analysis was calculated using ImageJ software and data were normalized to β-actin. * = p < 0.05 vs. WT cells. (D) Total Yap intracellular staining was analyzed by flow cytometry in LX-2 overexpressing WT or I148M PNPLA3. Data displayed as percentage (%) of gated total Yap-positive cells. *** = p < 0.001 vs. the groups indicated in the bar graph. (E) p-Yap intracellular staining was analyzed by flow cytometry in LX-2 overexpressing either WT or I148M PNPLA3. Data displayed as percentage (%) of gated p-Yap-positive cells. ** = p < 0.01, *** = p < 0.001 vs. the groups indicated in the bar graph. # = p < 0.01 vs. WT cells treated with Leptin or TGF-β. n.s.= not stained cells. Ctrl = untreated cells. Data displayed represent three independent experiments performed in duplicates. Data shown as mean values ± SD.
Figure 4
Figure 4
Verteporfin inhibits TGF-β mediated Hedgehog/Yap target gene expression. LX-2 stably overexpressing cells (n = 3 each PNPLA3 genotype) was obtained and cultivated in vitro, as described in Materials and Methods. Where indicated, cells were stimulated with Vp and TGF-β, respectively, for 24 and 1 h prior to the analysis. (A) Luciferase activity (%) in HSCs transiently transfected with Yap-promoter luciferase construct untreated (Ctrl) or treated with Vp. * = p < 0.05, **= p < 0.01 as indicated in the graph. (B) Luciferase activity in HSCs transiently transfected with Yap luciferase construct and treated with only TGF-β or with combination of TGF-β + Vp. ** = p < 0.01, *** = p < 0.001 as indicated in the graph. (C) Expression of AREG, FOXF1, CCND1, GLS-2 and Vimentin was analyzed by real-time PCR and normalized to 18s. * = p < 0.05, ** = p < 0.01, *** = p < 0.001 between groups as indicated in the graph. Data displayed represent three independent experiments performed in duplicates. Data shown as mean values ± SD.
Figure 5
Figure 5
Verteporfin down-regulates leptin-mediated Hedgehog/Yap target gene expression. LX-2 stably overexpressing cells (n = 3 each PNPLA3 genotype) was obtained and cultivated in vitro, as described in Materials and Methods. Where indicated, cells were stimulated with Vp and Lep, respectively, for 24 and 1 h prior to the analysis. (A) Expression of PNPLA3, TIMP-1 and GLI-2 was analyzed by real-time PCR and normalized to 18s. ** = p < 0.01, *** = p < 0.001 vs. WT; # = p < 0.001 vs. I148M. (B) Luciferase activity (%) in HSCs transiently transfected with Yap promoter luciferase construct and treated with Lep alone or combination of Lep + Vp. ** = p < 0.01, *** = p < 0.001 as indicated in the graph. (C) Expression of AREG, FOXF1 and CCND1 was analyzed by real-time PCR and normalized to 18s. * = p < 0.05, ** = p < 0.01, *** = p < 0.001 between groups as indicated in the graph. (D) Luciferase activity in HSCs transiently transfected with Yap promoter luciferase construct and treated with Vp alone, Rosiglitazone (Rosi) alone or the combination of both. *** = p < 0.001 vs. relative WT bar; ° = p < 0.01 vs. relative WT Ctrl.
Figure 6
Figure 6
PNPLA3 I148M promotes activation of HH signaling and its downstream target Yap. Summary scheme representing the major molecular steps characterizing the phenotype of I148M HSCs. The presence of the PNPLA3 genetic variant leads to disturbed PPARγ and LXR signaling (accumulation of total cholesterol = TC and free cholesterol = FC), resulting in activation of Hedgehog (HH) and Yap signaling and an increase in anaerobic metabolism (higher ECAR and diminished expression of GLUT1, PFKL, PKM). Both TGF-β and Leptin induce expression of Yap, as a target of the HH pathway, and its downstream effectors (Vimentin, FOXF1, AREG, CCND1). Inhibition of Yap by Rosiglitazone leads to decreased Yap transcriptional activity in HSCs carrying PNPLA3 I148M.

Similar articles

Cited by

References

    1. Alkhouri N., Lawitz E., Noureddin M. Looking Into the Crystal Ball: Predicting the Future Challenges of Fibrotic NASH Treatment. Hepatol. Commun. 2019;3:605–613. doi: 10.1002/hep4.1342. - DOI - PMC - PubMed
    1. Angulo P., Kleiner D.E., Dam-Larsen S., Adams L.A., Bjornsson E.S., Charatcharoenwitthaya P., Mills P.R., Keach J.C., Lafferty H.D., Stahler A., et al. Liver Fibrosis, but No Other Histologic Features, Is Associated With Long-term Outcomes of Patients With Nonalcoholic Fatty Liver Disease. Gastroenterology. 2015;149:389–397. doi: 10.1053/j.gastro.2015.04.043. - DOI - PMC - PubMed
    1. Vilar-Gomez E., Calzadilla-Bertot L., Wong V.W.-S., Castellanos M., La Fuente R.A.-D., Metwally M., Eslam M., Gonzalez-Fabian L., Sanz M.A.-Q., Conde-Martin A.F., et al. Fibrosis Severity as a Determinant of Cause-Specific Mortality in Patients With Advanced Nonalcoholic Fatty Liver Disease: A Multi-National Cohort Study. Gastroenterology. 2018;155:443–457. doi: 10.1053/j.gastro.2018.04.034. - DOI - PubMed
    1. Diehl A.M., Day C. Cause, Pathogenesis, and Treatment of Nonalcoholic Steatohepatitis. N. Engl. J. Med. 2017;377:2063–2072. doi: 10.1056/NEJMra1503519. - DOI - PubMed
    1. Marcellin P., Kutala B.K. Liver diseases: A major, neglected global public health problem requiring urgent actions and large-scale screening. Liver Int. 2018;38:2–6. doi: 10.1111/liv.13682. - DOI - PubMed

MeSH terms

LinkOut - more resources