. 2020 Nov 18;12(11):3428.
doi: 10.3390/cancers12113428.

Immune Phenotypes of Nasopharyngeal Cancer

Affiliations

Immune Phenotypes of Nasopharyngeal Cancer

Johan S Nilsson et al. Cancers (Basel). .

Abstract

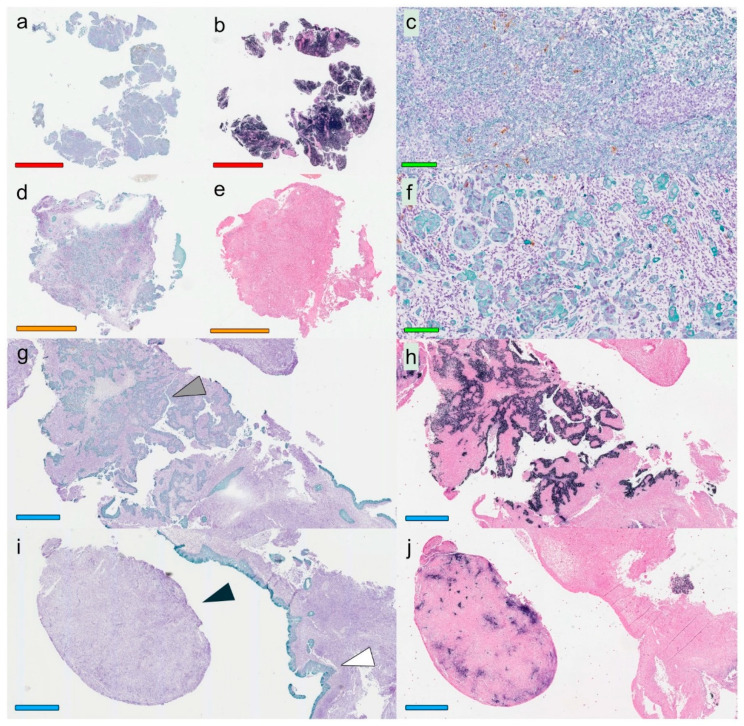
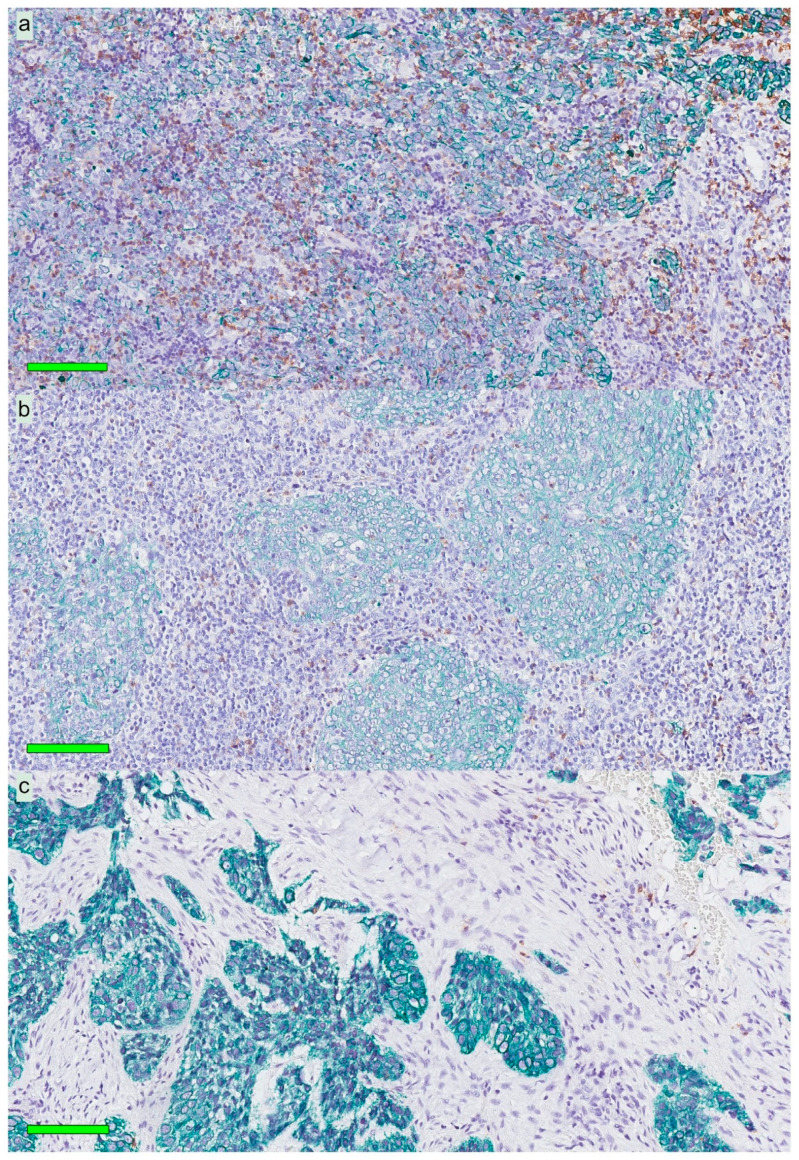
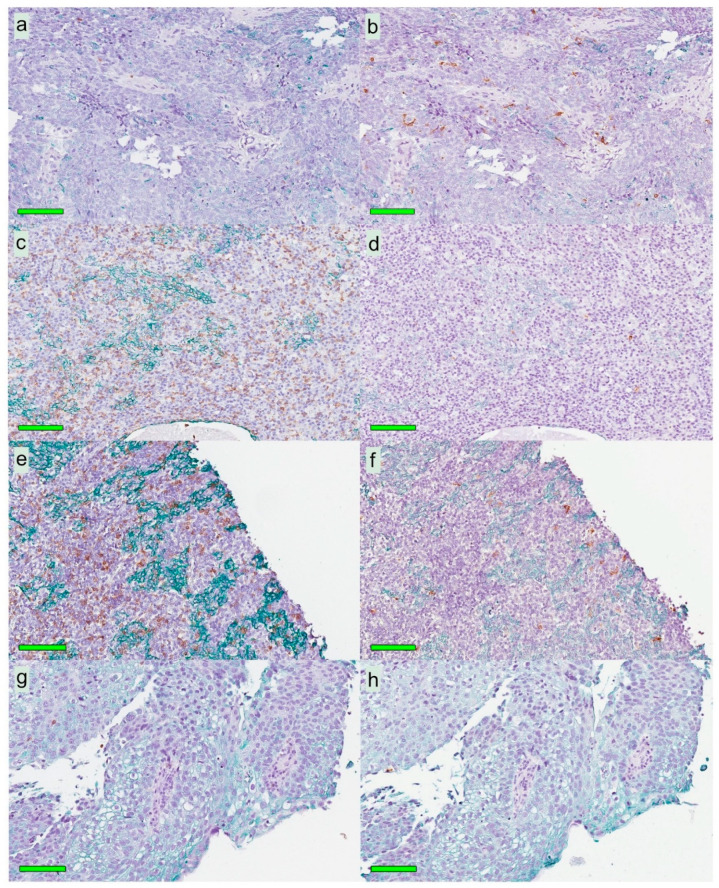
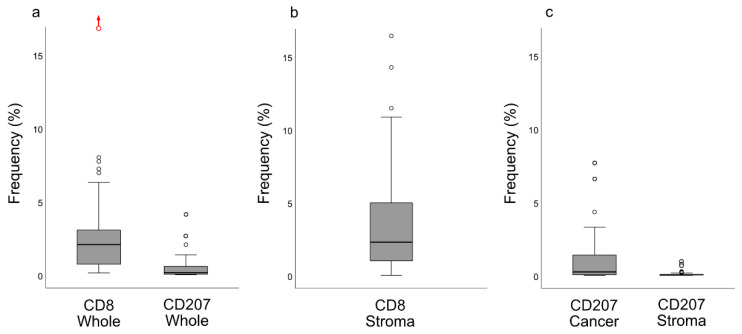
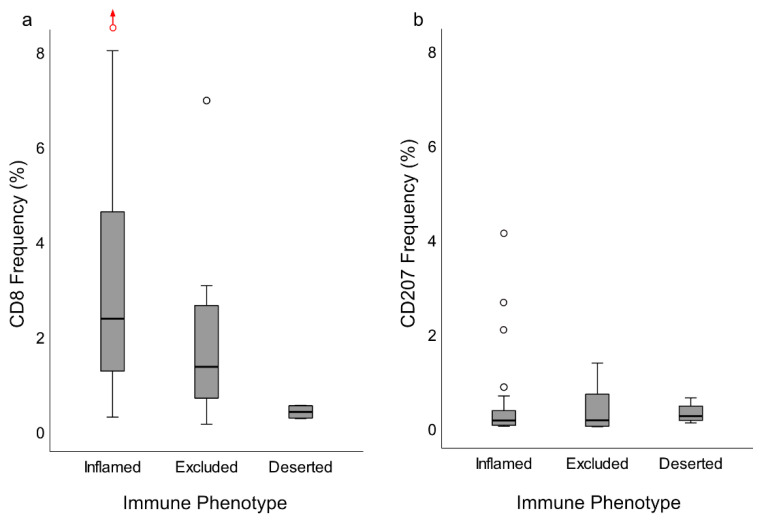
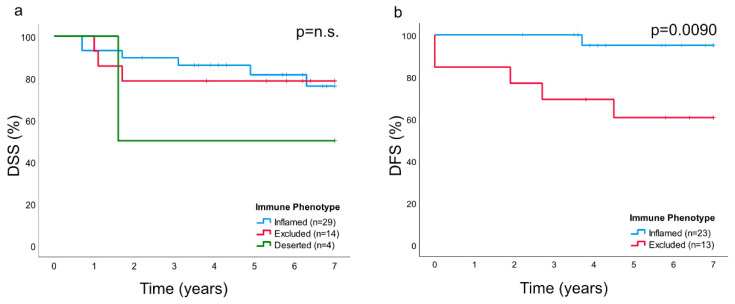
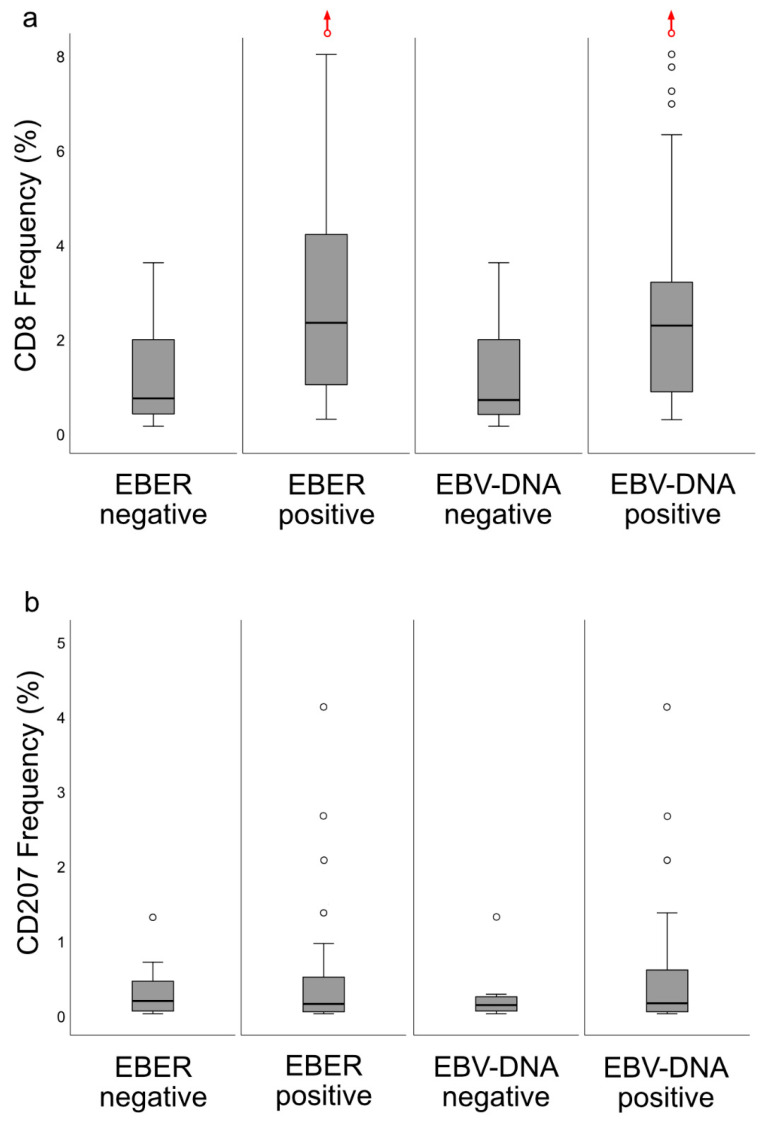
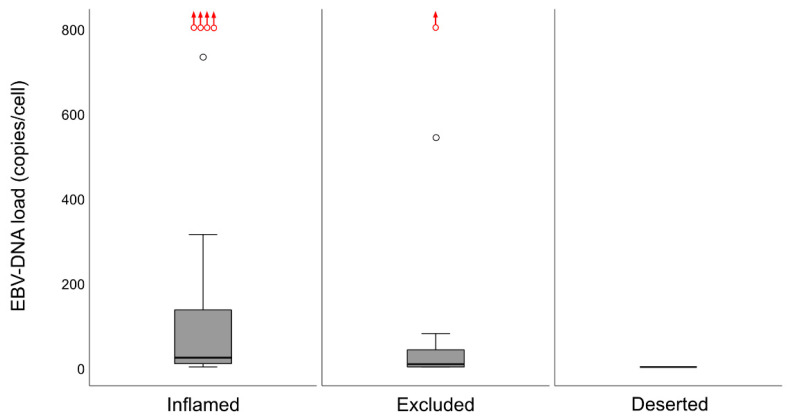
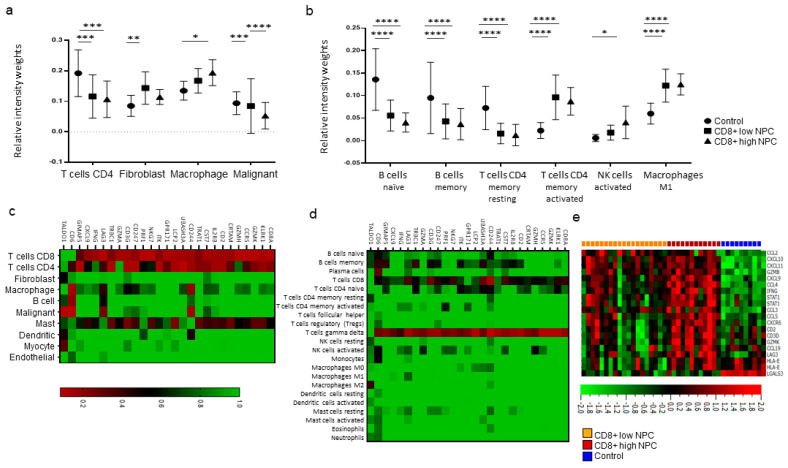
Nasopharyngeal cancer (NPC) features intralesional immune cells, but data are lacking on presence/distribution of T-cells and dendritic cells (DCs). Based on intralesional distribution of lymphocytes, a series of NPC biopsies (n = 48) were classified into "inflamed", "excluded", and "deserted" phenotypes. In addition, CD8+ T-cells and CD207+ DCs were quantified. The data were analyzed in relation to Epstein-Barr virus-encoded small RNA (EBER), Epstein-Barr virus (EBV) DNA, and survival. Separately, data on gene expression from a public database were analyzed. 61.7% of NPC lesions were "inflamed", 29.8% were "excluded", and 8.5% were "deserted". While CD8+ cells were present in cancer cell areas and in surrounding stroma, CD207+ cells were observed largely in cancer cell areas. High CD8+ T-cell presence was associated with EBV+ disease, but no such pattern was observed for CD207+ DCs. There was a difference in disease-free survival in favor of "inflamed" over "excluded" NPC. Gene expression analysis revealed differences between NPC and control tissue (e.g., with regard to interferon activity) as well as between subgroups of NPC based on CD8 expression (high vs. low). In conclusion, NPC lesions are heterogeneous with regard to distribution of CD8+ T-cells and CD207+ DCs. NPC can be classified into immune phenotypes that carry prognostic information. CD207+ DCs may represent a target for immunotherapy with potential to facilitate the antigen cross-presentation necessary to execute cytotoxic T-lymphocyte responses.

Keywords: CD207; CD8; cancer immune phenotype; quantification; survival.


Conflict of interest statement

The authors declare no conflict of interest. The funders have had no role in the design of the study; in the collection, analyses, or interpretation of data; in the writing of the manuscript; or in the decision to publish the results.

Figures

Figure 1
Figure 1
Overall histological view for three selected patients: Patient 1 with EBER-positive NPC (ac), Patient 2 with EBER-negative NPC (df), and Patient 3 with EBER-positive NPC (gj). A marked heterogeneity was seen between patients (all panels) and within a single sample (gj), reflected as varying expression of both CK and EBER. The stainings used were Mayer’s hematoxylin in combination with CK (green) and CD207 (brown) (a,c,d,f,g,i) and Red Counterstain II with EBER (black) (b,e,h,j). Colored horizontal bars indicate size: red = 3 mm, green = 100 µm, orange = 2 mm, and blue = 900 µm. Arrowheads (g,i) denote cancer cells expressing CK and EBER (gray), cancer cells with loss of CK (black), and normal CK-staining of epithelium as comparison (white). Abbreviations: EBER = Epstein–Barr virus encoded small RNAs, NPC = nasopharyngeal cancer, and CK = cytokeratin.
Figure 2
Figure 2
Immune phenotypes for three patients with NPC: Mayer’s hematoxylin in combination with CK (green) and CD8 (brown). All CK expressions denote cancer cells. The top panel (a) shows an “inflamed” tumor rich in infiltrating lymphocytes. The middle panel (b) indicates an “excluded” tumor with lymphocytes surrounding areas of cancer cells. The bottom panel (c) demonstrates a “deserted” tumor with no or very few lymphocytes in areas of cancer cells and the surrounding stroma. Green horizontal bars indicate 100 µm. Abbreviations: NPC = nasopharyngeal cancer and CK = cytokeratin.
Figure 3
Figure 3
Different patterns of CD8+ and CD207+ cell distribution in four selected patients: consecutive tissue sections with Mayer’s hematoxylin in combination with CK (green) and either CD8 or CD207 (brown). Left panels indicate the distribution of CD8+ cells, and right panels indicate CD207+ cells on the following section. The patterns shown are (a,b) low in CD8 and high in CD207, (c,d) high in CD8 and low in CD207, (e,f) high in both CD8 and CD207, and (g,h) low in both CD8 and CD207. CD8 expression was in general higher than CD207 expression. Green horizontal size-bars indicate 100 µm. Abbreviations: NPC = nasopharyngeal cancer and CK = cytokeratin.
Figure 4
Figure 4
CD8 and CD207 frequency (%) presented as boxplots (median and IQR with whiskers denoting 1.5 IQR and outliers as circles) for the whole biopsies (a) as well as for selected areas: (b) CD8 and (c) CD207. There was a difference between CD207 ratios between areas of cancer cells and the surrounding stroma (p < 0.0001). In (a), an extreme outlier (frequency: 24%), deemed an accurate observation, is indicated with a red circle and an upwards pointing red arrow. Abbreviation: IQR = interquartile range.
Figure 5
Figure 5
CD8 and CD207 frequency (%) of whole biopsies in relation to immune phenotypes presented as boxplots (median and IQR, with whiskers denoting 1.5 IQR and outliers as circles). (a) CD8 ratios differed between immune phenotypes: “inflamed” and “excluded” (p = 0.034, higher frequency for “inflamed”), “inflamed” and “deserted” (p = 0.0020, higher frequency for “inflamed”), and “excluded” and “deserted” (p = 0.022, higher frequency for “excluded”). (b) There was no difference in CD207 ratios between immune phenotypes. In (a), an extreme outlier (frequency: 24%), deemed an accurate observation, is indicated with a red circle and an upwards pointing red arrow. Abbreviation: IQR = Interquartile range.
Figure 6
Figure 6
Kaplan–Meier estimates of (a) DSS and (b) DFS for NPC based on immune phenotypes indicated a better prognosis in terms of DFS for the “inflamed” subtype compared to the “excluded” (p = 0.0090). Since three out of four patients with immune “deserted” phenotype presented with spread disease, this subset was not included in the DFS analysis. No differences were observed in the DSS analysis. Abbreviation: DSS = disease-specific survival and DFS = disease-free survival.
Figure 7
Figure 7
Frequency (%) for CD8 and CD207 (whole biopsies) grouped according to presence or not of intralesional EBER and EBV DNA, respectively, and presented as boxplots (median and IQR with whiskers denoting 1.5 IQR and outliers as circles): (a) CD8 ratios were higher for EBER-positive lesions (p = 0.0065) and for EBV DNA-positive lesions (p = 0.028); (b) in contrast, there were no such differences for CD207 ratios. An extreme outlier (frequency: 24%), deemed an accurate finding, is indicated with a red circle and an upwards-pointing red arrows. Abbreviations: EBER = Epstein–Barr virus-encoded small RNA, EBV = Epstein–Barr virus, and IQR = interquartile range.
Figure 8
Figure 8
Differences in intralesional EBV DNA load (copies/cell) for immune phenotypes are shown (medians and IQR with whiskers denoting 1.5 IQR and outliers as circles). A marked difference in DNA load was present between the “inflamed” and “deserted” phenotypes (p = 0.00034). The differences between “inflamed” and “excluded” and between “excluded” and “deserted” were not significant, though a trend was seen (p = 0.055 and p = 0.079, respectively). Higher load outliers (range 1237–94617 copies/cell) are indicated with red circles and upwards-pointing red arrows. Abbreviation: EBV = Epstein–Barr virus.
Figure 9
Figure 9
Immune cell profiling via gene expression for NPC (n = 31) and control tissue (n = 10) in the GEO dataset: (a,b) relative immune cell population distribution by CIBERSORTX in CD8+ high and low NPC compared to control tissue, using signatures from Puram et al. and Newman et al., respectively; (c,d) heat maps showing association of CD8A-correlated genes for 10 cell populations (Puram et al.) and 22 immune cell populations (Newman et al.); and (e) interferon gene signature in NPC cf. control, marked as orange, red, and blue for CD8+ low NPC, CD8+ high NPC, and control, respectively. The p-values in (a,b) are depicted as * < 0.01, ** < 0.005, *** < 0.001, and **** < 0.0001. Abbreviations: NPC = nasopharyngeal cancer and GEO = gene expression omnibus.

References

    1. Wang Y.-Q., Zhang Y., Jiang W., Chen Y.-P., Xu S.-Y., Liu N., Zhao Y., Li L., Lei Y., Hong X.-H., et al. Development and validation of an immune checkpoint-based signature to predict prognosis in nasopharyngeal carcinoma using computational pathology analysis. J. Immunother. Cancer. 2019;7:1–11. doi: 10.1186/s40425-019-0752-4. - DOI - PMC - PubMed
    1. Chen Y.-P., Yin J.-H., Li W.-F., Li H.-J., Chen D.-P., Zhang C.-J., Lv J.-W., Wang Y.-Q., Li X.-M., Li J.-Y., et al. Single-cell transcriptomics reveals regulators underlying immune cell diversity and immune subtypes associated with prognosis in nasopharyngeal carcinoma. Cell Res. 2020:1–19. doi: 10.1038/s41422-020-0374-x. - DOI - PMC - PubMed
    1. Wang Y.-Q., Chen Y.-P., Zhang Y., Jiang W., Liu N., Yun J.-P., Sun Y., He Q.-M., Tang X.-R., Wen X., et al. Prognostic significance of tumor-infiltrating lymphocytes in nondisseminated nasopharyngeal carcinoma: A large-scale cohort study. Int. J. Cancer. 2018;142:2558–2566. doi: 10.1002/ijc.31279. - DOI - PubMed
    1. Fehres C.M., Duinkerken S., Bruijns S.C., Kalay H., Van Vliet S.J., Ambrosini M., De Gruijl T.D., Unger W.W., Garcia-Vallejo J.J., Van Kooyk Y. Langerin-mediated internalization of a modified peptide routes antigens to early endosomes and enhances cross-presentation by human Langerhans cells. Cell. Mol. Immunol. 2015;14:360–370. doi: 10.1038/cmi.2015.87. - DOI - PMC - PubMed
    1. Berg L.M.V.D., Cardinaud S., Van Der Aar A.M.G., Sprokholt J.K., De Jong M.A.W.P., Zijlstra-Willems E.M., Moris A., Geijtenbeek T.B.H. Langerhans Cell–Dendritic Cell Cross-Talk via Langerin and Hyaluronic Acid Mediates Antigen Transfer and Cross-Presentation of HIV-1. J. Immunol. 2015;195:1763–1773. doi: 10.4049/jimmunol.1402356. - DOI - PubMed