

CPT1A Over-Expression Increases Reactive Oxygen Species in the Mitochondria and Promotes Antioxidant Defenses in Prostate Cancer
- PMID: 33218188
- PMCID: PMC7709014
- DOI: 10.3390/cancers12113431
CPT1A Over-Expression Increases Reactive Oxygen Species in the Mitochondria and Promotes Antioxidant Defenses in Prostate Cancer
Abstract
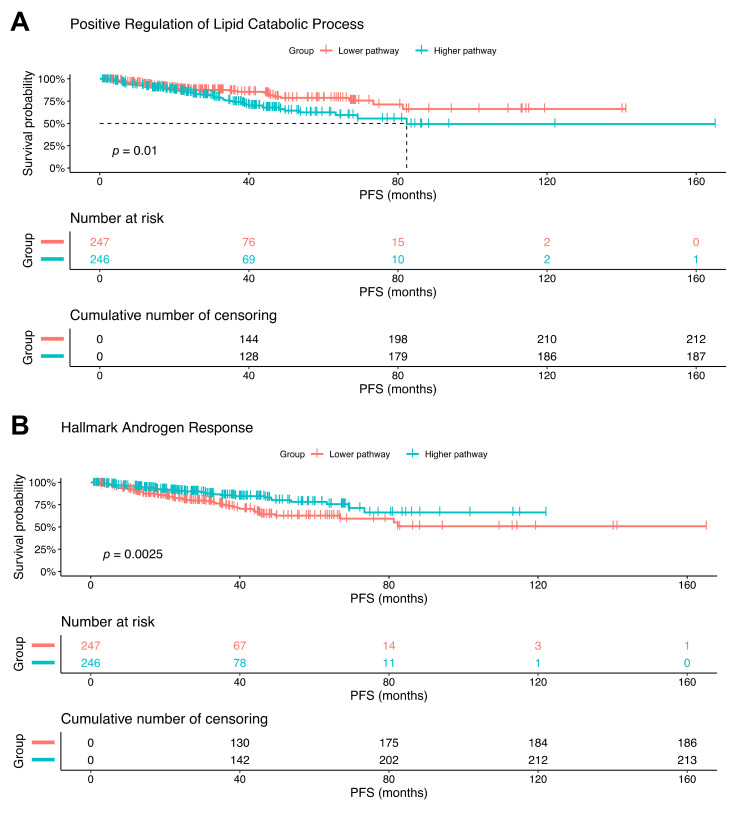
Cancers reprogram their metabolism to adapt to environmental changes. In this study, we examined the consequences of altered expression of the mitochondrial enzyme carnitine palmitoyl transferase I (CPT1A) in prostate cancer (PCa) cell models. Using transcriptomic and metabolomic analyses, we compared LNCaP-C4-2 cell lines with depleted (knockdown (KD)) or increased (overexpression (OE)) CPT1A expression. Mitochondrial reactive oxygen species (ROS) were also measured. Transcriptomic analysis identified ER stress, serine biosynthesis and lipid catabolism as significantly upregulated pathways in the OE versus KD cells. On the other hand, androgen response was significantly downregulated in OE cells. These changes associated with increased acyl-carnitines, serine synthesis and glutathione precursors in OE cells. Unexpectedly, OE cells showed increased mitochondrial ROS but when challenged with fatty acids and no androgens, the Superoxide dismutase 2 (SOD2) enzyme increased in the OE cells, suggesting better antioxidant defenses with excess CPT1A expression. Public databases also showed decreased androgen response correlation with increased serine-related metabolism in advanced PCa. Lastly, worse progression free survival was observed with increased lipid catabolism and decreased androgen response. Excess CPT1A is associated with a ROS-mediated stress phenotype that can support PCa disease progression. This study provides a rationale for targeting lipid catabolic pathways for therapy in hormonal cancers.
Keywords: CPT1A; ROS; androgen response; fatty acids; oxidative stress; prostate cancer; serine.
Conflict of interest statement
The authors declare no conflict of interest. The funders had no role in the design of the study; in the collection, analyses, or interpretation of data; in the writing of the manuscript, or in the decision to publish the results.
Figures


Similar articles
-
CPT1A Supports Castration-Resistant Prostate Cancer in Androgen-Deprived Conditions.Cells. 2019 Sep 20;8(10):1115. doi: 10.3390/cells8101115. Cells. 2019. PMID: 31547059 Free PMC article.
-
Inhibition of macrophage fatty acid β-oxidation exacerbates palmitate-induced inflammatory and endoplasmic reticulum stress responses.Diabetologia. 2014 May;57(5):1067-77. doi: 10.1007/s00125-014-3173-4. Epub 2014 Feb 1. Diabetologia. 2014. PMID: 24488024
-
Prooxidant-antioxidant shift induced by androgen treatment of human prostate carcinoma cells.J Natl Cancer Inst. 1997 Jan 1;89(1):40-8. doi: 10.1093/jnci/89.1.40. J Natl Cancer Inst. 1997. PMID: 8978405
-
CPT1A-mediated Fat Oxidation, Mechanisms, and Therapeutic Potential.Endocrinology. 2020 Feb 1;161(2):bqz046. doi: 10.1210/endocr/bqz046. Endocrinology. 2020. PMID: 31900483 Review.
-
Mitochondrial CPT1A: Insights into structure, function, and basis for drug development.Front Pharmacol. 2023 Mar 23;14:1160440. doi: 10.3389/fphar.2023.1160440. eCollection 2023. Front Pharmacol. 2023. PMID: 37033619 Free PMC article. Review.
Cited by
-
CAVPENET Peptide Inhibits Prostate Cancer Cells Proliferation and Migration through PP1γ-Dependent Inhibition of AKT Signaling.Pharmaceutics. 2024 Sep 12;16(9):1199. doi: 10.3390/pharmaceutics16091199. Pharmaceutics. 2024. PMID: 39339236 Free PMC article.
-
Emerging roles for fatty acid oxidation in cancer.Genes Dis. 2024 Dec 20;12(4):101491. doi: 10.1016/j.gendis.2024.101491. eCollection 2025 Jul. Genes Dis. 2024. PMID: 40290117 Free PMC article. Review.
-
Prostate Cancer Progression: as a Matter of Fats.Front Oncol. 2021 Jul 27;11:719865. doi: 10.3389/fonc.2021.719865. eCollection 2021. Front Oncol. 2021. PMID: 34386430 Free PMC article. Review.
-
Carnitine Shuttle and Ferroptosis in Cancer.Antioxidants (Basel). 2025 Aug 8;14(8):972. doi: 10.3390/antiox14080972. Antioxidants (Basel). 2025. PMID: 40867868 Free PMC article. Review.
-
CPT1A mediates the succinylation of SP5 which activates transcription of PDPK1 to promote the viability and glycolysis of prostate cancer cells.Cancer Biol Ther. 2024 Dec 31;25(1):2329372. doi: 10.1080/15384047.2024.2329372. Epub 2024 Mar 17. Cancer Biol Ther. 2024. PMID: 38494680 Free PMC article.
References
-
- Sharp A., Coleman I., Yuan W., Sprenger C., Dolling D., Rodrigues D.N., Russo J.W., Figueiredo I., Bertan C., Seed G., et al. Androgen receptor splice variant-7 expression emerges with castration resistance in prostate cancer. J. Clin. Investig. 2019;129:192–208. doi: 10.1172/JCI122819. - DOI - PMC - PubMed
-
- Carver B.S., Chapinski C., Wongvipat J., Hieronymus H., Chen Y., Chandarlapaty S., Arora V.K., Le C., Koutcher J., Scher H., et al. Reciprocal feedback regulation of PI3K and androgen receptor signaling in PTEN-deficient prostate cancer. Cancer Cell. 2011;19:575–586. doi: 10.1016/j.ccr.2011.04.008. - DOI - PMC - PubMed
Grants and funding
LinkOut - more resources
Full Text Sources
Molecular Biology Databases
Miscellaneous
