. 2021 Feb 1;81(3):634-647.
doi: 10.1158/0008-5472.CAN-20-1088. Epub 2020 Nov 20.

Myeloma-Modified Adipocytes Exhibit Metabolic Dysfunction and a Senescence-Associated Secretory Phenotype

Affiliations

Myeloma-Modified Adipocytes Exhibit Metabolic Dysfunction and a Senescence-Associated Secretory Phenotype

Heather Fairfield et al. Cancer Res. .

Abstract

Bone marrow adipocytes (BMAd) have recently been implicated in accelerating bone metastatic cancers, such as acute myelogenous leukemia and breast cancer. Importantly, bone marrow adipose tissue (BMAT) expands with aging and obesity, two key risk factors in multiple myeloma disease prevalence, suggesting that BMAds may influence and be influenced by myeloma cells in the marrow. Here, we provide evidence that reciprocal interactions and cross-regulation of myeloma cells and BMAds play a role in multiple myeloma pathogenesis and treatment response. Bone marrow biopsies from patients with multiple myeloma revealed significant loss of BMAT with myeloma cell infiltration of the marrow, whereas BMAT was restored after treatment for multiple myeloma. Myeloma cells reduced BMAT in different preclinical murine models of multiple myeloma and in vitro using myeloma cell-adipocyte cocultures. In addition, multiple myeloma cells altered adipocyte gene expression and cytokine secretory profiles, which were also associated with bioenergetic changes and induction of a senescent-like phenotype. In vivo, senescence markers were also increased in the bone marrow of tumor-burdened mice. BMAds, in turn, provided resistance to dexamethasone-induced cell-cycle arrest and apoptosis, illuminating a new possible driver of myeloma cell evolution in a drug-resistant clone. Our findings reveal that bidirectional interactions between BMAds and myeloma cells have significant implications for the pathogenesis and treatment of multiple myeloma. Targeting senescence in the BMAd or other bone marrow cells may represent a novel therapeutic approach for treatment of multiple myeloma. SIGNIFICANCE: This study changes the foundational understanding of how cancer cells hijack the bone marrow microenvironment and demonstrates that tumor cells induce senescence and metabolic changes in adipocytes, potentially driving new therapeutic directions.


Conflict of interest statement

COI: The authors declare no potential conflicts of interest

Figures

Figure 1.
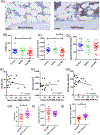
Figure 1.. Myeloma cells decrease BMAT in MM patients.
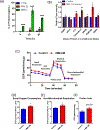
(A) Representative images of CD138 staining of MGUS (left) and MM biopsies (right) using CD138+ IHC and counterstains show that MM cells and BMAds co-localize. Adipocytes indicated as large ghosts (white spaces), myeloma cells indicated by brown stain (40X objective, Scale bar = 50 μm). The BMAT depot was characterized in iliac crest bone specimens from controls (n=18), patients with MGUS (n=16) and MM patients before treatment (New MM, n=19): (B) adipose tissue volume fraction (AV/MV), (C) mean adipocyte size (−29%, P<0.01), and (D) adipocyte density were quantified. Tumor load (MM tumor area per marrow area, MM.Ar/M.Ar) was not significantly correlated with AV/MV (E), adipocyte size (F), or adipose density (G). Treatment with high-dose melphalan and dexamethasone followed by autologous bone marrow transplantation (n=17) lead to increased AV/MV (H) owing to no significant effect on adipocyte size (I) but a significantly increased adipocyte density (J). *p≤0.05, ** p≤0.005, ***p≤0.001 via two-tailed t-test or one-way ANOVA where applicable.
Figure 2.
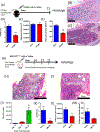
Figure 2.. Myeloma cells reduce bone marrow adiposity in vivo.
Six to eight-week-old female C57BL/KaLwrRJHsd mice were injected via the tail vein with 0.5 × 10^6 syngeneic 5TGM1-eGFP cells. (A-F) Mice were sacrificed at 21 days following cell inoculation (A) and femora were harvested and fixed in 4% paraformaldehyde for hematoxylin and eosin (H&E) staining from (B) control and (C) tumor-bearing mice. (D) Bone marrow adipocyte volume, (E) adipocyte size, and (F) adipocyte density were quantified utilizing ImageJ; n=5 per group. For the MM.1S model (G-M), 12-week-old female SCID-Beige-MM.1S mice were injected via the tail vein with 5 × 10^6 MM.1S-luc+/gfp+ cells. Femora were harvested and fixed in 10% neutral buffered formalin prior to (H&E) staining in control (H) and tumor-bearing mice (I) at the endpoint of the survival study. Tumor burden was measured using bioluminescent imaging (BLI) weekly (J) beginning at 2 weeks following cell inoculation until the first mouse reached the predetermined sacrifice point for survival studies. Bone marrow adipocyte volume (K), adipocyte size (L), and adipocyte density (M) were quantified utilizing ImageJ; all femoral sections were imaged with 4X objectives prior to quantification.
Figure 3.
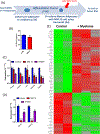
Figure 3.. Myeloma-associated adipocytes are phenotypically compromised as reflected by decreased lipid droplet accumulation and aberrant transcriptomes.
(A) Experimental design for experiments with mouse adipocytes. (B) 3T3-L1-derived mouse adipocytes exhibit reduced lipid content (Oil Red-O) after indirect co-culture with MM.1S cells (MM ID) for 72-hours. (C) 3T3-L1 adipocyte gene expression data alone (n=7), or in transwell co-culture with MM.1S (n=9) or 5TGM1 (n=3) MM cells. (D) Mouse bone marrow-derived adipocytes alone (n=23) or in transwell co-culture with MM.1S (n=10) or 5TGM1 (n=10) exhibit lower expression of key adipogenic transcripts. (E) Significant differences in gene expression in mature adipocytes either alone (n=2) or in transwell co-culture with MM.1S (n=3) for 72-hours as measured via Clariom S mouse microarray. (Red is downregulated (−1.6 fold change), green is upregulated (1.6 fold change)).
Figure 4.
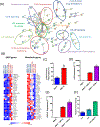
Figure 4.. Human BM-MSC-derived adipocytes exhibit aberrant transcripts and display senescence when exposed to myeloma cells.
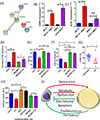
(A) Genes with expression differences in human BMAT samples exposed to myeloma compared to their controls were selected based on average gene expression fold change (≥2) and significance (p<0.05) for DBstring analyses of upregulated genes and networks. (B) Senescence associated secretory phenotype (SASP) genes were examined on an individual basis with expression levels from each sample utilized to build a SASP gene cluster heatmap utilizing the publicly available tool from Morpheus (https://software.broadinstitute.org/morpheus), demonstrating large consistent increases in SASP transcripts in response to MM cells, specifically the MM.1S and OPM-2 cell lines. Similarly, an adipogenesis cluster was generated utilizing genes incorporated in the KEGG adipogenesis pathway (https://www.genome.jp/kegg-bin/show_pathway?hsa03320) and gene expression levels from each sample reflect decreased adipogenesis in BMAT cultured with MM cells. (C) Quantification of beta-galactosidase (β-gal) positive adipocytes in human BMAds exposed to MM.1S cells for 72 hours. (D) Increased IL6 and (E) CXCL2 gene expression was confirmed in three BMAT donors exposed to MM.1S and OPM-2 via qPCR. (F) Elevated cytokines were detected in MM-BMAT co-cultures after 72 hours as detected using cytokine array.
Figure 5.
Figure 5.. MM-adipocytes exhibit increased IL-6 production and altered cellular metabolism.
(A) Mature 3T3-L1 adipocytes exposed to MM.1S cells via transwell exhibit increased IL-6 secretion after only 4 hours in direct co-culture (MM D), and significant increases in both direct and indirect (MM ID) co-culture systems as detected and quantified by a mouse-specific IL-6 ELISA. (B) Multiple cytokines including IL-6 were significantly increased in the indirect co-culture system, as assessed by mouse adipokine array. (C) Cellular respiration in 3T3-L1 cells following 72-hour exposure to myeloma conditioned media via SeaHorse assay; data collected for approximately 75 minutes at the end of MM-CM exposure. (D) Basal respiration (p<0.05), (E) non-mitochondrial respiration (p<0.05), and (F) proton leak (n.s.) are all increased in 3T3-L1 cells exposed to MM.1S-derived soluble factors; data represent three independent experiments and Seahorse experiments used 3T3-L1 cells alone (n=29 wells) or with MM.1S-CM (n=25 wells).
Figure 6.
Figure 6.. MM-BMAds induce dexamethasone resistance in MM cells in vitro and increased adiposity predicts worse outcomes in patients clinically.
(A) STRING analysis of the six commonly upregulated genes in MM cells cultured with BMAT. (B-C) qPCR confirmation of upregulated expression of FKBP5 and KLF9 in MM.1S and OPM-2 cells co-cultured with BMAT (n=3 donors). (D) MM.1S cells are resistant to dexamethasone-induced apoptosis (Annexin V, DAPI and (E) proliferation inhibition when co-cultured with BMAT as seen in Ki67 staining, and (F) cell cycle analysis (n=3–6). (G) In primary MM patient bone marrow biopsies, BMAT volume fraction (AV/MV) was analyzed in patients before treatment with high-dose melphalan and dexamethasone followed by autologous bone marrow transplantation (n=17): MM patients who showed a complete response to treatment (n=6) had significantly lower AV/MV before treatment (−54%, P<0.05) compared to patients with partial/very good partial response to treatment (n=11). (H) MM.1S cells were treated with dex for 72 hours in the presence or absence of BMAT CM from naïve or MM-BMAT; bioluminescence was utilized to detect cell number and dex responsiveness (n=7 BMAT donors). (I) Overall schematic of the dynamic relationship between bone marrow adipocytes and myeloma cells.

Similar articles

Cited by

References

    1. Reagan MR, Liaw L, Rosen CJ, Ghobrial IM. Dynamic Interplay between Bone and Multiple Myeloma: Emerging Roles of the Osteoblast. Bone. 2015;75:161–9. - PMC - PubMed
    1. McDonald MM, Reagan MR, Youlten SE, Mohanty ST, Seckinger A, Terry RL, et al. Inhibiting the osteocyte-specific protein sclerostin increases bone mass and fracture resistance in multiple myeloma. Blood. 2017;129:3452–64. - PMC - PubMed
    1. Reagan MR, Mishima Y, Glavey SV, Zhang YY, Manier S, Lu ZN, et al. Investigating osteogenic differentiation in multiple myeloma using a novel 3D bone marrow niche model. Blood. 2014;124:3250–9. - PMC - PubMed
    1. Trotter TN, Gibson JT, Sherpa TL, Gowda PS, Peker D, Yang Y. Adipocyte-Lineage Cells Support Growth and Dissemination of Multiple Myeloma in Bone. Am J Pathol. 2016;186:3054–63. - PMC - PubMed
    1. Liu Z, Xu J, He J, Liu H, Lin P, Wan X, et al. Mature adipocytes in bone marrow protect myeloma cells against chemotherapy through autophagy activation. Oncotarget. 2015;6:34329–41. - PMC - PubMed

Publication types

MeSH terms