Clinical Trial
. 2021 Mar 1;27(5):1371-1380.
doi: 10.1158/1078-0432.CCR-20-3084. Epub 2020 Nov 20.

Expression of T-Cell Exhaustion Molecules and Human Endogenous Retroviruses as Predictive Biomarkers for Response to Nivolumab in Metastatic Clear Cell Renal Cell Carcinoma

Affiliations
Clinical Trial

Expression of T-Cell Exhaustion Molecules and Human Endogenous Retroviruses as Predictive Biomarkers for Response to Nivolumab in Metastatic Clear Cell Renal Cell Carcinoma

Miriam Ficial et al. Clin Cancer Res. .

Abstract

Purpose: We sought to validate levels of CD8+ tumor-infiltrating cells (TIC) expressing PD-1 but not TIM-3 and LAG-3 (IF biomarker; Pignon and colleagues, 2019) and to investigate human endogenous retroviruses (hERV) as predictors of response to anti-PD-1 in a randomized trial of nivolumab (nivo) versus everolimus (evero) in patients with metastatic clear cell renal cell carcinoma (mccRCC; CheckMate-025).

Experimental design: Tumor tissues (nivo: n = 116, evero: n = 107) were analyzed by multiparametric immunofluorescence (IF) and qRT-PCR. Genomic/transcriptomic analyses were performed in a subset of samples. Clinical endpoints included objective response rate (ORR), progression-free survival (PFS), overall survival (OS), and durable response rate (DRR, defined as complete response or partial response with a PFS ≥ 12 months).

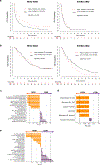
Results: In the nivo (but not evero) arm, patients with high-IF biomarker density (24/116, 20.7%) had higher ORR (45.8% vs. 19.6%, P = 0.01) and DRR (33.3% vs. 14.1%, P = 0.03) and longer median PFS (9.6 vs. 3.7 months, P = 0.03) than patients with low-IF biomarker. By RNA sequencing, several inflammatory pathways (q < 0.1) and immune-related gene signature scores (q < 0.05) were enriched in the high-IF biomarker group. When combined with the IF biomarker, tumor cell (TC) PD-L1 expression (≥1%) further separated clinical outcomes in the nivo arm. ERVE-4 expression was associated with increased DRR and longer PFS in nivo-treated patients.

Conclusions: High levels of CD8+ TIC expressing PD-1 but not TIM-3 and LAG-3 and ERVE-4 expression predicted response to nivo (but not to evero) in patients with mccRCC. Combination of the IF biomarker with TC PD-L1 improved its predictive value, confirming our previous findings.


Figures

Figure 1.
Figure 1.
Association of CD8+PD-1+TIM-3LAG-3 TIC density with clinical outcomes (PFS, OS) and with RNA-seq data. a, b Kaplan-Meier curves for PFS and OS per CD8+ PD-1+TIM-3LAG-3 TIC density at the optimized cutoff (Youden’s Index approach) in the nivo and evero arm. c, ssGSEA Hallmark gene sets enriched in the CD8+ PD-1+TIM-3LAG-3 TIC-High (orange) and CD8+PD-1+TIM-3LAG-3 TIC-Low (purple) tumors. Dotted lines indicate FDR q-value of 0.25 (light) and 0.1 (dark, significance level). d, Immune-related gene signature scores upregulated in CD8+PD-1+TIM-3LAG-3 TIC-High (orange) and CD8+PD-1+TIM-3LAG-3 TIC-Low (purple) tumors. Dotted lines indicate FDR q-value of 0.25 (light) and 0.05 (dark, significance level). e, Immune cell populations enriched in the CD8+PD-1+TIM-3LAG-3 TIC-High (orange) and CD8+PD-1+TIM-3LAG-3 TIC-Low (purple) cases by CIBERSORTx immune deconvolution of RNA-seq data. Dotted lines indicate FDR q-value of 0.25 (light) and 0.05 (dark, significance level).
Figure 2.
Figure 2.
Kaplan-Meier curves for PFS per Tumor Cell (TC) PD-L1 expression levels (≥1%) combined with levels of CD8+PD-1+TIM-3LAG-3 TIC density (High versus Low). a In the evero arm, one patient with PD-L1 High/CD8+ PD1+TIM3LAG3 TIC Low was combined with the PD-L1 Low/CD8+ PD1+TIM3LAG3 TIC High group.
Figure 3.
Figure 3.
Association of ERVE4 status with clinical outcomes (PFS, OS) and integration with WES and RNA-seq data. a, b Kaplan-Meier curves for PFS and OS per ERVE4 status at the optimized cutoff (Youden’s Index approach) in the nivo and evero arm. c, Most differentially expressed hERVs between ERVE4-positive and ERVE4-negative tumors using a database of about 1700 hERV transcripts. Horizontal red dotted line indicates FDR q-value of 0.25 (significance level). d, Immune-related gene signature scores upregulated in ERVE4-positive (orange) and ERVE4-negative (purple) tumors. Dotted lines indicate FDR q-value of 0.25 (light) and 0.05 (dark, significance level).

References

    1. Motzer RJ, Escudier B, McDermott DF, George S, Hammers HJ, Srinivas S, et al.Nivolumab versus Everolimus in Advanced Renal-Cell Carcinoma. N Engl J Med 2015;373(19):1803–13 doi 10.1056/NEJMoa1510665. - DOI - PMC - PubMed
    1. Motzer RJ, Tannir NM, McDermott DF, Aren Frontera O, Melichar B, Choueiri TK, et al.Nivolumab plus Ipilimumab versus Sunitinib in Advanced Renal-Cell Carcinoma. N Engl J Med 2018;378(14):1277–90 doi 10.1056/NEJMoa1712126. - DOI - PMC - PubMed
    1. Havel JJ, Chowell D, Chan TA. The evolving landscape of biomarkers for checkpoint inhibitor immunotherapy. Nat Rev Cancer 2019;19(3):133–50 doi 10.1038/s41568-019-0116-x. - DOI - PMC - PubMed
    1. Blackburn SD, Shin H, Haining WN, Zou T, Workman CJ, Polley A, et al.Coregulation of CD8+ T cell exhaustion by multiple inhibitory receptors during chronic viral infection. Nat Immunol 2009;10(1):29–37 doi 10.1038/ni.1679. - DOI - PMC - PubMed
    1. Sakuishi K, Apetoh L, Sullivan JM, Blazar BR, Kuchroo VK, Anderson AC. Targeting Tim-3 and PD-1 pathways to reverse T cell exhaustion and restore anti-tumor immunity. J Exp Med 2010;207(10):2187–94 doi 10.1084/jem.20100643. - DOI - PMC - PubMed

Publication types

MeSH terms

Supplementary concepts