Observational Study
. 2020 Nov 20;5(53):eabc7191.
doi: 10.1126/sciimmunol.abc7191.

Gut microbiota-specific IgA+ B cells traffic to the CNS in active multiple sclerosis

Affiliations
Observational Study

Gut microbiota-specific IgA+ B cells traffic to the CNS in active multiple sclerosis

Anne-Katrin Pröbstel et al. Sci Immunol. .

Abstract

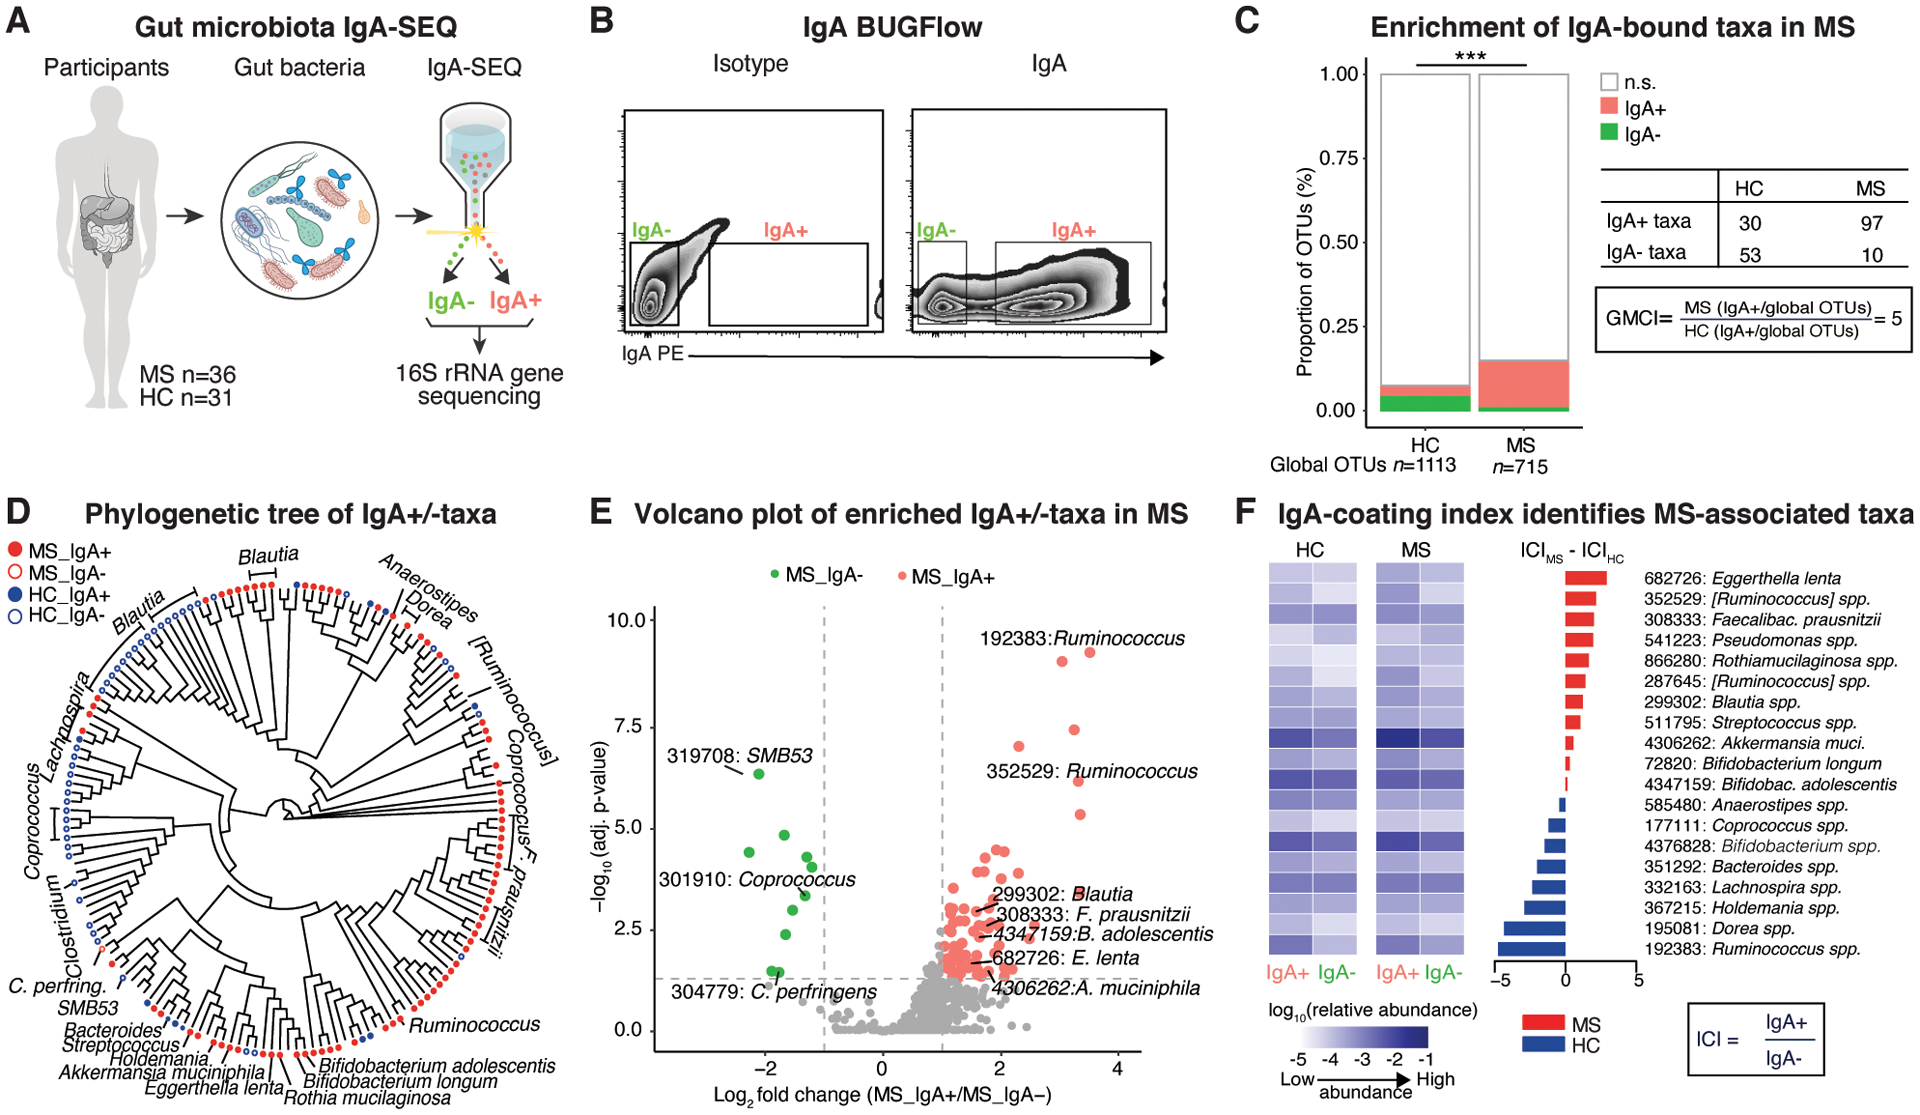
Changes in gut microbiota composition and a diverse role of B cells have recently been implicated in multiple sclerosis (MS), a central nervous system (CNS) autoimmune disease. Immunoglobulin A (IgA) is a key regulator at the mucosal interface. However, whether gut microbiota shape IgA responses and what role IgA+ cells have in neuroinflammation are unknown. Here, we identify IgA-bound taxa in MS and show that IgA-producing cells specific for MS-associated taxa traffic to the inflamed CNS, resulting in a strong, compartmentalized IgA enrichment in active MS and other neuroinflammatory diseases. Unlike previously characterized polyreactive anti-commensal IgA responses, CNS IgA cross-reacts with surface structures on specific bacterial strains but not with brain tissue. These findings establish gut microbiota-specific IgA+ cells as a systemic mediator in MS and suggest a critical role of mucosal B cells during active neuroinflammation with broad implications for IgA as an informative biomarker and IgA-producing cells as an immune subset to harness for therapeutic interventions.


Conflict of interest statement

Competing interests: None.

Figures

Fig. 1.
Fig. 1.. Identification of IgA-coated bacteria enriched in multiple sclerosis patients.
A, Overview of IgA-based cell sorting of fecal bacteria combined with 16S rRNA gene sequencing (IgA-SEQ) in multiple sclerosis (MS) (n=36) and healthy controls (HC) (n=31). B, Gating strategy for flow-cytometry based sorting of IgA-bound (IgA+) and -unbound (IgA-) bacteria. C, Relative counts of significant operational taxonomic units (OTUs) specific to the IgA+ and IgA- fractions, non-differential OTUs and global OTUs. Note significant differential enrichment of IgA-bound OTUs in MS compared to controls as shown by an elevated global microbiota coating index (GMCI). Fisher’s exact test. D, Phylogenetic tree based on IgA-SEQ of significantly different OTUs between IgA+ and IgA- in MS or HC. Circles represent OTUs overabundant in the respective IgA status. E, Volcano plots of significantly differential OTUs between IgA+ and IgA- in MS. Note enrichment of pro-inflammatory taxa in the IgA-bound fraction. F, Heatmap of average relative abundance (log base 10) of total, IgA+ and IgA- fractions of fecal bacteria and IgA coating index (ICI) scores from HC and MS for differential OTUs between IgA+ and IgA- in HC and MS, respectively. DESeq2, Benjamini-Hochberg correction for multiple comparisons.
Fig. 2.
Fig. 2.. Enrichment of IgA-producing cells during active CNS inflammation in MS and viral encephalitis.
A, Serum and CSF IgA and IgG levels during MS relapse (serum: n=13, CSF: n=11) and remission (serum: n=11, CSF: n=9); unpaired Student’s t-test. IgA and IgG index during relapse (n=6) compared to remission (n=11); unpaired Student’s t-test with Welch’s correction. CSF IgA in active and inactive MS in comparison to another neuroinflammatory condition (neurosarcoidosis: n=12), neurodegeneration (motor neuron diseases, MND: n=10) and healthy controls (HC: n=10); One-way ANOVA with Tukey’s multiple comparison test; Indicated are mean ± SEM. B, Spatial distribution and lineage of IgA+ B cells in active MS lesions. CD20 (cyan arrowheads), IgA (yellow arrowheads). C, Spatial transcriptomics of IGHA- to IGHG-expressing cells in subcortical perivascular versus meningeal and parenchymal infiltrates in active MS; two-tailed Mann-Whitney test. D, IGHA- and IGHG-expressing cells in inflamed meningeal aggregates (left), the majority of which co-express the plasma cell marker PRDM1 (yellow arrowheads). Presence of IGHG- and IGHA-expressing cells (co-expressed with PRDM1) in inflamed perivascular infiltrates (right). Note differential IL10 expression in immune cell subsets with increased expression in IGHA-expressing B cells (yellow arrowheads; orange arrowheads marks IL10-/IGHA+ cells), and lower/absent expression in T cells (CD3E) and macrophages (CD163) (blue arrowheads). E, F, Qualitative (E) and quantitative (F) assessment of IGHA- and IGHG-expressing B cells in inflamed viral encephalitis tissue (Borna disease virus 1, BoDV-1); note recruitment of IGHA- and IGHG-expressing B cells in perivascular spaces with relative enrichment of IGHA- over IGHG-expressing cells in parenchymal infiltrates. For IHC (B) and ISH (C-F) experiments, representative images from individual tissue sections are shown (ctrl, n = 5; MS, n = 12; BoDV-1, n= 5), meninges and perivascular white matter lesions are from the same tissue sections. Inflammatory lesion staging was carried out by MOG and CD68 IHC.
Figure 3.
Figure 3.. IgA-producing cells traffic across the blood-brain barrier in active MS.
A-B, B cell receptor repertoire analysis from sorted plasma cell subsets (A) or single cells (B) from peripheral blood (PB, red) and cerebrospinal fluid (CSF, blue) (n=3). PC=plasma cells. Edges (lines): clonal connections between B cell subsets. PB-CSF connections: blue=clonal connections between IgA subsets, red=all other clonal connections. Node size and edge thickness are relative to the number of Ig-VH clusters and connections, respectively. C, Phylogenetic tree of CDR3 sequences from an IgA cluster shared between CSF and blood (patient bBCR2, (A)). Dots indicate amino acids identical to germline segments; color-shaded amino acids indicate differences from germline. D, CSF IgA B cell (clonal) frequencies. Shown are % CSF IgA of all CSF Ig clusters (left), % CSF-PB clonal connections of all CSF IgA (middle), % CSF-PB clonal connections of all CSF-PC Ig clonal connections. E, CSF IgA B cell receptor gene usage.
Figure 4.
Figure 4.. Microbial specificity of cerebrospinal fluid IgA B cells.
A, Strategy to characterize gut bacteria-reactivity of cerebrospinal fluid (CSF) IgA and recombinant monoclonal antibodies (mAbs) derived from single CSF IgA B cells from MS patients. B, CSF IgA-reactivity against autologous gut microbiota (remission, n=7; relapse, n=10). Fisher’s exact test. C, CSF mAb-reactivity against autologous gut microbiota (n=5) during acute inflammation. D, CSF mAb binding profile. Strains used are type-strains derived from ATCC or from an Eggerthellaceae collection. MOG=myelin oligodendrocyte glycoprotein, dsDNA=double stranded deoxyribonucleic acid. Dark blue=gram- strains, light blue=gram+ strains. E, Epitope mapping of mAb-1. Antibody reactivity against E. coli K235-derived lipopolysaccharide (LPS) and epitope identification using a glycan array. Shown are the repeating units of the capsular polysaccharides from Streptococcus pneumonia serotypes 4 and 9 with the common 2-N-acetyl mannosamine highlighted in red. F, Schematic illustrates working model of IL10-producing gut microbiota-specific IgA B cell trafficking during acute neuroinflammation in active MS.

References

    1. Thompson AJ, Baranzini SE, Geurts J, Hemmer B, Ciccarelli O, Multiple sclerosis. Lancet 391, 1622–1636 (2018). - PubMed
    1. Berer K, Mues M, Koutrolos M, Rasbi ZA, Boziki M, Johner C, Wekerle H, Krishnamoorthy G, Commensal microbiota and myelin autoantigen cooperate to trigger autoimmune demyelination. Nature 479, 538–541 (2011). - PubMed
    1. Berer K, Gerdes LA, Cekanaviciute E, Jia X, Xiao L, Xia Z, Liu C, Klotz L, Stauffer U, Baranzini SE, Kümpfel T, Hohlfeld R, Krishnamoorthy G, Wekerle H, Gut microbiota from multiple sclerosis patients enables spontaneous autoimmune encephalomyelitis in mice. Proceedings of the National Academy of Sciences of the United States of America 114, 10719–10724 (2017). - PMC - PubMed
    1. Cekanaviciute E, Yoo BB, Runia TF, Debelius JW, Singh S, Nelson CA, Kanner R, Bencosme Y, Lee YK, Hauser SL, Crabtree-Hartman E, Sand IK, Gacias M, Zhu Y, Casaccia P, Cree BAC, Knight R, Mazmanian SK, Baranzini SE, Gut bacteria from multiple sclerosis patients modulate human T cells and exacerbate symptoms in mouse models. Proceedings of the National Academy of Sciences of the United States of America 114, 10713–10718 (2017). - PMC - PubMed
    1. Cekanaviciute E, Pröbstel A-K, Thomann A, Runia TF, Casaccia P, Katz Sand I, Crabtree E, Singh S, Morrissey J, Barba P, Gomez R, Knight R, Mazmanian S, Graves J, Cree BAC, Zamvil SS, Baranzini SE, Multiple Sclerosis-Associated Changes in the Composition and Immune Functions of Spore-Forming Bacteria. mSystems 3, 353 (2018). - PMC - PubMed

Publication types

MeSH terms