

Comprehensive Analysis of Alternative Splicing Signature in Gastric Cancer Prognosis Based on The Cancer Genome Atlas (TCGA) and SpliceSeq Databases
- PMID: 33219199
- PMCID: PMC7687027
- DOI: 10.12659/MSM.925772
Comprehensive Analysis of Alternative Splicing Signature in Gastric Cancer Prognosis Based on The Cancer Genome Atlas (TCGA) and SpliceSeq Databases
Abstract
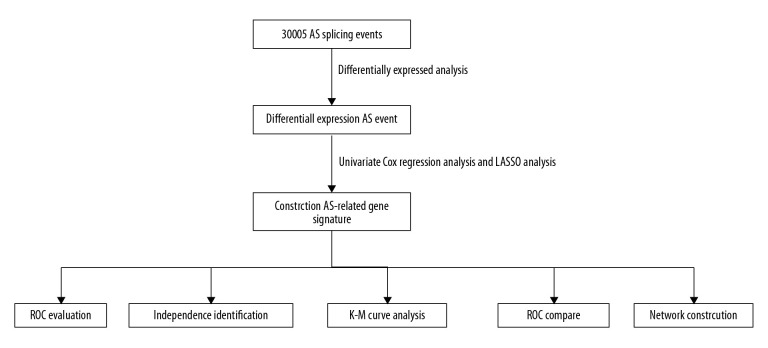
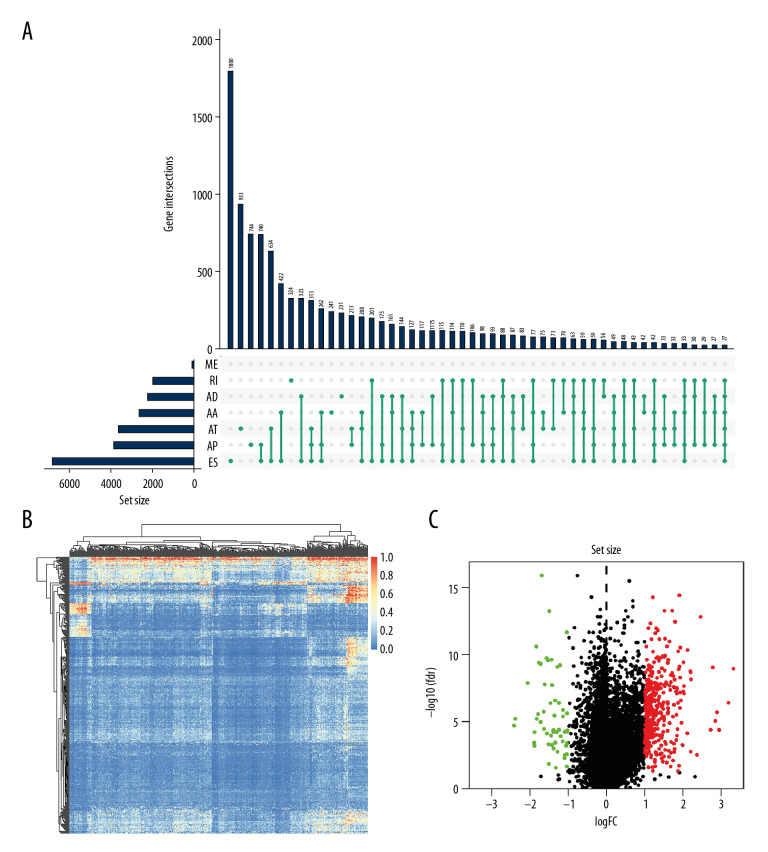
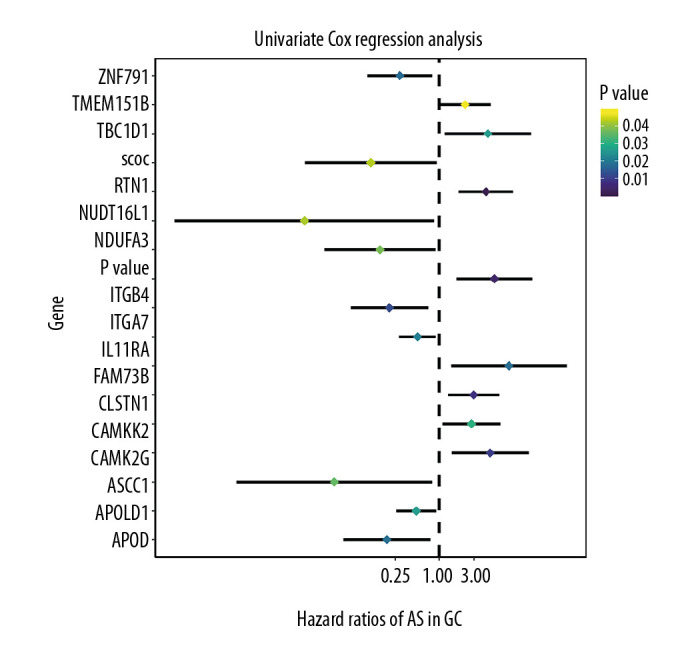
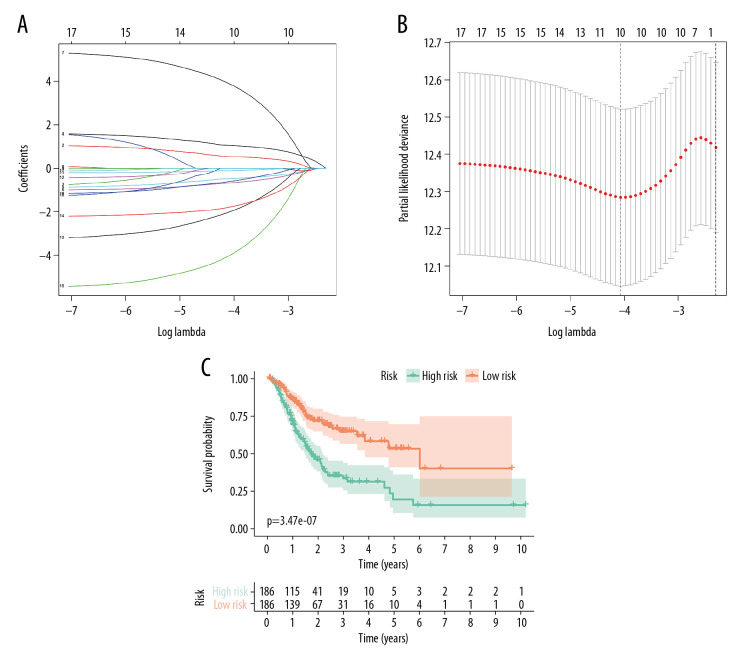
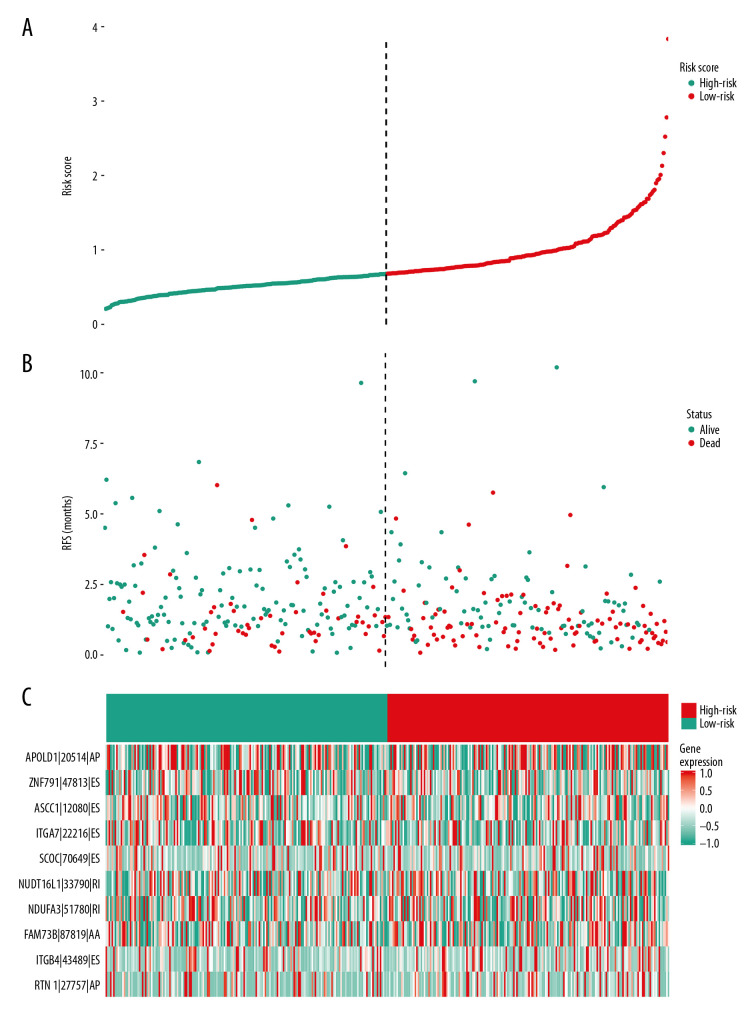
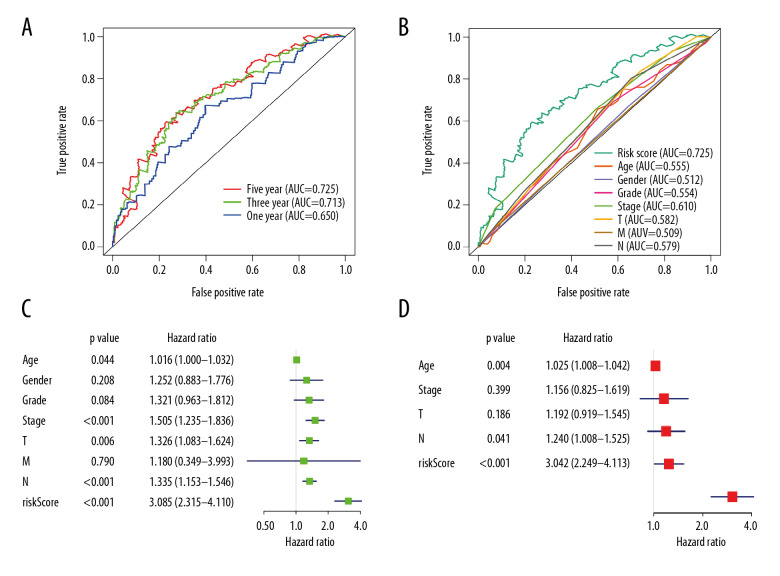
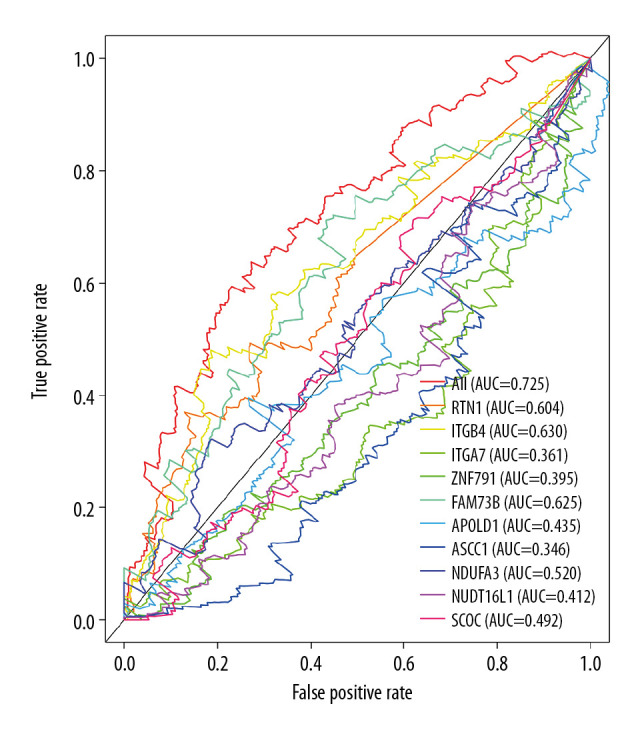
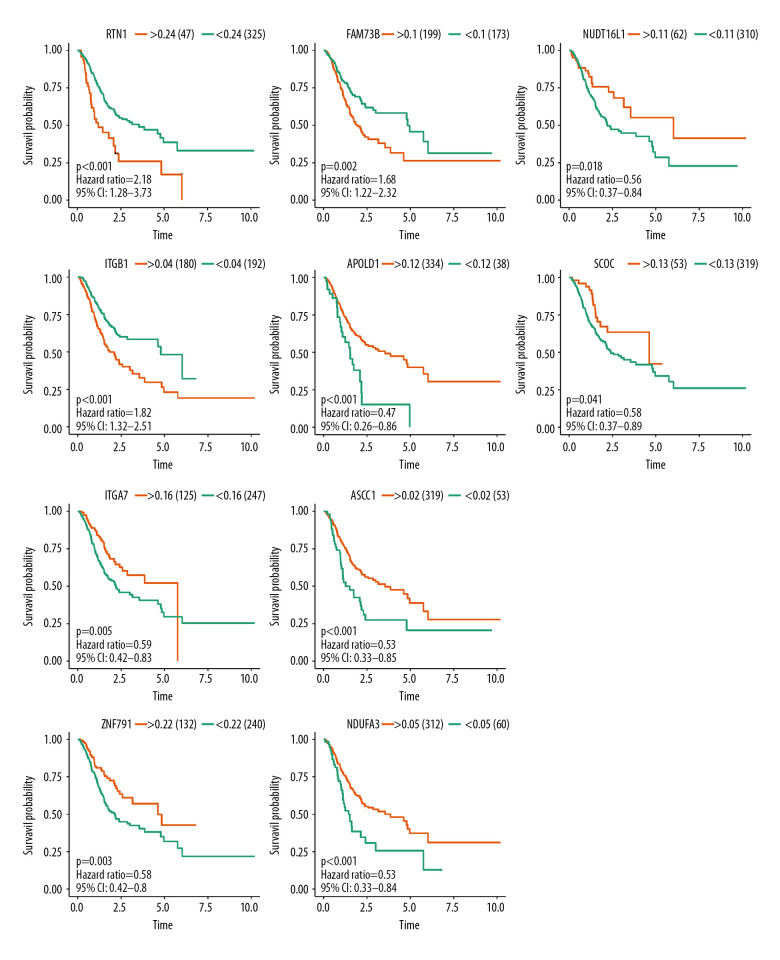
BACKGROUND Increasing evidence suggests that the alternative splicing (AS) signature plays a role in the carcinogenesis and prognosis of various cancers. However, the prognostic role of AS in gastric cancer is not clear and needs to be clarified. MATERIAL AND METHODS To identify the differentially expressed AS (DEAS) events, we performed a differential expression analysis between normal and tumor tissue. The DEAS event was further applied to construct a prognostic signature by performing univariate Cox regression analysis and least absolute shrinkage and selection operator (LASSO) analysis. The Kaplan-Meier curve analysis and receiver operating characteristic curve (ROC) analysis were used to evaluate the prognostic value of the AS signature. In addition, the network of the splicing events with splicing factors was constructed using the Cytoscape software. RESULTS A total of 30 005 alternative splicing (AS) events with 372 patients were retrieved from the SpliceSeq database and TCGA database. By performing differential expression analysis, a total of 419 alternative splicing events were screened out, including 56 upregulated and 363 downregulated. We further constructed an AS-related prognostic signature by conducting a series bioinformatics analyses. Moreover, we identified that the AS signature could serve as an independent predictor for the prognosis of GC. We also found that AS signature had a more robust and precise efficacy for prognostic prediction in GC patients. Interestingly, the areas under 3- and 5-year survival curves are similar, both of which are greater than 1-year survival curve, suggesting that the long-term predictive accuracy of our prognostic model built upon AS signature is superior. CONCLUSIONS We performed a comprehensive analysis of overall prognostic-associated AS events concerning GC and constructed a prognostic model to predict the long-term prognostic survival outcomes in GC patients. We also developed a network of splicing events with splicing factors to reveal new potential molecular diagnostic biomarkers and therapeutic targets for GC patients.
Conflict of interest statement
None.
Figures

Similar articles
-
Prognostic Signature of Alternative Splicing Events in Bladder Urothelial Carcinoma Based on Spliceseq Data from 317 Cases.Cell Physiol Biochem. 2018;48(3):1355-1368. doi: 10.1159/000492094. Epub 2018 Jul 26. Cell Physiol Biochem. 2018. PMID: 30048970
-
Identification of a prognostic alternative splicing signature in oral squamous cell carcinoma.J Cell Physiol. 2020 May;235(5):4804-4813. doi: 10.1002/jcp.29357. Epub 2019 Oct 21. J Cell Physiol. 2020. PMID: 31637730
-
Systemic characterization of alternative splicing related to prognosis and immune infiltration in malignant mesothelioma.BMC Cancer. 2021 Jul 22;21(1):848. doi: 10.1186/s12885-021-08548-3. BMC Cancer. 2021. PMID: 34294080 Free PMC article.
-
Alternative splicing in ovarian cancer.Cell Commun Signal. 2024 Oct 18;22(1):507. doi: 10.1186/s12964-024-01880-8. Cell Commun Signal. 2024. PMID: 39425166 Free PMC article. Review.
-
Aberrant alternative splicing in cancer: Splicing events and their regulatory mechanisms (Review).Int J Oncol. 2024 Sep;65(3):90. doi: 10.3892/ijo.2024.5678. Epub 2024 Aug 12. Int J Oncol. 2024. PMID: 39129306 Review.
References
-
- Bray F, Ferlay J, Soerjomataram I, et al. Global cancer statistics 2018: GLOBOCAN estimates of incidence and mortality worldwide for 36 cancers in 185 countries. Cancer J Clin. 2018;68(6):394–424. - PubMed
-
- Biagioni A, Skalamera I, Peri S, et al. Update on gastric cancer treatments and gene therapies. Cancer Metastasis Rev. 2019;38(3):537–48. - PubMed
-
- Li Y, Yuan Y. Alternative RNA splicing and gastric cancer. Mutat Res. 2017;773:263–73. - PubMed
-
- Miyamoto S, Nagamura Y, Nakabo A, et al. Aberrant alternative splicing of RHOA is associated with loss of its expression and activity in diffuse-type gastric carcinoma cells. Biochem Biophys Res Commun. 2018;495(2):1942–47. - PubMed
MeSH terms
Substances
LinkOut - more resources
Full Text Sources
Medical
Research Materials
Miscellaneous
