. 2020 Nov 20;11(1):5916.
doi: 10.1038/s41467-020-19630-y.

Decoding individual identity from brain activity elicited in imagining common experiences

Affiliations

Decoding individual identity from brain activity elicited in imagining common experiences

Andrew James Anderson et al. Nat Commun. .

Abstract

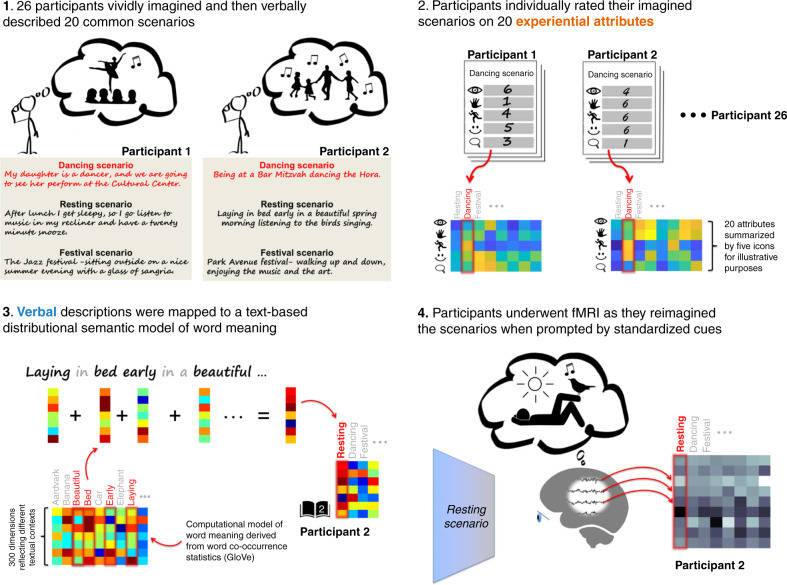
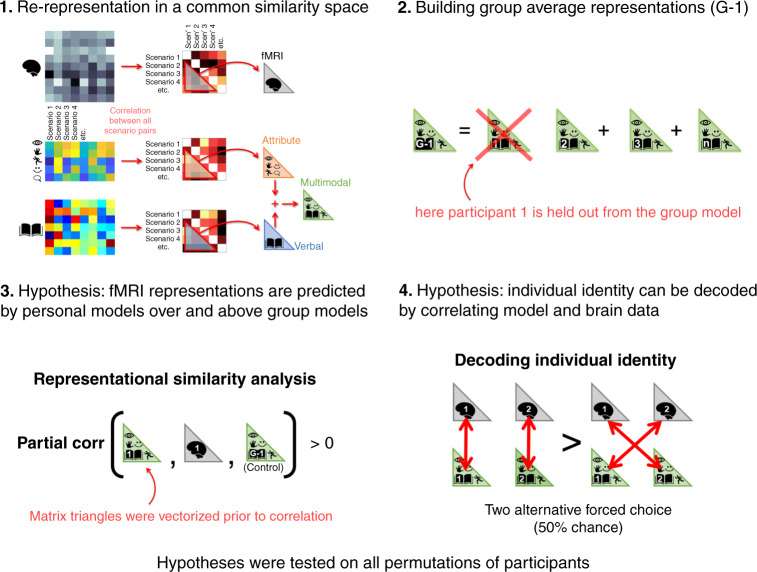
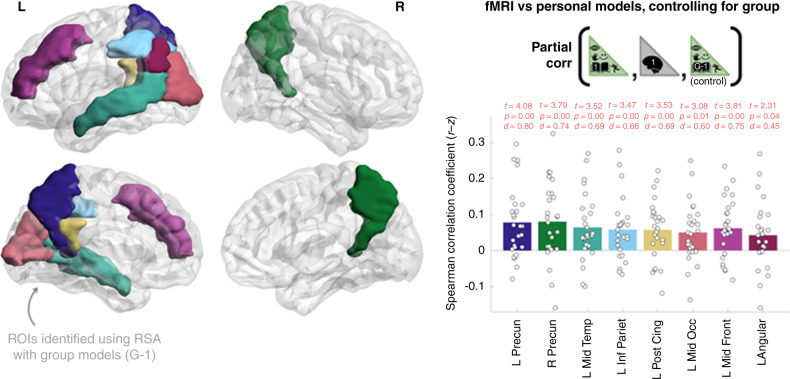
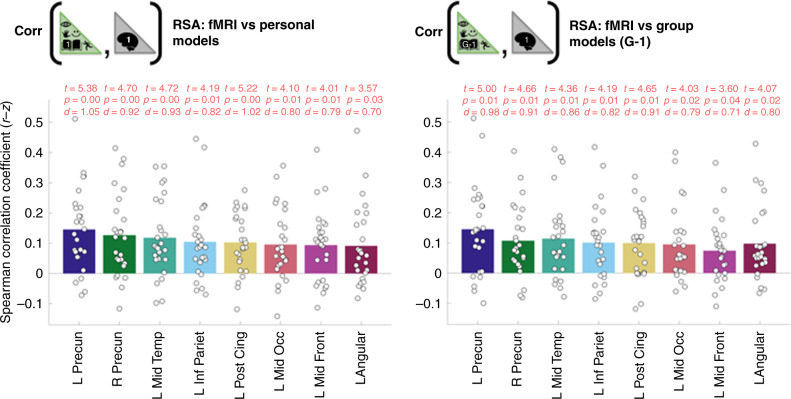
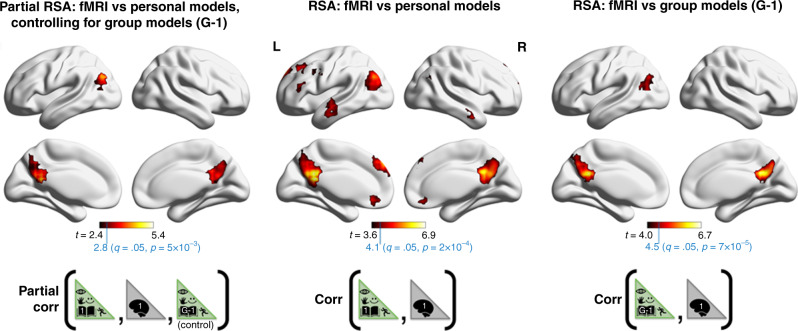
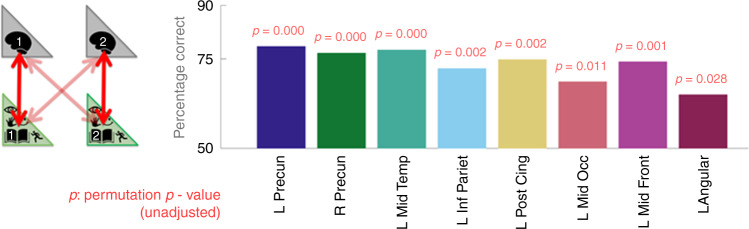
Everyone experiences common events differently. This leads to personal memories that presumably provide neural signatures of individual identity when events are reimagined. We present initial evidence that these signatures can be read from brain activity. To do this, we progress beyond previous work that has deployed generic group-level computational semantic models to distinguish between neural representations of different events, but not revealed interpersonal differences in event representations. We scanned 26 participants' brain activity using functional Magnetic Resonance Imaging as they vividly imagined themselves personally experiencing 20 common scenarios (e.g., dancing, shopping, wedding). Rather than adopting a one-size-fits-all approach to generically model scenarios, we constructed personal models from participants' verbal descriptions and self-ratings of sensory/motor/cognitive/spatiotemporal and emotional characteristics of the imagined experiences. We demonstrate that participants' neural representations are better predicted by their own models than other peoples'. This showcases how neuroimaging and personalized models can quantify individual-differences in imagined experiences.


Conflict of interest statement

The authors declare no competing interests.

Figures

Fig. 1
Fig. 1. Data collection: experimental protocol and construction of personal models of the imagined scenarios.
This diagram summarizes the entire data collection procedure as 4 stages, ranging from the collection and processing of behavioral data to fMRI scanning. The chronological order of stages 1, 2, and 4 reflects the actual order of experimentation. Stage 3 is automated and could in practice take place at any time after stage 1.
Fig. 2
Fig. 2. Representational similarity analysis protocol and hypothesis formalization.
The diagram summarizes the computational approach taken in our analyses and illustrates two formalizations of our primary hypothesis. Stage 1 was repeated for each participant. In the diagram fMRI data is represented as a single correlation matrix to simplify visualization, however stages 1 to 4 were repeated on fMRI activation extracted from multiple regions of interest (ROIs). Step 1 illustrates how the three personal scenario representations (fMRI and the verbal and attribute models were transformed into a common space to enable their comparison (stages 3 and 4). Step 2 illustrates how group-average model representations were constructed whilst excluding test participants (G-1). Stages 3 and 4 reflect different approaches to testing the same fundamental hypotheses that fMRI activation patterns reflect meaningful person-specific information that is brought to mind when individuals imagine themselves in different scenarios.
Fig. 3
Fig. 3. fMRI activation patterns elicited in imagining common scenarios reflect person-specific information.
The plot shows how participant-specific scenario models predict the representational similarities of corresponding fMRI data over and above group-average models (that excluded the respective participant in each test). Black circles illustrate RSA coefficients for the 26 participants. Bar heights correspond to the mean across participants. Bar colors correspond to the ROIs illustrated on the brain (left). One sample t-tests tested whether partial RSA coefficients were greater than zero (1-tailed). Cohen’s d was computed by dividing the t-statistic by 261/2. Exact FDR corrected p-values in the same order as plotted above were: 0.0030, 0.0030 0.0034, 0.0034, 0.0034, 0.0077, 0.0030, 0.0400 (see also Supplementary Table 2). Permutation-based p-values derived from partial RSA tests performed at an individual-level revealed significant outcomes (p < 0.05) in the following numbers of participants per ROI (in parentheses): L Precun (7), R Precun (9), L Mid Temp (5), L Inf Pariet (4), L Post Cing (4), L Mid Occ (3), L Mid Front (6), L Angular (4). The cumulative binomial probability of achieving 4 or more outcomes at p < 0.05 in an ROI is 0.04. The eight ROIs presented were selected using G-1 data (see “Methods” section, the following figure and Supplementary Table 1 for results using the personal and group-average models separately). Brain illustrations were made using ref. . Source data are provided as a Source Data file.
Fig. 4
Fig. 4. RSA coefficients for personal models (capturing idiosyncratic features) and group-average models (high signal-to-noise for group-commonalities) were of broadly similar magnitudes.
Black circles illustrate RSA coefficients for the 26 participants. Bar heights correspond to mean values across participants. t-tests tested whether RSA coefficients were greater than zero. Cohen’s d was computed by dividing the t-statistic by 261/2. P-values illustrated were FDR-corrected across 90 ROIs. Exact FDR corrected p-values in the same order as plotted above for the personal models were: 0.0024, 0.0047, 0.0047, 0.0116, 0.0024, 0.0124, 0.0138, 0.0327. Exact FDR corrected p-values in the same order as plotted above for the group-average models were: 0.0070, 0.0070, 0.0111, 0.0140, 0.0070, 0.0150, 0.0393, 0.0150. The eight ROIs plotted correspond to regions for which FDR corrected p-values derived using the group-average (G-1) models were less than 0.05 (see also “Methods” section). A detailed listing of results for all ROIs is provided in Supplementary Table 1. Permutation-based p-values derived from performing RSA at an individual-level revealed significant outcomes (p < 0.05) in the following numbers of participants per ROI (indicated in parentheses for personal and group-average models, respectively): L Precun (13,14), R Precun (12,8), L Mid Temp (10,11), L Inf Pariet (7,8), L Post Cing (10,9), L Mid Occ (9,8), L Mid Front (8,5), L Angular (8,7). The cumulative binomial probability of achieving 4 or more outcomes at p < 0.05 in an ROI is 0.04. Source data are provided as a Source Data file.
Fig. 5
Fig. 5. Neuroanatomical distribution of person-specific representational structure (RSA-Searchlight).
Computation of the three RSAs illustrated here, as well as hypothesis testing and FDR correction mirrored the protocol of the above ROI-based analyses translated into a searchlight framework. Differently ROI selection was by passing a 3-voxel radius cube throughout the brain (rather than segmenting anatomical atlas regions). The heat maps illustrate t-statistics corresponding to one sample t-tests of the corresponding RSA coefficients against zero. The t-statistics illustrated correspond to p-values that survived an FDR threshold placed at q = 0.1 (q = 0.1 was used rather than q = 0.05 to enhance the visibility of clusters for display purposes). The anatomical makeup of clusters arising from an FDR threshold of q = 0.05 are listed in detail in Supplementary Tables 3–5. Brain illustrations were made using ref. .
Fig. 6
Fig. 6. Individual identity can be decoded from fMRI activity elicited during the imagination of common scenarios.
Each bar illustrates the percentage of times that participant-specific models better predicted the same participant’s fMRI representations than another participants’ fMRI data (see main text for details). This test was repeated for each pairwise combination of the 26 participants. The eight ROIs illustrated were identified in our initial ROI-based analysis. Complete results for all ROIs are in Supplementary Table 2. To provide context for the neural-decoding accuracy values, we ran a comparative pairwise decoding analysis in absence of fMRI data based on the verbal and attribute models alone (e.g., P1-verbal vs. P1-attribute and so on). This yielded an accuracy of 83% (p = 0.0001). Source data are provided as a Source Data file.

Similar articles

Cited by

References

    1. Schacter D. L., Addis D. R. & Buckner R. L. Remembering the past to imagine the future: the prospective brain. Nat. Rev. Neurosci.8, 657–661 (2007). - PubMed
    1. Hassabis D, Kumaran D, Vann SD, Maguire EA. Patients with hippocampal amnesia cannot imagine new experiences. Proc. Natl Acad. Sci. USA. 2007;104:1726–1731. - PMC - PubMed
    1. Hassabis D, Kumaran D, Maguire EA. Using imagination to understand the neural basis of episodic memory. J. Neurosci. 2007;27:14365–14374. - PMC - PubMed
    1. Szpunar KK, Watson JM, McDermott KB. Neural substrates of envisioning the future. Proc. Natl Acad. Sci. USA. 2007;9:104. - PMC - PubMed
    1. Schacter DL, et al. The future of memory: remembering, imagining, and the brain. Neuron. 2012;76:677–694. - PMC - PubMed

Publication types