. 2020 Nov 20;11(1):5919.
doi: 10.1038/s41467-020-19670-4.

Regulation of cytokine signaling through direct interaction between cytokine receptors and the ATG16L1 WD40 domain

Affiliations

Regulation of cytokine signaling through direct interaction between cytokine receptors and the ATG16L1 WD40 domain

Inmaculada Serramito-Gómez et al. Nat Commun. .

Abstract

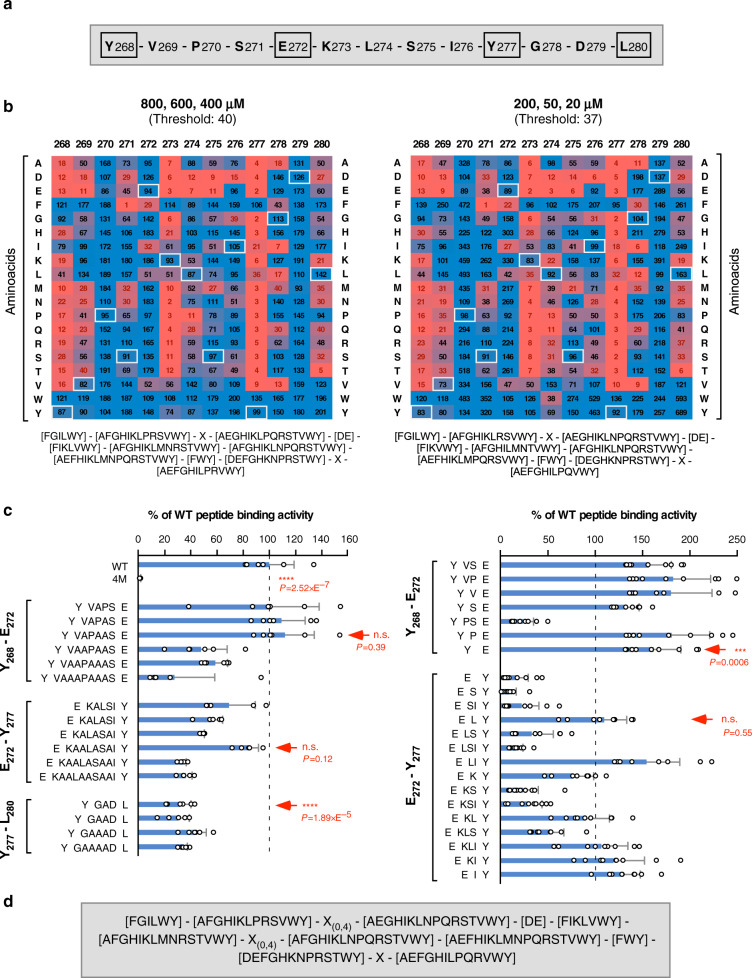
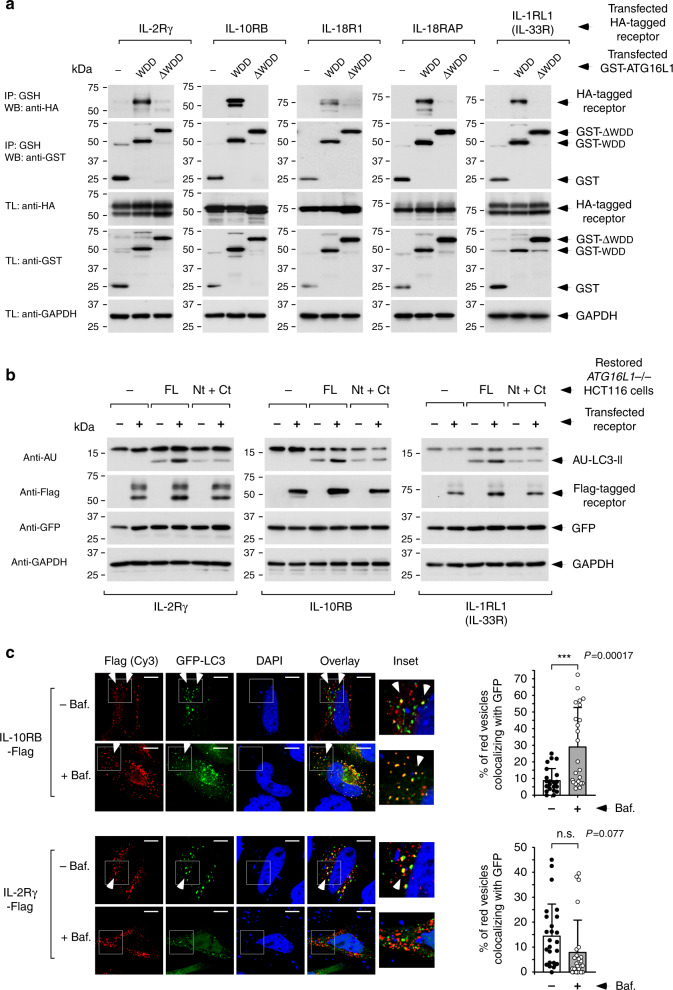
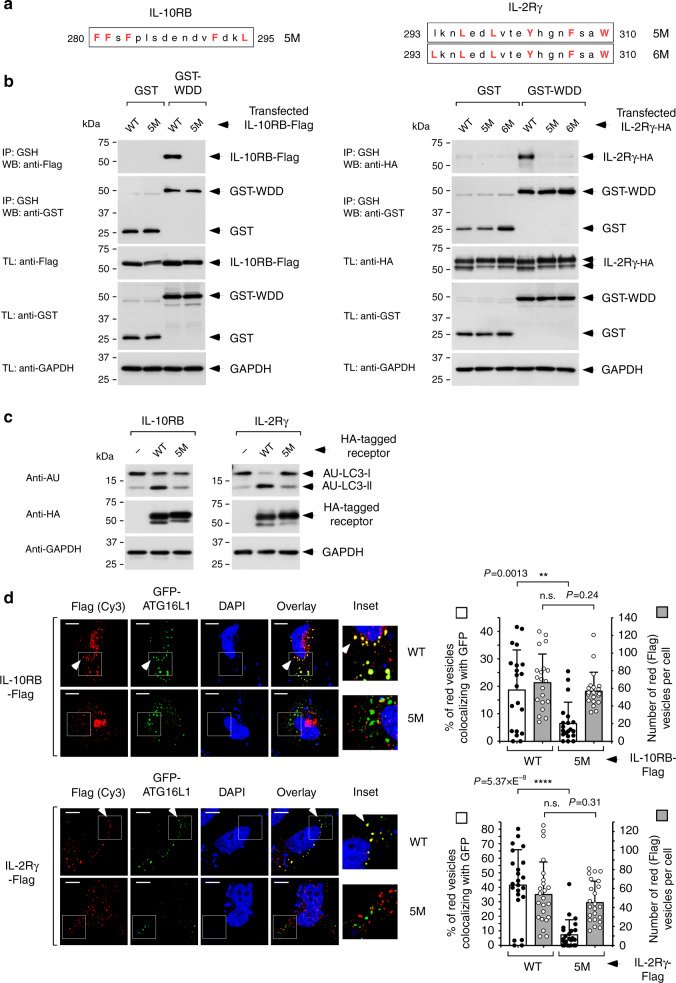
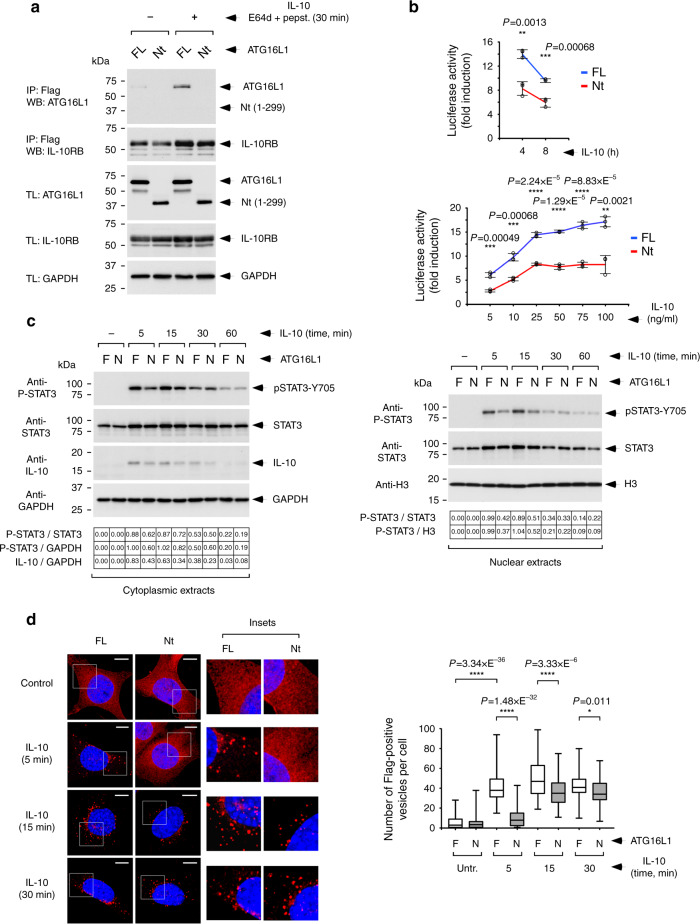
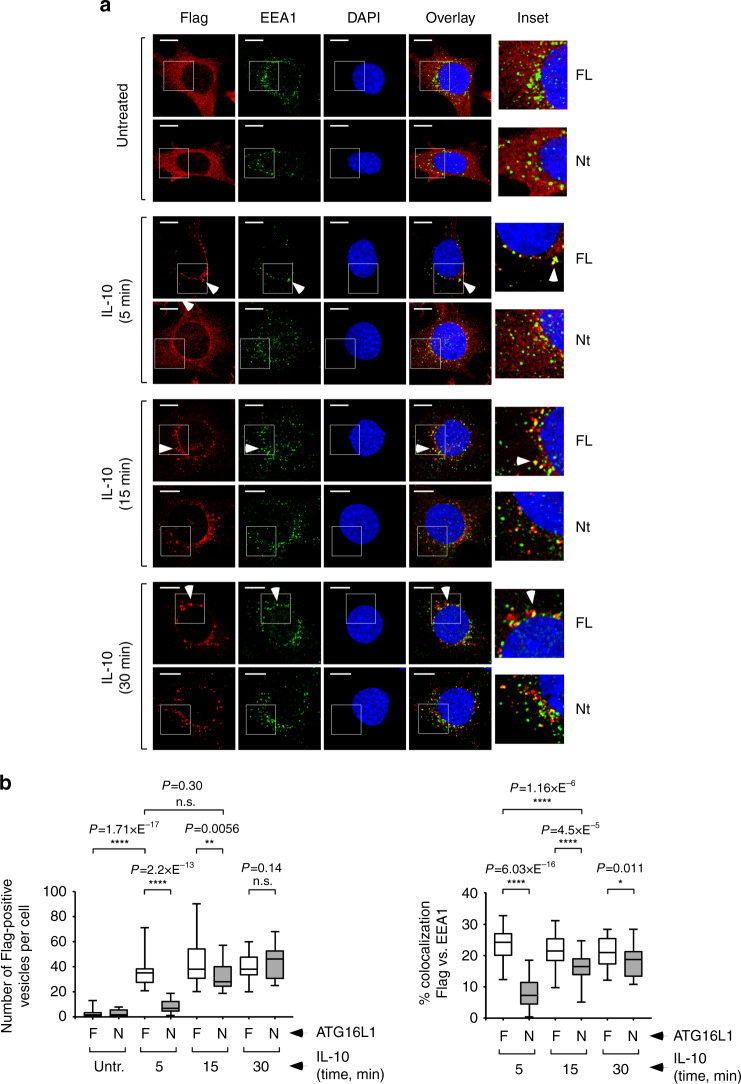
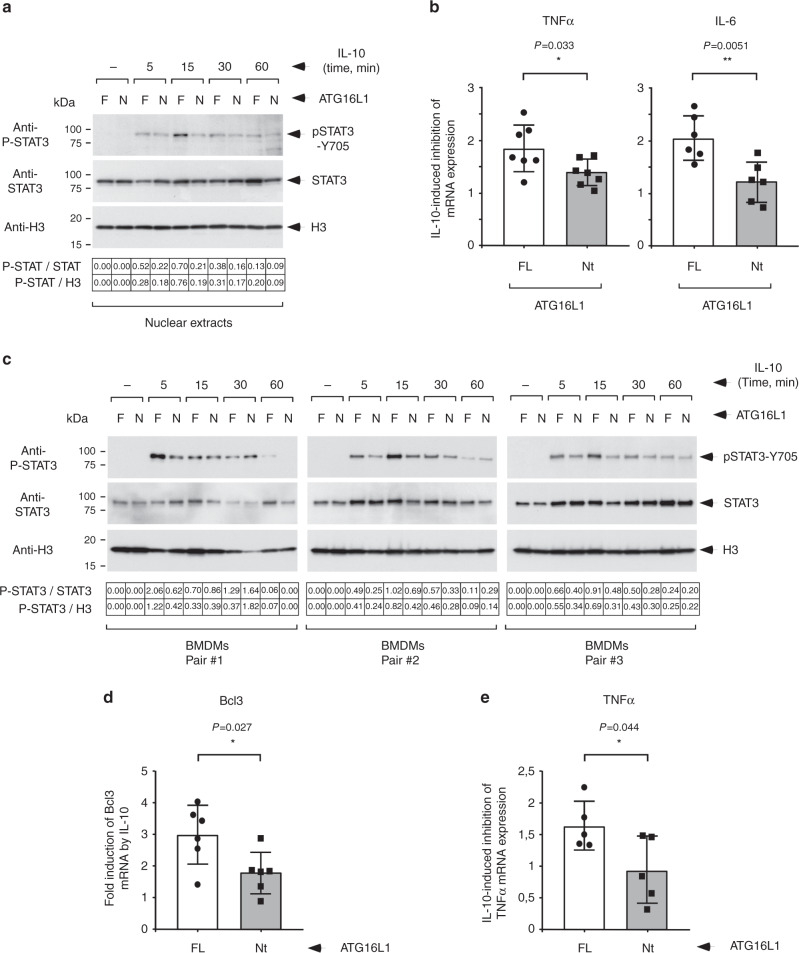
ATG16L1, an autophagy mediator that specifies the site of LC3 lipidation, includes a C-terminal domain formed by 7 WD40-type repeats (WD40 domain, WDD), the function of which is unclear. Here we show that the WDD interacts with the intracellular domain of cytokine receptors to regulate their signaling output in response to ligand stimulation. Using a refined version of a previously described WDD-binding amino acid motif, here we show that this element is present in the intracellular domain of cytokine receptors. Two of these receptors, IL-10RB and IL-2Rγ, recognize the WDD through the motif and exhibit WDD-dependent LC3 lipidation activity. IL-10 promotes IL-10RB/ATG16L1 interaction through the WDD, and IL-10 signaling is suboptimal in cells lacking the WDD owing to delayed endocytosis and inefficient early trafficking of IL10/IL-10R complexes. Our data reveal WDD-dependent roles of ATG16L1 in the regulation of cytokine receptor trafficking and signaling, and provide a WDD-binding motif that might be used to identify additional WDD activators.


Conflict of interest statement

The authors declare no competing interests.

Figures

Fig. 1
Fig. 1. WDD-binding motif refinement.
a WDD-binding peptide present in TMEM59 intracellular domain (268–280). Critical motif positions are marked by squares. b Peptide microarray studies to identify permissive aminoacids for WDD binding. Arrays containing the indicated peptide mutants were developed with GST-HA-ATG16L1231–607 to obtain crude binding values. Heatmaps display binding data expressed as the average percentage of the wild-type binding activity that is retained by each mutant. Left and right heatmaps show average data from assays performed at high (800, 600, 400 nM) and low (200, 50, 20 nM) ligand concentrations, respectively (3 experimental points, n = 8; statistics in Supplementary Fig. 1a). The color scale stretches continuously from low (red) to high (blue) binding activity. The indicated threshold values were arbitrarily established as the average binding activity displayed by variants that inhibit the interaction beyond 5%. Black/red figures indicate values above/below the threshold, thus establishing permissive/prohibited substitutions, respectively. White squares indicate native aminoacids in the wild-type peptide. Permissive residues for all positions are displayed below the heatmaps. c Microarray studies to establish the distance flexibility between critical residues. Microarrays including peptides with the indicated increased (left) or decreased (right) distances between Y268-E272, E272-Y277, and Y277-L280 were developed as in a. 4 M indicates a control peptide where critical residues are mutated to alanine (Y268A, E272A, Y277A, L280A). Shown are average binding activities processed as in a (−/+ s.d.). Data originate from 2 (left; 800, 400 nM (n = 6) except for E272-Y277 where n = 5) or 3 (right; 800, 600, 400 nM; n = 9) experimental points (n.s: P > 0,05; ***P < 0.001; ****P < 0.0001, two-sided Student’s t-test). Arrows indicate data defining the maximal (left) and minimal (right) distances allowed for each stretch. Thus, peptides YVAPAASE (Y268-E272) and EKAALASAIY (E272-277) (left), or YE (Y268-E272) and ELY (E272-277) (right), fully retain WDD-binding activity, indicating that 6 and 8 residues (left), or 0 and 1 (right), respectively, are permitted. Minimal variations in Y277-L280 spacing (YGADL; left) inhibit binding, so the native 2-residue distance was considered critical and deletions were not tested. d Inclusive WDD-binding motif integrating permissive residues and distance flexibility.
Fig. 2
Fig. 2. Selection of candidate receptors showing WDD-dependent functional features.
a Co-immunoprecipitation studies to identify receptors able to specifically interact with the WDD. HEK-293T cells were co-transfected with tagged forms of the indicated cytokine receptors along with constructs including the WDD (320–607) or ΔWDD (1–319) fused to GST, as shown. Cells were lysed 36 h later and subjected to GST immunoprecipitation with agarose beads coupled to GSH. Shown are Western-blots against the indicated molecules. IP: immunoprecipitate; TL: total lysate. b Evaluation of WDD-dependent LC3 lipidation activity. ATG16L1−/− HCT116 cells restored with the indicated versions of ATG16L1 (full-length (FL) or separated N-terminal (Nt; 1–299) and C-terminal (Ct; 300–607) domains) were transfected with the shown tagged cytokine receptors along with plasmids expressing AU-LC3 and GFP. Cells were lysed 36 h post-transfection for Western-blotting against the indicated molecules. The expression levels of co-transfected GFP remain unchanged, indicating equal transfection efficiency. c Colocalization between transfected cytokine receptors and co-expressed GFP-LC3. HeLa cells were transfected with the indicated tagged cytokine receptors and a plasmid expressing GFP-LC3. Cells were treated with bafilomycin A1 (75 nM, as indicated) during the last 6 h of culture, fixed 36 h post-transfection, stained with an anti-Flag antibody and scored for colocalization between the Flag signal (red) and GFP-LC3. Shown are representative confocal pictures (left) where the white arrows indicate colocalization events. Graphs (right) display the percentage of Flag-positive vesicles colocalizing with the GFP-positive signal in the different conditions −/+ s.d. (n = 23 cells for IL-10RB; n = 25 cells for IL-2Rγ; n.s: P > 0,05; ***P < 0.001, two-sided Student’s t-test).
Fig. 3
Fig. 3. Motif-dependent activities of IL-10RB and IL-2Rγ.
a Motif-containing peptides in IL-10RB and IL-2Rγ. Critical residues highlighted in red font were mutated to alanine in order to explore motif-dependent functions. IL-2Rγ Y303 is not strictly part of the motif, but it was also mutated since Y favors binding to the WDD at all positions of the peptide. b Co-precipitation studies between wild-type or motif-mutated versions of the receptors and GST-WDD. HEK-293T cells were co-transfected with Flag-tagged wild-type (WT) or motif-mutated (5 M or 6 M) forms of the indicated tagged cytokine receptors and a construct expressing GST-WDD (320–607). Cells were lysed 36 h later and subjected to GST immunoprecipitation with agarose beads coupled to GSH. Shown are Western-blots against the indicated molecules. IP: immunoprecipitate; TL: total lysate. c Evaluation of motif-dependent LC3 lipidation activity. HEK-293T cells were transfected with the indicated versions of HA-tagged IL-10RB and IL-2Rγ (WT or 5 M) along with a plasmid expressing AU-LC3. Cells were lysed 36 h post-transfection for Western-blotting against the indicated molecules. d Evaluation of motif-dependent co-localization between the cytokine receptors and GFP-ATG16L1. HeLa cells were transfected with the indicated versions of Flag-tagged IL-10RB and IL-2Rγ (WT or 5 M) and a plasmid expressing GFP-ATG16L1. Cells were fixed 36 h post-transfection, stained with an anti-Flag antibody and scored for colocalization between the Flag (red) signal and GFP-ATG16L1. Shown are representative confocal pictures (left, where the white arrows indicate colocalization events), and graphs (right) representing the percentage of Flag-positive vesicles colocalizing with the GFP-positive signal −/+ s.d. (left axis, white bars, solid dots) together with the total number of Flag-positive vesicles per cell −/+ s.d. (right axis, gray bars, white dots); n = 20 cells for IL-10RB and n = 23 cells for IL-2Rγ; n.s: P > 0,05; **P < 0.01; ****P < 0.0001, two-sided Student’s t-test.
Fig. 4
Fig. 4. Function of the WDD in IL-10R signaling examined in engineered MEFs.
Cells in all panels are Atg16L1−/− MEFs engineered to harbor a STAT3-luciferase reporter system and to express STAT3, subsequently restored with full-length ATG16L1 (FL) or a deleted version lacking the WDD (Nt, 1–299), and retrovirally transduced to express IL-10Rs A and B. a Co-precipitation between IL-10RB and ATG16L1 as a function of IL-10 treatment. The indicated cells (FL or Nt) were treated with IL-10 and E64d/pepstatin (10 μg/ml each) for 30 min or left untreated. Cells were then lysed and processed for anti-Flag immunoprecipitation. Shown are Western-blots against the indicated molecules. IP: immunoprecipitate; TL: total lysate. b Time-course and dose-response activation of STAT3-luciferase activity by IL-10. The indicated cells (FL or Nt) were treated with IL-10 for the shown times (100 ng/ml; top panel) or with the indicated doses of IL-10 (4 h; bottom panel), and lysed to measure luciferase activity. Data are expressed as the mean of fold induction of luciferase activity −/+ s.d of triplicate experimental points (n = 3; **P < 0.01; ***P < 0.001; ****P < 0.0001, two-sided Student’s t-test) from a representative experiment. c Pulse-chase assay of IL-10-induced STAT3 phosphorylation. Cells (F: FL, N: Nt) were pre-incubated with IL-10 (50 ng/ml; 30 min on ice), incubated at 37 °C for the shown times and lysed to obtain cytoplasmic and nuclear extracts for Western-blotting against the indicated molecules (H3, Histone-3). Corrected densitometric quantifications are shown at the bottom of the Western-blot images. d Immunofluorescence assay to evaluate the number of Flag-positive intracellular vesicles in IL-10 treated cells. The indicated cells were incubated with IL-10 (50 ng/ml) for the shown times and processed for anti-Flag immunofluorescence. Shown are representative confocal pictures (left). The graph (right) displays the number of Flag-positive vesicles per cell in the different conditions. Data are presented as box-plots where the central line represents the median value, the box shows percentiles 25–75 and the whiskers include the most extreme values (n = 56, n = 68 cells for untreated and treated samples, respectively; *P < 0.05; ****P < 0.0001, two-sided Student’s t-test).
Fig. 5
Fig. 5. Effect of the WDD in the early intracellular trafficking of IL-10/IL-10R endosomes.
a Immunofluorescence assays to explore IL-10-induced IL-10RB trafficking to early endosomes. The indicated cells (FL or Nt) were continuously treated with IL-10 (50 ng/ml) for the shown times and fixed for immunofluorescence with anti-Flag (red) and anti-EEA1 (green) antibodies. Shown are representative confocal pictures. Arrows indicate examples of colocalization events. b Quantification of the phenotypes observed in a. The left panel shows the number of Flag-positive vesicles per cell at different times after IL-10 treatment in this experiment, and the right panel represents the percentage of colocalizing red (Flag) and green (EEA1) signals per cell (F: FL; N: Nt). Data are presented as box-plots where the central line represents the median value, the box shows percentiles 25–75 and the whiskers include the most extreme values (n = 27 cells; n.s: P > 0,05; *P < 0.05; **P < 0.01; ****P < 0.0001, two-sided Student’s t-test).
Fig. 6
Fig. 6. Function of the WDD in IL-10 signaling in THP1 cells and BMDMs.
a Pulse-chase assay of IL-10-induced STAT3 phosphorylation in differentiated THP1 cells. The indicated strains (F: endogenous full-length ATG16L1; N: CRISPR/Cas9-induced ATG16L1 depletion (guide 1025–1044) plus restoration with the Nt domain, aminoacids 1–299) were treated with PMA (125 ng/ml; 48 h), pre-incubated with IL-10 (50 ng/ml; 30 min on ice), incubated at 37 °C for the shown times and lysed to obtain nuclear extracts for the indicated Western-blots. Corrected densitometric quantifications are shown at the bottom of the Western-blot images. b Quantitative PCR to assess IL-10-induced suppression of TNF and IL-6 mRNA upregulation by LPS in THP1 cells. Cells were pre-activated as in a, treated with LPS (TNF, 10 ng/ml; IL-6, 10 or 60 ng/ml) for 5 h with or without IL-10 (50 ng/ml) and lysed for qPCR. Shown are average fold inhibition values induced by IL-10 −/+ s.d. (TNF: n = 7, IL-6: n = 6 experimental points; *P < 0.05; **P < 0.01, two-sided Student’s t-test). c Pulse-chase assay of IL-10-induced STAT3 phosphorylation in BMDMs. BMDMs from 3 randomly-chosen mouse pairs (F: full-length ATG16L1; N: E230 mice expressing the Nt domain) were pre-incubated with IL-10 (50 ng/ml; 30 min on ice), incubated at 37 °C for the shown times and lysed to obtain nuclear extracts for the indicated Western-blots. Corrected densitometric quantifications are shown at the bottom of the Western-blot images. A statistical analysis of nuclear P-STAT3 signals is shown in Supplementary Fig. 16c. d Quantitative PCR to evaluate IL-10-induced expression of Bcl3. BMDMs from the indicated mice were treated with IL-10 (50 ng/ml, 4 h) and lysed for qPCR. Shown are average fold induction values induced by IL-10 −/+ s.d. (n = 6 mice; *P < 0.05, two-sided Student’s t-test). e Quantitative PCR to assess IL-10-induced suppression of TNF mRNA upregulation by LPS. BMDMs from the indicated mice were treated with LPS (1 ng/ml; 6 h) with or without IL-10 (50 ng/ml) and lysed for qPCR. Shown are average fold inhibition values induced by IL-10 −/+ s.d. (n = 5 mice; *P < 0.05, two-sided Student’s t-test).

References

    1. He C, Klionsky DJ. Regulation mechanisms and signaling pathways of autophagy. Annu. Rev. Genet. 2009;43:67–93. doi: 10.1146/annurev-genet-102808-114910. - DOI - PMC - PubMed
    1. Yu L, Chen Y, Tooze SA. Autophagy pathway: cellular and molecular mechanisms. Autophagy. 2018;14:207–215. doi: 10.1080/15548627.2017.1378838. - DOI - PMC - PubMed
    1. Mizushima N, Yoshimori T, Ohsumi Y. The role of Atg proteins in autophagosome formation. Annu. Rev. Cell Dev. Biol. 2011;27:107–132. doi: 10.1146/annurev-cellbio-092910-154005. - DOI - PubMed
    1. Bento CF, et al. Mammalian autophagy: how does it work? Annu. Rev. Biochem. 2016;85:685–713. doi: 10.1146/annurev-biochem-060815-014556. - DOI - PubMed
    1. Mizushima N, Levine B, Cuervo AM, Klionsky DJ. Autophagy fights disease through cellular self-digestion. Nature. 2008;451:1069–1075. doi: 10.1038/nature06639. - DOI - PMC - PubMed

Publication types

MeSH terms