. 2020 Nov 20;11(1):5908.
doi: 10.1038/s41467-020-19569-0.

Distinct dynamics of social motivation drive differential social behavior in laboratory rat and mouse strains

Affiliations

Distinct dynamics of social motivation drive differential social behavior in laboratory rat and mouse strains

Shai Netser et al. Nat Commun. .

Abstract

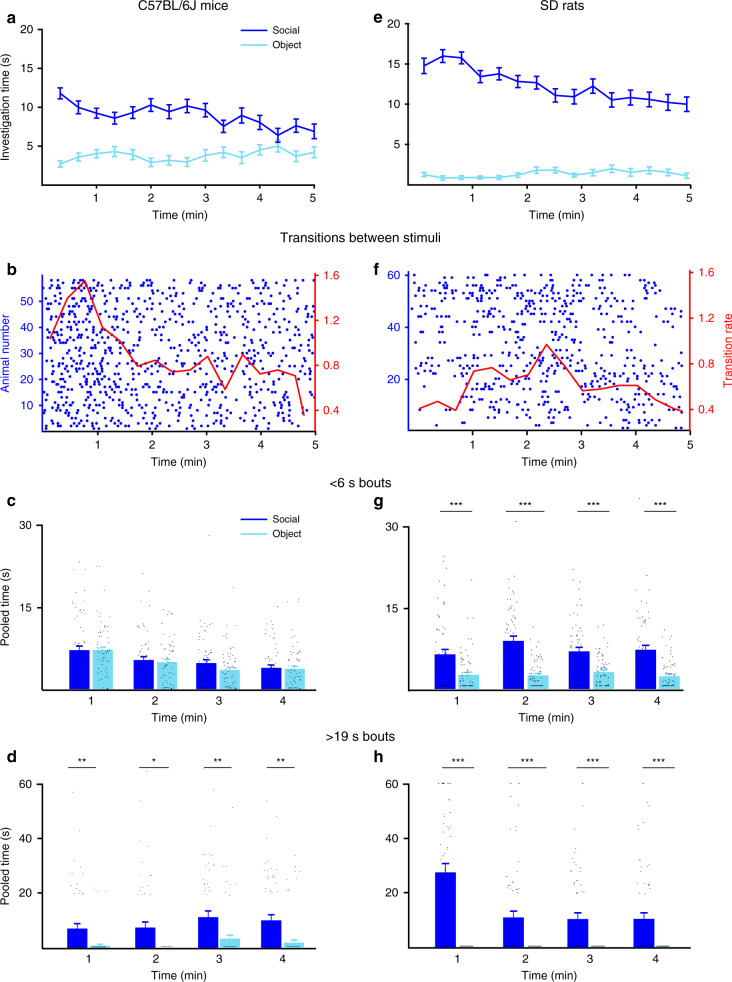
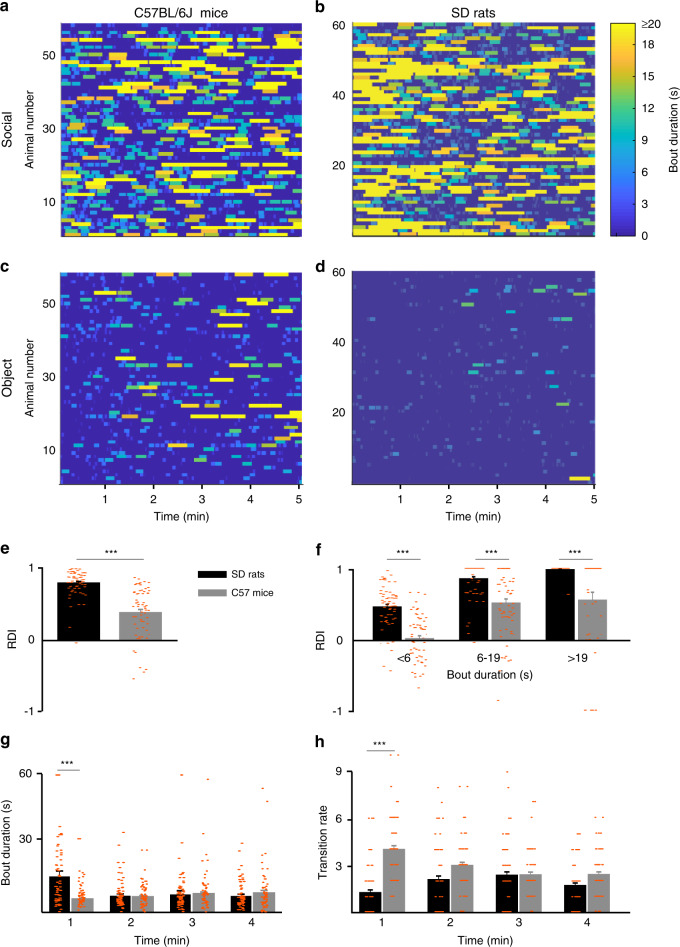
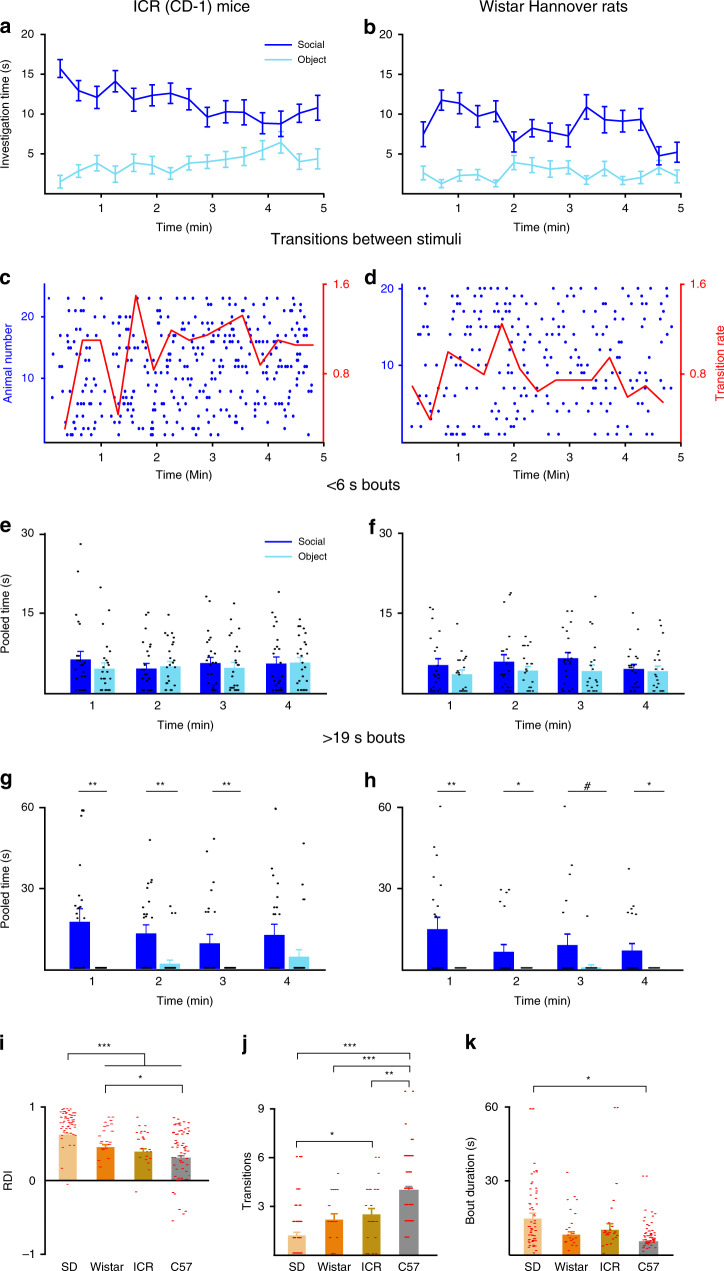
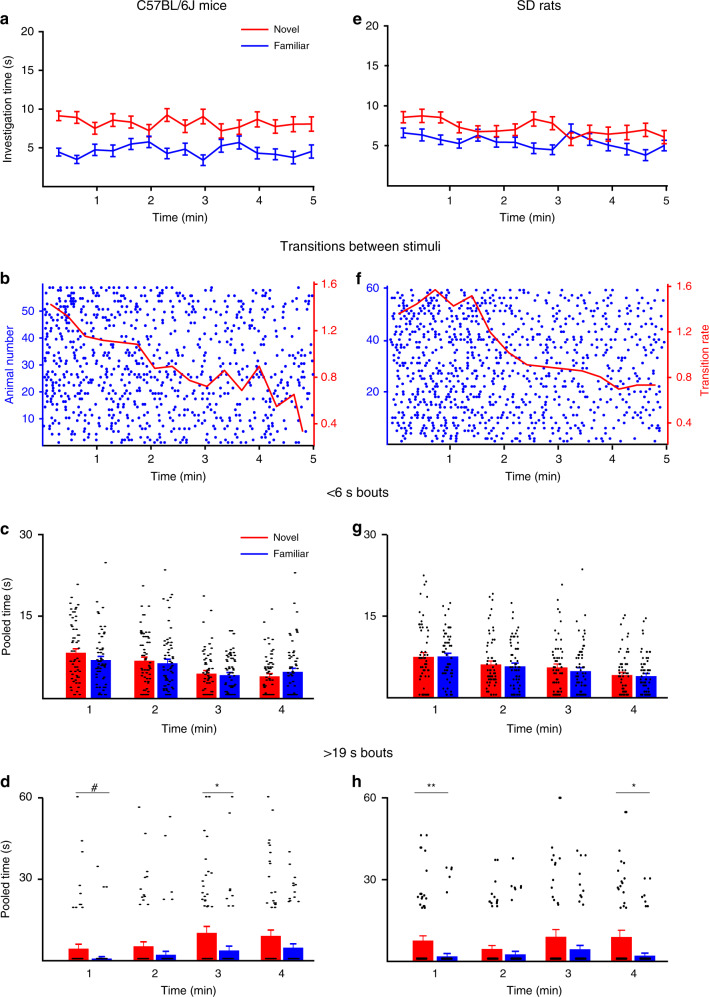
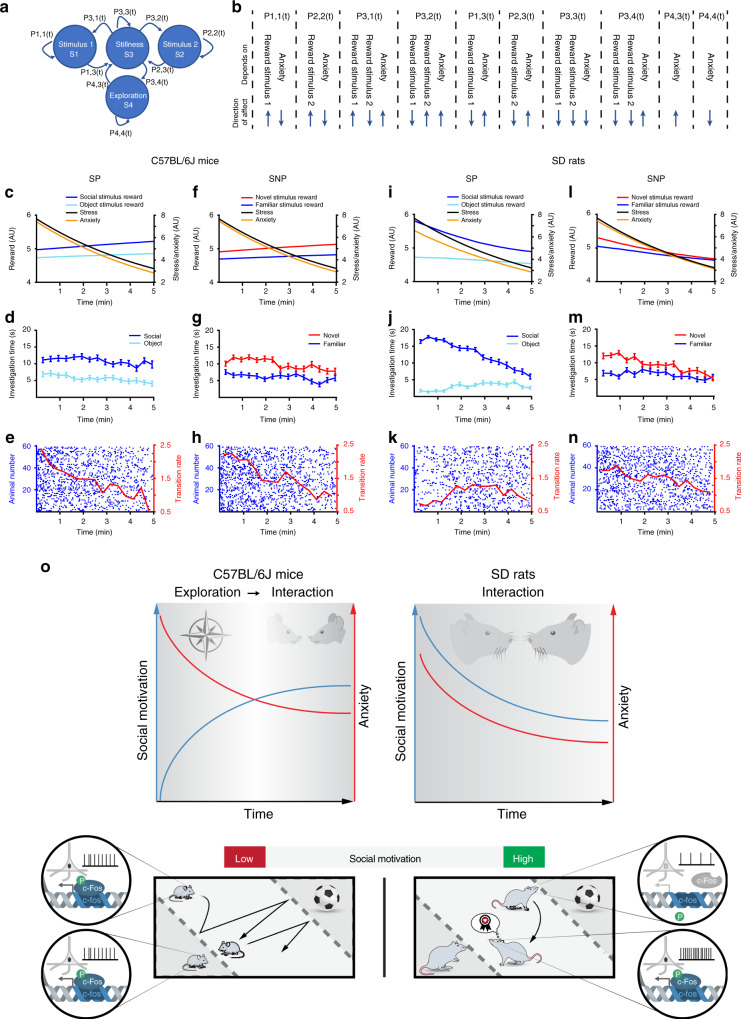
Mice and rats are widely used to explore mechanisms of mammalian social behavior in health and disease, raising the question whether they actually differ in their social behavior. Here we address this question by directly comparing social investigation behavior between two mouse and rat strains used most frequently for behavioral studies and as models of neuropathological conditions: C57BL/6 J mice and Sprague Dawley (SD) rats. Employing novel experimental systems for behavioral analysis of both subjects and stimuli during the social preference test, we reveal marked differences in behavioral dynamics between the strains, suggesting stronger and faster induction of social motivation in SD rats. These different behavioral patterns, which correlate with distinctive c-Fos expression in social motivation-related brain areas, are modified by competition with non-social rewarding stimuli, in a strain-specific manner. Thus, these two strains differ in their social behavior, which should be taken into consideration when selecting an appropriate model organism.


Conflict of interest statement

The authors declare no competing interests.

Figures

Fig. 1
Fig. 1. Distinct social-preference (SP) dynamics of C57BL/6J mice and SD rats.
a Mean investigation time of social and object stimuli, averaged in 20-s bins across time during the 5-min-long SP test conducted with C57BL/6J mice (n = 58). b Transitions between the two stimuli, made by subject mice across time during the test. Each punctum denotes the beginning of investigation of a new stimulus, and each row represents a single subject. The mean rate (using 20-s bins) is denoted by the red line (right red y-axis). c Mean pooled time of short investigation bouts (<6 s) across time during the SP test of mice (using 1-min bins, last minute excluded; see “Methods”). d As in c, when extended bouts (>19 s) are considered. Black lines at the bottom of the bars represent data points with a value of zero. eh As in ad, for SD rats (n = 60). Black lines at the bottom of the bars represent data points with a value of zero. *p < 0.05, **p < 0.01, ***p < 0.001, post hoc two-tail t test following the main effect. All error bars represent SEM. Source data are provided as a Source Data file.
Fig. 2
Fig. 2. Differences in social-preference dynamics are at the beginning of the test.
a Heatmap (each row represents one animal) of the investigation behavior toward the social stimuli during the SP test, performed by C57BL/6J mice (n = 58). b As in a for SD rats (n = 60). c, d As in a, b for object stimuli. e Mean RDI (relative differential investigation) values for the SP test conducted with C57BL/6J mice and SD rats. f As in e, for the three categories of bout duration. g Comparison of mean bout duration values (averaged using 1-min bins) for the first 4 min of the test, between C57BL/6J mice and SD rats. h As in g, for mean transition rate. ***p < 0.001, post hoc two-tail t test following the main effect. All error bars represent SEM. Source data are provided as a Source Data file.
Fig. 3
Fig. 3. Differences in social-preference dynamics are strain-specific.
a Mean investigation time of social and object stimuli, averaged in 20-s bins for ICR (CD-1) mice (n = 23) across time during the 5-min-long SP test. b As in a, for Wistar Hannover rats (n = 20). c Transitions between the two stimuli, made by subject ICR (CD-1) mice across time during the test. Each punctum denotes the beginning of investigation of a new stimulus, and each row represents a single subject. The mean rate (using 20-s bins) is denoted by the red line (right red y-axis). d As in c, for Wistar Hannover rats. e Mean pooled time of short investigation bouts (<6 s) made by ICR (CD-1) mice across time during the SP test (using 1-min bins, last minute excluded; see “Methods”). f As in e, for Wistar Hannover rats. g As in e, when extended bouts (>19 s) are considered. *p < 0.05, **p < 0.01, post hoc two-tail t test following the main effect. Black lines at the bottom of the bars represent data points with a value of zero. h As in g, for Wistar Hannover rats. #p = 0.07, *p < 0.05, **p < 0.01, post hoc two-tail t test following the main effect. Black lines at the bottom of the bars represent data points with a value of zero. i Mean RDI values for the four strains of rats and mice tested with the SP test (C57BL/6J: n = 58, SD rats: n = 60, ICR: n = 23, and Wistar Hannover: n = 20). ***p < 0.001, *p < 0.05, post hoc two-tail Games–Howell test following the main effect. j Mean transition rate during the first minute of the SP test, for the four strains of rats and mice tested, as in i. *p < 0.05, **p < 0.01, ***p < 0.001, post hoc two-tail Games–Howell test following the main effect. k Mean bout duration during the first minute of the SP test, for the four strains of rats and mice tested, as in i. *p < 0.05, post hoc two-tail Games–Howell test following the main effect. All error bars represent SEM. Source data are provided as a Source Data file.
Fig. 4
Fig. 4. Similar social-novelty preference (SNP) dynamics of C57BL/6J mice and SD rats.
a Mean investigation time of novel and familiar social stimuli, averaged in 20-s bins across time during the 5-min-long SNP test conducted with C57BL/6J mice (n = 58). b Transitions between the two stimuli, made by subject mice across time during the test. Each punctum denotes the beginning of investigation of a new stimulus, and each row represents a single subject. The mean rate (using 20-s bins) is denoted by the red line (right red y-axis). c Mean pooled time of short investigation bouts (<6 s) across time during the SNP test of mice (using 1-min bins, last minute excluded; see “Methods”). d As in c, when extended bouts (>19 s) are considered. Black lines at the bottom of the bars represent data points with a value of zero. eh As in ad, for SD rats (n = 60 rats). #p = 0.05, *p < 0.05, **p < 0.01, post hoc two-tail t test following the main effect. All error bars represent SEM. Source data are provided as a Source Data file.
Fig. 5
Fig. 5. Different responses of SD rat and C57BL/6J mouse subjects to movements made by social stimuli.
a Array of piezoelectric sensor disks spread on the floor of a triangular chamber. b A scheme of the electric circuit used for acquiring data from the piezoelectric sensors during experiments. c An example of a raw-signal trace recorded during a 5-min SP test from a mouse social stimulus. The inset shows a short section in higher time resolution. d Mean number of large movements (averaged using 1-min bins) performed by mouse social stimuli (n = 28) across the time course of the SP test. e Development of social investigation following a major stimulus movement (red trace) or without major movement (orange trace), superimposed on the mean signal of the stimulus movement (blue trace, right y-axis). Dashed line represents the peak of the mean movement. f Same as in e, for investigation of the object stimulus during the same experiments. g Mean cumulative investigation time of the social (left) or object (right) stimuli, with (red) or without (orange) social stimulus movement. hl As in dg, for rats (n = 24). *p < 0.05, ***p < 0.001, post hoc two-tail t test following the main effect. All error bars represent SEM. Source data are provided as a Source Data file.
Fig. 6
Fig. 6. C57BL/6J mice and SD rats differ in c-Fos induction by exposure to novel social stimuli.
a Heatmap of investigation behavior of six C57BL/6J mice toward the social stimuli in a 2-min SP test, with each line representing a single animal. b As in a, for the object stimuli. c Analysis of transitions between stimuli made during the same experiments described in a, b, with each transition represented by a punctum and each animal by a row. Mean values (averaged over 20-s bins) are shown by the red line (right y-axis). df As in ac, for five SD rats. g Representative images of c-Fos immunostaining in the four brain areas denoted above, for one mouse from each of the three groups. h Same as g, for one rat from each of the three groups (the groups are denoted between g and h). i Mean values of the three groups of mice (Control: n = 4, Chamber: n = 6, Free: n = 4), for each of the four brain regions. j Same as i, for rats (Control: n = 4, Chamber: n = 5, Free: n = 4). #p < 0.07, **p < 0.01, post hoc two-tail t test with Bonferroni’s correction following the main effect. All error bars represent SEM. Source data are provided as a Source Data file.
Fig. 7
Fig. 7. Differences in social motivation of C57BL/6J mice and SD rats, as revealed by competition between social and food stimuli.
a A picture depicting the setup used for creating a competition between social and food stimuli, without allowing the subject to consume the food palettes. b Schematic representation of the experimental timeline, in which the same groups of C57BL/6J mice (n = 16) and SD rats (n = 8) were tested following three different conditions of food deprivation, as denoted. c Mean total investigation time (during the 5-min test) of social and food stimuli by mouse subjects, at the three different conditions of food deprivation. d As in c, for rats. e Mean investigation time (20-s bins) of social and food stimuli by mice subjects across time during the test, for satiety condition. f Same as e, for rats following 24 h of food deprivation. g Statistical comparison of mean social investigation time (1-min bins) across time during the test, between SD rats and C57BL/6J mice at conditions were no general preference was exhibited. h Mean transition rate for the first minute of the test for the experiments shown in (c). i As in h, for the experiments shown in (d). *p < 0.05, **p < 0.01, ***p < 0.001, post hoc two-tail t test following the main effect. All error bars represent SEM. Source data are provided as a Source Data file.
Fig. 8
Fig. 8. Behavioral differences between SD rats and C57BL/6J mice are recapitulated by a computational model.
a A schematic depiction of a Markov model with four behavioral states used to simulate the behavior of SD rats and C57BL/6J mice in the SP and SNP tests. b A schematic description of how each of the model’s probabilities is affected by the various parameters. c The four parameters of the model plotted against time for the SP test in mice. d Mean investigation time (averaged over 20-s bins) for the social and object stimuli, of a simulated random population of 60 mice in the SP test. e Transitions between stimuli made by the same simulated experiment as in d, with each punctum representing a transition and each row a subject mouse. Mean transition rate (averaged over 20-s bins) is represented by the red line (note the right y-axis for the red line). fh As in ce, for the SNP test simulated with mice. ik As in ce, for the SP test simulated for a random population of 60 rats. ln As in ce, for the SNP test simulated with rats. o A cartoon, schematically describing the opposite dynamics of social motivation between SD rats and C57BL/6J mice (upper panels), leading to the distinct patterns of social behavior of the two strains in the SP test. These patterns are described by a gradual shift from exploration to interaction in mice, as opposed to a shift from intensive to more relaxed social interactions in rats. They lead to a high level of transitions between stimuli in mice, as opposed to rats (lower panel), which is explained by rather similar motivation to explore both stimuli in mice, in contrast to the much higher motivation to explore the social stimulus exhibited by rats. These levels of motivation are reflected by the rate of neuronal activity in social-motivation-associated brain regions, which leads to c-Fos transcription in the nuclei of these neurons. All error bars represent SEM. Source data are provided as a Source Data file.

Similar articles

Cited by

References

    1. Stanley DA, Adolphs R. Toward a neural basis for social behavior. Neuron. 2013;80:816–826. doi: 10.1016/j.neuron.2013.10.038. - DOI - PMC - PubMed
    1. Ellenbroek B, Youn J. Rodent models in neuroscience research: is it a rat race? Dis. Model. Mech. 2016;9:1079–1087. doi: 10.1242/dmm.026120. - DOI - PMC - PubMed
    1. de la Torre-Ubieta L, Won HJ, Stein JL, Geschwind DH. Advancing the understanding of autism disease mechanisms through genetics. Nat. Med. 2016;22:345–361. doi: 10.1038/nm.4071. - DOI - PMC - PubMed
    1. Kazdoba TM, Leach PT, Crawley JN. Behavioral phenotypes of genetic mouse models of autism. Genes Brain Behav. 2016;15:7–26. doi: 10.1111/gbb.12256. - DOI - PMC - PubMed
    1. Patil CK, McCarroll SA. Of rats and men. Cell. 2013;154:481–483. doi: 10.1016/j.cell.2013.07.022. - DOI - PubMed

Publication types

Substances

LinkOut - more resources