. 2020 Nov 20;11(1):5920.
doi: 10.1038/s41467-020-19258-y.

An enhanced isothermal amplification assay for viral detection

Affiliations

An enhanced isothermal amplification assay for viral detection

Jason Qian et al. Nat Commun. .

Abstract

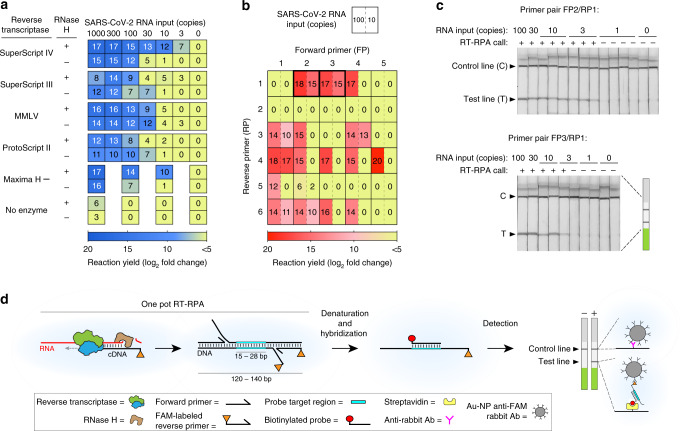
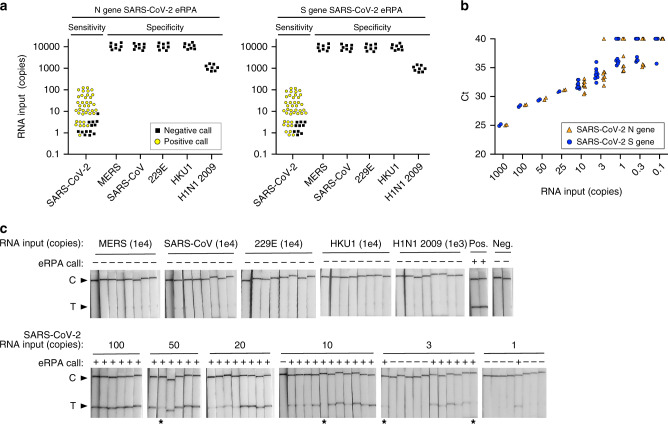
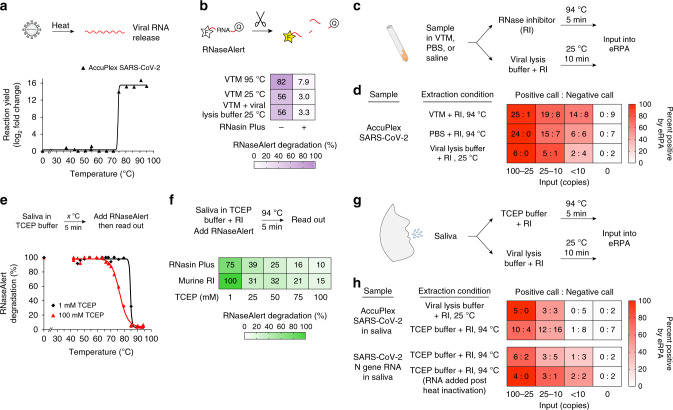
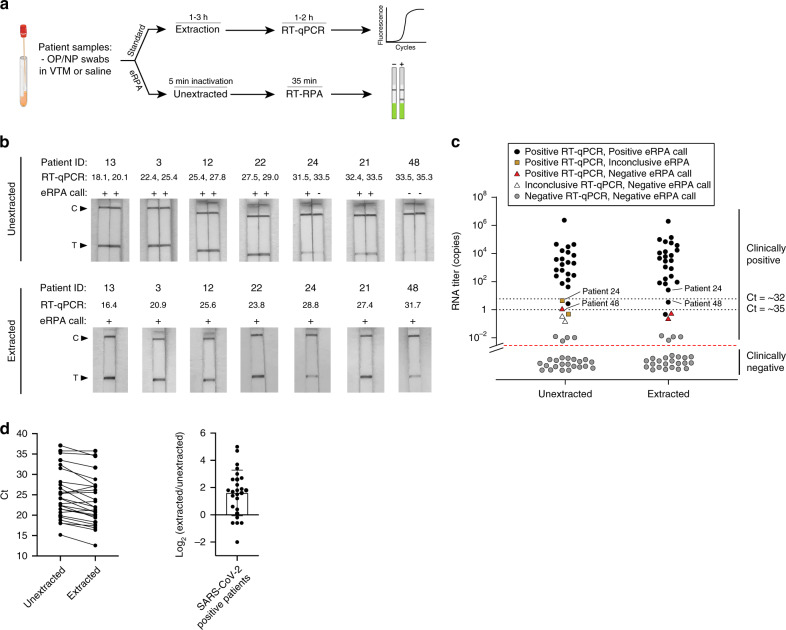
Rapid, inexpensive, robust diagnostics are essential to control the spread of infectious diseases. Current state of the art diagnostics are highly sensitive and specific, but slow, and require expensive equipment. Here we report the development of a molecular diagnostic test for SARS-CoV-2 based on an enhanced recombinase polymerase amplification (eRPA) reaction. eRPA has a detection limit on patient samples down to 5 viral copies, requires minimal instrumentation, and is highly scalable and inexpensive. eRPA does not cross-react with other common coronaviruses, does not require RNA purification, and takes ~45 min from sample collection to results. eRPA represents a first step toward at-home SARS-CoV-2 detection and can be adapted to future viruses within days of genomic sequence availability.


Conflict of interest statement

M.S. is inventor on U.S. Provisional Patent Application 63/993,521 and 63/031,120 (Harvard Case #8152). A company, Qtection LLC, has been launched to commercialize eRPA and provide effective testing options to the public. M.S. is a founder of the company. All other authors declare no competing interests.

Figures

Fig. 1
Fig. 1. Development of eRPA: an enhanced RT-RPA based assay for detection of SARS-CoV-2.
a Screen for reverse transcriptase (RT) enzyme and effect of RNase H. SARS-CoV-2 RNA was amplified by RT-recombinase polymerase amplification (RT-RPA) using five different RTs with or without RNase H addition and the yield of each reaction was determined by quantitative PCR (qPCR). At least two biological and two technical replicates were used for each data point; numbers in each square represent mean log2 fold amplification. Samples labeled as zero yielded only non-specific amplification products. b Primer optimization screen. SARS-CoV-2 RNA was amplified by RT-RPA using forward and reverse primers specific to the S gene. The yield of each reaction was determined by qPCR using the same primer pair as for the RT-RPA reaction. Data represent mean log2 fold amplification from two technical replicates for each RNA input. c Lateral flow strip readout of RT-RPA reactions of SARS-CoV-2 RNA using primer pairs FP2/FAM-labeled RP1 and FP3/FAM-labeled RP1. All lateral flow strips contain a control (C) and test (T) band. d Schematic of eRPA. Viral RNA is first copied to cDNA by RT, then degraded by RNase H. The cDNA product is amplified by RPA using a forward and a FAM-labeled reverse pair of primers specific to the target sequence. The amplified material is then denatured and hybridized to a biotinylated probe. Dual FAM-labeled and biotin-labeled products are detected on lateral flow strips. Source data are available in the Source Data file.
Fig. 2
Fig. 2. Sensitivity and specificity of RNA detection.
a Summary of eRPA test results for detection of RNA from SARS-CoV-2 or from other viruses. Synthetic full genome SARS-CoV-2 RNA was amplified by eRPA using primers targeting the N or S gene and reactions were read out by lateral flow strip. The specificity of eRPA was tested against either in vitro transcribed (IVT) RNA of the related viruses MERS and SARS-CoV, or IVT RNA of the common cold coronaviruses HCoV-HKU1 and HCoV-229E, or viral genomic RNA extracted from 2009 H1N1 Influenza. Data points represent positive (yellow circles) or negative (black squares) eRPA tests for each sample tested and are staggered on both axes for visualization. b Quantification of the synthetic full genome SARS-CoV-2 RNA used as input in the eRPA assay by RT-qPCR. Data are Ct values determined using a one-step commercial RT-qPCR assay using primers targeting either the N or S gene of SARS-CoV-2. Data points at Ct = 40 represent non-specific or no amplification. N gene (orange triangles) and S gene (blue circles) data are offset on the x-axis for visualization purposes. c Lateral flow strip readouts for all N gene data shown in a. Individual strips are labeled with the test call made within 20 min of detection (positive (+) or negative (−)). The positive (Pos.) eRPA control is 1000 copies of synthetic full genome SARS-CoV-2 RNA and the negative (Neg.) eRPA control is a water-only input. Images taken for the purpose of display were allowed to dry which reduced the intensity of some weak bands (labeled with asterisks). Source data are available in the Source Data file.
Fig. 3
Fig. 3. Lysis and detection of SARS-CoV-2 N gene from contrived samples.
a Viral particle temperature lysis determination. AccuPlex packaged SARS-CoV-2 virus was diluted into TCEP buffer and heated for 5 min at the given temperature (see “Methods” section). Released RNA was amplified by eRPA and product formation was quantified by qPCR. b Detection of RNase activity of VTM. RNaseAlert was added to viral transport media (VTM) with or without the addition of RNasin Plus before heating for 5 min at 94 °C or added to a 1:1 VTM and viral lysis buffer mix and incubating for 10 min at 25 °C. Data represent the average of four technical replicates and were determined by normalizing the fluorescence intensity 10 min after the heating step to a fully degraded control. c Schematic of sample processing of patient samples in VTM for input into eRPA. d Heatmap displaying eRPA test calls for detection of AccuPlex packaged SARS-CoV-2 lysed with conditions displayed in c. AccuPlex packaged SARS-CoV-2 virus was mixed 1:1 with VTM, PBS, or viral lysis buffer and incubated as shown. All samples included RNasin Plus. Values represent the number of positive test calls: number of negative test calls for each condition. e Inactivation of RNase activity in saliva by TCEP and heat. Saliva was first mixed 1:1 with a buffer containing 1 mM (black diamonds) or 100 mM (red triangles) TCEP and heated at the indicated temperature for 5 min. After cooling, RNaseAlert was added and degradation was assessed as in b. f The combined activities of an RNase inhibitor and TCEP protect RNA from degradation in saliva. RNaseAlert was added to saliva diluted 1:1 with TCEP buffer containing an RNase inhibitor and treated as shown. RNAseAlert degradation was assessed an in b. See additional data in Supplementary Fig. 3g. g Schematic of sample processing of patient saliva samples for input into eRPA. h Heatmap displaying eRPA test calls for detection of SARS-CoV-2 RNA or AccuPlex packaged virus from saliva treated as displayed in g. AccuPlex packaged SARS-CoV-2 virus or SARS-CoV-2 N gene IVT RNA were added to saliva and extracted as shown. Values represent the number of positive test calls: number of negative test calls for each condition. Each experiment was repeated three times with similar results. Source data are available in the Source Data file.
Fig. 4
Fig. 4. Detection of SARS-CoV-2 in clinical samples using eRPA.
a Schematic of the workflow for benchmarking eRPA against RT-qPCR using patient samples. b Sampling of lateral flow strip readouts of SARS-CoV-2 N gene eRPA tests of unextracted (top) or extracted (bottom) patient samples (n = 7 biologically independent samples) of known infection status. Unextracted patient samples were run in duplicates both by eRPA (calls of positive (+) or negative (−) were made within 20 min of detection) and by one-step RT-qPCR (Ct values shown). See additional data in Supplementary Fig. 4a. RNA was extracted from clinical samples according to standard procedure (see “Methods” section) and was subsequently used as input to eRPA and RT-qPCR. See additional data in Supplementary Fig. 4b. c Summary of eRPA test results of patient samples (n = 51 biologically independent samples) and comparison to RT-qPCR. The y axis represents patient viral titer determined using a commercial one-step RT-qPCR assay from unextracted samples or extracted RNA samples with a standard curve. d (Left) Matched RT-qPCR Ct values of unextracted and extracted patient samples (n = 26 biologically independent samples) (Right) Difference between extracted and unextracted Ct values for all patients (n = 26 biologically independent samples) with mean value of 1.6 fold +/− 1.7 SD. Source data are available in the Source Data file.

Update of

Similar articles

Cited by

References

    1. Dong E, Du H, Gardner L. An interactive web-based dashboard to track COVID-19 in real time. Lancet Infect. Dis. 2020;20:533–534. doi: 10.1016/S1473-3099(20)30120-1. - DOI - PMC - PubMed
    1. Park, A. Dr. Anthony Fauci “not overly confident” with U.S. COVID-19 testing capabilities. time.comanthony-fauci-covid–testing-capabilities. Accessed 24 May 2020.
    1. Temple, J. Why contact tracing may be a mess in America. Accessed 24 May 2020.
    1. Vogels, C. B. F. et al. SalivaDirect: A simplified and flexible platform to enhance SARS-CoV-2 testing capacity. medRxiv. 10.1101/2020.08.03.20167791 (2020). - PMC - PubMed
    1. Srivatsan, S. et al. Preliminary support for a ‘dry swab, extraction free’ protocol for SARS-CoV-2 testing via RT-qPCR. bioRxiv10.1101/2020.04.22.056283 (2020).

Publication types

MeSH terms