Technical validation of a new microfluidic device for enrichment of CTCs from large volumes of blood by using buffy coats to mimic diagnostic leukapheresis products
- PMID: 33219265
- PMCID: PMC7680114
- DOI: 10.1038/s41598-020-77227-3
Technical validation of a new microfluidic device for enrichment of CTCs from large volumes of blood by using buffy coats to mimic diagnostic leukapheresis products
Abstract
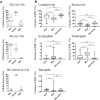
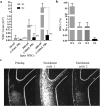
Diagnostic leukapheresis (DLA) enables to sample larger blood volumes and increases the detection of circulating tumor cells (CTC) significantly. Nevertheless, the high excess of white blood cells (WBC) of DLA products remains a major challenge for further downstream CTC enrichment and detection. To address this problem, we tested the performance of two label-free CTC technologies for processing DLA products. For the testing purposes, we established ficollized buffy coats (BC) with a WBC composition similar to patient-derived DLA products. The mimicking-DLA samples (with up to 400 × 106 WBCs) were spiked with three different tumor cell lines and processed with two versions of a spiral microfluidic chip for label-free CTC enrichment: the commercially available ClearCell FR1 biochip and a customized DLA biochip based on a similar enrichment principle, but designed for higher throughput of cells. While the samples processed with FR1 chip displayed with increasing cell load significantly higher WBC backgrounds and decreasing cell recovery, the recovery rates of the customized DLA chip were stable, even if challenged with up to 400 × 106 WBCs (corresponding to around 120 mL peripheral blood or 10% of a DLA product). These results indicate that the further up-scalable DLA biochip has potential to process complete DLA products from 2.5 L of peripheral blood in an affordable way to enable high-volume CTC-based liquid biopsies.
Conflict of interest statement
Z. Lai is an employee of Biolidics Ltd (Singapore). Z.Lai and A. A. S. Bhagat are shareholders of Biolidics Ltd (Singapore). The remaining authors R. Guglielmi, K. Raba, G. van Dalum, J. Wu, B. Behrens, W.T. Knoefel, R. P. L. Neves and N. H. Stoecklein declare no conflict of interest.
Figures


Similar articles
-
Diagnostic leukapheresis for CTC analysis in breast cancer patients: CTC frequency, clinical experiences and recommendations for standardized reporting.Cytometry A. 2018 Dec;93(12):1213-1219. doi: 10.1002/cyto.a.23669. Cytometry A. 2018. PMID: 30551262
-
Ultra-sensitive CTC-based liquid biopsy for pancreatic cancer enabled by large blood volume analysis.Mol Cancer. 2023 Nov 13;22(1):181. doi: 10.1186/s12943-023-01880-1. Mol Cancer. 2023. PMID: 37957606 Free PMC article.
-
Label-Free Enrichment and Molecular Characterization of Viable Circulating Tumor Cells from Diagnostic Leukapheresis Products.Clin Chem. 2019 Apr;65(4):549-558. doi: 10.1373/clinchem.2018.296814. Epub 2019 Feb 8. Clin Chem. 2019. PMID: 30737205
-
Challenges for CTC-based liquid biopsies: low CTC frequency and diagnostic leukapheresis as a potential solution.Expert Rev Mol Diagn. 2016;16(2):147-64. doi: 10.1586/14737159.2016.1123095. Epub 2015 Dec 16. Expert Rev Mol Diagn. 2016. PMID: 26587751 Review.
-
Microfluidic-Based Technologies for CTC Isolation: A Review of 10 Years of Intense Efforts towards Liquid Biopsy.Int J Mol Sci. 2022 Feb 10;23(4):1981. doi: 10.3390/ijms23041981. Int J Mol Sci. 2022. PMID: 35216097 Free PMC article. Review.
Cited by
-
Label-free separation of neuroblastoma patient-derived xenograft (PDX) cells from hematopoietic progenitor cell products by acoustophoresis.Stem Cell Res Ther. 2021 Oct 15;12(1):542. doi: 10.1186/s13287-021-02612-2. Stem Cell Res Ther. 2021. PMID: 34654486 Free PMC article.
-
Magnetic-Based Enrichment of Rare Cells from High Concentrated Blood Samples.Cancers (Basel). 2020 Apr 10;12(4):933. doi: 10.3390/cancers12040933. Cancers (Basel). 2020. PMID: 32290064 Free PMC article.
-
Microfluidics for the Isolation and Detection of Circulating Tumor Cells.Adv Exp Med Biol. 2022;1379:389-412. doi: 10.1007/978-3-031-04039-9_16. Adv Exp Med Biol. 2022. PMID: 35761001
-
Microfluidic Blood Separation: Key Technologies and Critical Figures of Merit.Micromachines (Basel). 2023 Nov 18;14(11):2117. doi: 10.3390/mi14112117. Micromachines (Basel). 2023. PMID: 38004974 Free PMC article. Review.
References
-
- de Bono, J. S. et al. Circulating tumor cells predict survival benefit from treatment in metastatic castration-resistant prostate cancer editorial comment. J Urol.181, 2535–2536 (2009). - PubMed
-
- Cohen SJ, et al. Circulating endothelial cells (CEC) and circulating tumor cells (CTC) in patients (pts) with metastatic colorectal cancer (mCRC) J. Clin. Oncol. 2006;24:153s–153s.
Publication types
MeSH terms
LinkOut - more resources
Full Text Sources
Medical

