

Role of RPTPβ/ζ in neuroinflammation and microglia-neuron communication
- PMID: 33219280
- PMCID: PMC7679445
- DOI: 10.1038/s41598-020-76415-5
Role of RPTPβ/ζ in neuroinflammation and microglia-neuron communication
Abstract
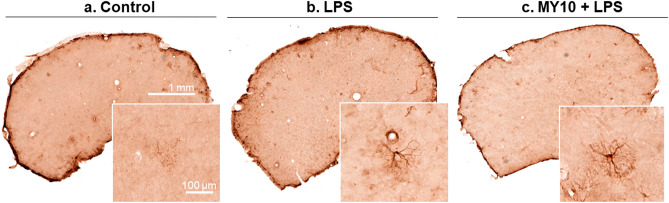
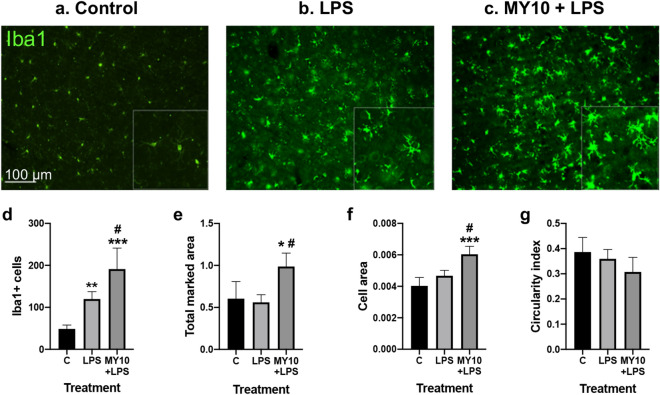
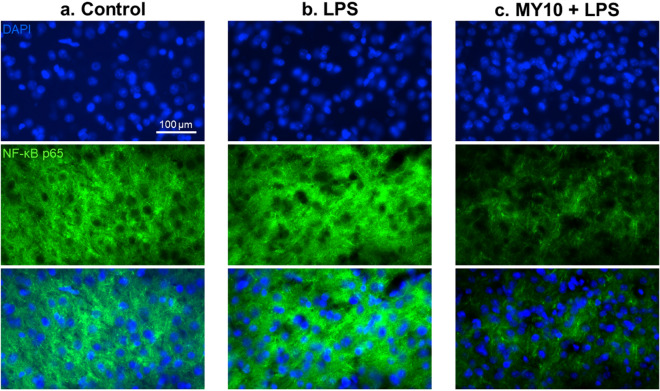
Pleiotrophin (PTN) is a cytokine that is upregulated in different neuroinflammatory disorders. Using mice with transgenic PTN overexpression in the brain (Ptn-Tg), we have found a positive correlation between iNos and Tnfα mRNA and Ptn mRNA levels in the prefrontal cortex (PFC) of LPS-treated mice. PTN is an inhibitor of Receptor Protein Tyrosine Phosphatase (RPTP) β/ζ, which is mainly expressed in the central nervous system. We aimed to test if RPTPβ/ζ is involved in the modulation of neuroinflammatory responses using specific inhibitors of RPTPβ/ζ (MY10 and MY33-3). Treatment with MY10 potentiated LPS-induced microglial responses in the mouse PFC. Surprisingly, MY10 caused a decrease in LPS-induced NF-κB p65 expression, suggesting that RPTPβ/ζ may be involved in a novel mechanism of potentiation of microglial activation independent of the NF-κB p65 pathway. MY33-3 and MY10 limited LPS-induced nitrites production and iNos increases in BV2 microglial cells. SH-SY5Y neuronal cells were treated with the conditioned media from MY10/LPS-treated BV2 cells. Conditioned media from non-stimulated and from LPS-stimulated BV2 cells increased the viability of SH-SY5Y cultures. RPTPβ/ζ inhibition in microglial cells disrupted this neurotrophic effect of microglia, suggesting that RPTPβ/ζ plays a role in the neurotrophic phenotype of microglia and in microglia-neuron communication.
Conflict of interest statement
The authors declare no competing interests.
Figures


Similar articles
-
Role of Receptor Protein Tyrosine Phosphatase β/ζ in Neuron-Microglia Communication in a Cellular Model of Parkinson's Disease.Int J Mol Sci. 2021 Jun 22;22(13):6646. doi: 10.3390/ijms22136646. Int J Mol Sci. 2021. PMID: 34206170 Free PMC article.
-
Inhibition of RPTPβ/ζ blocks ethanol-induced conditioned place preference in pleiotrophin knockout mice.Behav Brain Res. 2019 Sep 2;369:111933. doi: 10.1016/j.bbr.2019.111933. Epub 2019 May 1. Behav Brain Res. 2019. PMID: 31054277
-
Pharmacological inhibition of Receptor Protein Tyrosine Phosphatase β/ζ (PTPRZ1) modulates behavioral responses to ethanol.Neuropharmacology. 2018 Jul 15;137:86-95. doi: 10.1016/j.neuropharm.2018.04.027. Epub 2018 May 9. Neuropharmacology. 2018. PMID: 29753117 Free PMC article.
-
Anaplastic lymphoma kinase: "Ligand Independent Activation" mediated by the PTN/RPTPβ/ζ signaling pathway.Biochim Biophys Acta. 2013 Oct;1834(10):2219-23. doi: 10.1016/j.bbapap.2013.06.004. Epub 2013 Jun 15. Biochim Biophys Acta. 2013. PMID: 23777859 Review.
-
Pleiotrophin and its receptor protein tyrosine phosphatase beta/zeta as regulators of angiogenesis and cancer.Biochim Biophys Acta. 2016 Dec;1866(2):252-265. doi: 10.1016/j.bbcan.2016.09.007. Epub 2016 Sep 29. Biochim Biophys Acta. 2016. PMID: 27693125 Review.
Cited by
-
Soybean oil induces neuroinflammatory response through brain-gut axis under high-fat diet.J Tradit Complement Med. 2024 Feb 29;14(5):522-533. doi: 10.1016/j.jtcme.2024.02.002. eCollection 2024 Sep. J Tradit Complement Med. 2024. PMID: 39262663 Free PMC article.
-
Hereditable variants of classical protein tyrosine phosphatase genes: Will they prove innocent or guilty?Front Cell Dev Biol. 2023 Jan 23;10:1051311. doi: 10.3389/fcell.2022.1051311. eCollection 2022. Front Cell Dev Biol. 2023. PMID: 36755664 Free PMC article. Review.
-
Implication of the PTN/RPTPβ/ζ Signaling Pathway in Acute Ethanol Neuroinflammation in Both Sexes: A Comparative Study with LPS.Biomedicines. 2023 Apr 28;11(5):1318. doi: 10.3390/biomedicines11051318. Biomedicines. 2023. PMID: 37238989 Free PMC article.
-
Role of Receptor Protein Tyrosine Phosphatase β/ζ in Neuron-Microglia Communication in a Cellular Model of Parkinson's Disease.Int J Mol Sci. 2021 Jun 22;22(13):6646. doi: 10.3390/ijms22136646. Int J Mol Sci. 2021. PMID: 34206170 Free PMC article.
-
A dual role for pleiotrophin in modulating inflammation and myelination in the presence of chondroitin sulfate proteoglycans after nervous system injury.Front Cell Neurosci. 2025 Feb 27;19:1549433. doi: 10.3389/fncel.2025.1549433. eCollection 2025. Front Cell Neurosci. 2025. PMID: 40083634 Free PMC article.
References
Publication types
MeSH terms
Substances
LinkOut - more resources
Full Text Sources
Molecular Biology Databases
Miscellaneous
