. 2021 Jun;30(12):2724-2737.
doi: 10.1111/mec.15743. Epub 2020 Dec 7.

The strength and form of natural selection on transcript abundance in the wild

Affiliations

The strength and form of natural selection on transcript abundance in the wild

Freed Ahmad et al. Mol Ecol. 2021 Jun.

Abstract

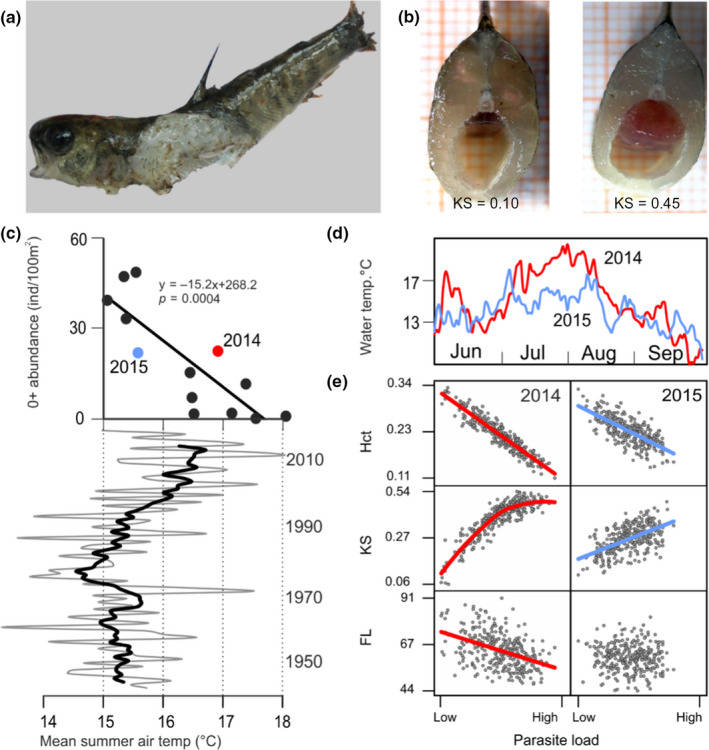
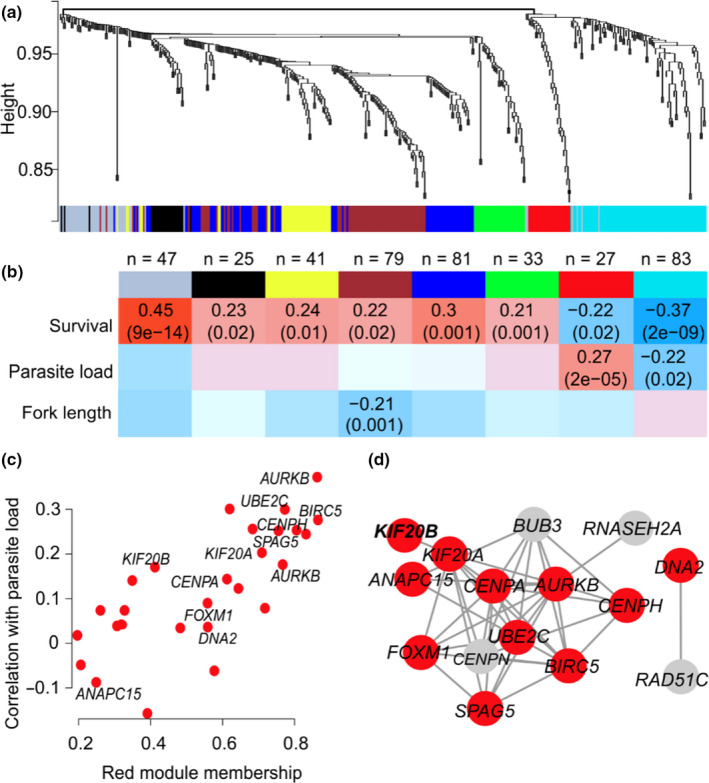
Gene transcription variation is known to contribute to disease susceptibility and adaptation, but we currently know very little about how contemporary natural selection shapes transcript abundance. Here, we propose a novel analytical framework to quantify the strength and form of ongoing natural selection at the transcriptome level in a wild vertebrate. We estimated selection on transcript abundance in a cohort of a wild salmonid fish (Salmo trutta) affected by an extracellular myxozoan parasite (Tetracapsuloides bryosalmonae) through mark-recapture field sampling and the integration of RNA-sequencing with classical regression-based selection analysis. We show, based on fin transcriptomes of the host, that infection by the parasite and subsequent host survival is linked to upregulation of mitotic cell cycle process. We also detect a widespread signal of disruptive selection on transcripts linked to host immune defence, host-pathogen interactions, cellular repair and maintenance. Our results provide insights into how selection can be measured at the transcriptome level to dissect the molecular mechanisms of contemporary evolution driven by climate change and emerging anthropogenic threats. We anticipate that the approach described here will enable critical information on the molecular processes and targets of natural selection to be obtained in real time.

Keywords: climate change; contemporary natural selection; gene expression; host-parasite relationships; selection differential and gradient.


Figures

FIGURE 1
FIGURE 1
Temperature dependence of PKD in wild trout. (a) Dead young‐of‐the‐year brown trout found in the Altja river with putative PKD‐associated death symptoms (swollen kidney, a widely opened mouth and flared gills suggestive of anaemia). (b) Body section of trout with normal (left) and swollen (right) kidney. (c) Effect of temperature on juvenile trout abundance during 2005–2017 in the Altja river in relation to average summer air temperature (7‐year moving average mean summer air temperature over 73 years is highlighted in bold). (d) Water temperature variation over a 4‐month period in 2014 (red) and 2015 (blue) in the Altja river. (e) Relationships between parasite load (PL) and fork length (FL), kidney swollenness (KS) and haematocrit (Hct) in 2014 and 2015. All plotted relationships (model‐based regression lines; individual points based on the model output) are significant (p < .001), except FL versus PL in 2015 (p = .933)
FIGURE 2
FIGURE 2
Transcriptome responses in relation to parasite load and corrected survival. (a) Density distribution of the first discriminant scores corresponding to low, intermediate and high PLs (black, dark grey and light grey areas, respectively). (b) Density distribution of the first discriminant scores corresponding to survivors and nonsurvivors (light grey and black areas, respectively). (c) Proportion of genes involved in mitotic cell cycle presented as a heatmap. The inserted histograms reflect excess transcripts associated with PL and survival. Contours reflect the density of individual transcripts. (d,e) Protein–protein interaction (PPI) network with transcripts positively correlated with PL (d) and survival (e). Mitotic cell cycle genes (GO:0000278) within the PPI networks are shown as red circles. The overlap between parasite load (PL) and survival (CS) are shown in the inserted Venn diagram
FIGURE 3
FIGURE 3
Weighted gene co‐expression network analysis (WGCNA) of survival genes and their relationship with parasite load. (a) Gene dendrogram with the corresponding seven modules. Each colour represents a module with highly connected genes. (b) Relationships of module eigengenes and survival, parasite load (PL) and fork length (FL). The numbers in the table represent the Pearson correlation coefficients between the corresponding module eigengene and trait, with the p‐values in parentheses. (c) Module membership of the red module genes and the corresponding Pearson correlation coefficients with parasite load. (d) Protein–protein network of the red module genes involved in the mitotic cell cycle (GO:0000278) shown as red circles
FIGURE 4
FIGURE 4
Strength of survival selection on 18,717 transcripts and published phenotypic traits. (a) Linear selection differentials s. (b) Quadratic selection differentials λ. Differentials for transcripts and published phenotypic traits (Siepielski et al., 2017) are shown as dark and light grey histograms, respectively. Negative and positive λ values reflect stabilizing and disruptive selection, respectively. Estimates <−0.75 were assigned a value of −0.75, and estimates >0.75 were assigned a value of 0.75. Selection differentials for the WGCNA gene modules are shown as coloured pins. The inserted figures illustrate the relationships between survival and module eigengenes as cubic spline (Schluter, 1988) functions (95% CI in grey) for the red and brown modules; short insert lines reflect individual data. The inserted boxplot illustrates total selection as measured by the distributional selection differential (DSD; Henshaw & Zemel, 2016), which is broken down into components representing selection on the trait mean (dD = |s|) and selection on the shape of the trait distribution (dN). The line across the box represents the median; the box edges represent the upper and lower quartiles; the whiskers extend to a maximum of 1.5× interquartile range beyond the box; and the points represent outliers
FIGURE 5
FIGURE 5
The distribution of linear and quadratic selection differentials. (a) Linear selection differentials. (b) Quadratic selection differentials. The black line corresponds to observed data, and grey lines represent 1000 randomizations (no selection)

Comment in

References

    1. Arnold, S. J. (1983). Morphology, performance and fitness. American Zoologist, 23(2), 347–361. 10.1093/icb/23.2.347 - DOI
    1. Baumgart, M. , Priebe, S. , Groth, M. , Hartmann, N. , Menzel, U. , Pandolfini, L. , Koch, P. , Felder, M. , Ristow, M. , Englert, C. , Guthke, R. , Platzer, M. , & Cellerino, A. (2016). Longitudinal RNA‐seq analysis of vertebrate aging identifies mitochondrial complex I as a small‐molecule‐sensitive modifier of lifespan. Cell Systems, 2(2), 122–132. 10.1016/J.CELS.2016.01.014 - DOI - PubMed
    1. Bettge, K. , Segner, H. , Burki, R. , Schmidt‐Posthaus, H. , & Wahli, T. (2009). Proliferative kidney disease (PKD) of rainbow trout: Temperature‐ and time‐related changes of Tetracapsuloides bryosalmonae DNA in the kidney. Parasitology, 136(06), 615. 10.1017/s0031182009005800 - DOI - PubMed
    1. Bishop, S. C. , Doeschl‐Wilson, A. , & Woolliams, J. A. (2012). Uses and implications of field disease data for livestock genomic and genetics studies. Frontiers in Genetics, 3, 1–5. 10.3389/fgene.2012.00114 - DOI - PMC - PubMed
    1. Bolger, A. M. , Lohse, M. , & Usadel, B. (2014). Trimmomatic: A flexible trimmer for illumina sequence data. Bioinformatics, 30(15), 2114–2120. 10.1093/bioinformatics/btu170 - DOI - PMC - PubMed

Publication types