

Does insufficient sleep affect how you learn from reward or punishment? Reinforcement learning after 2 nights of sleep restriction
- PMID: 33219629
- PMCID: PMC8365707
- DOI: 10.1111/jsr.13236
Does insufficient sleep affect how you learn from reward or punishment? Reinforcement learning after 2 nights of sleep restriction
Abstract
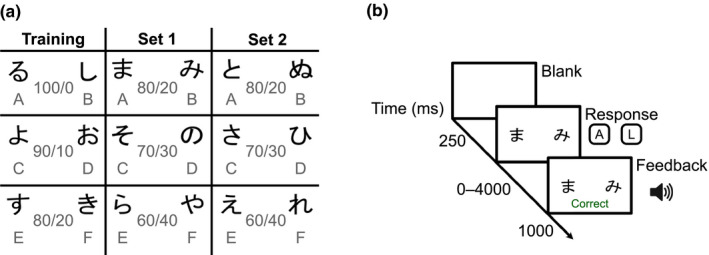
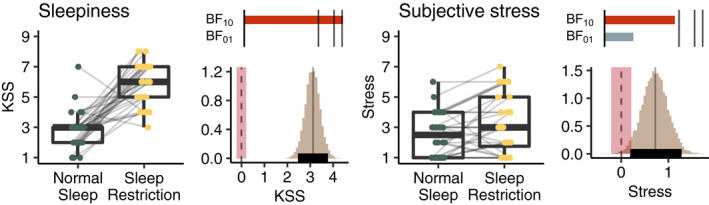
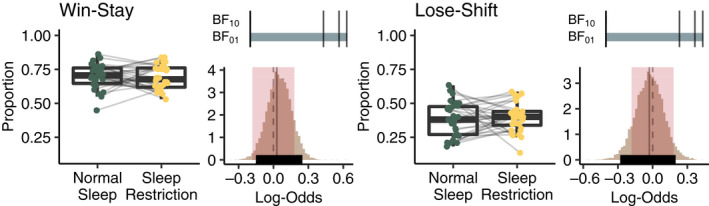
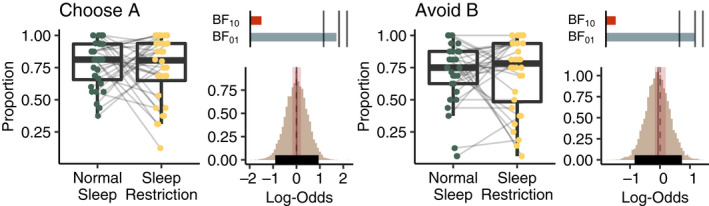
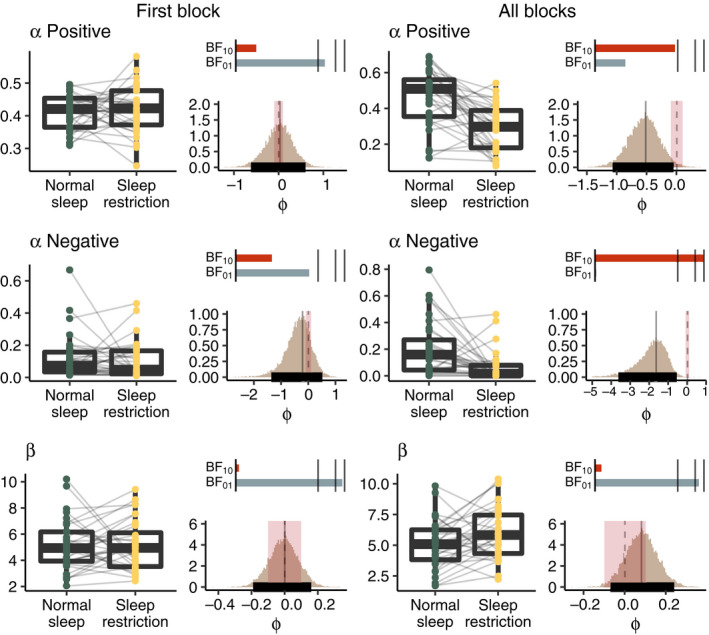
To learn from feedback (trial and error) is essential for all species. Insufficient sleep has been found to reduce the sensitivity to feedback as well as increase reward sensitivity. To determine whether insufficient sleep alters learning from positive and negative feedback, healthy participants (n = 32, mean age 29.0 years, 18 women) were tested once after normal sleep (8 hr time in bed for 2 nights) and once after 2 nights of sleep restriction (4 hr/night) on a probabilistic selection task where learning behaviour was evaluated in three ways: as generalised learning, short-term win-stay/lose-shift learning strategies, and trial-by-trial learning rate. Sleep restriction did not alter the sensitivity to either positive or negative feedback on generalised learning. Also, short-term win-stay/lose-shift strategies were not affected by sleep restriction. Similarly, results from computational models that assess the trial-by-trial update of stimuli value demonstrated no difference between sleep conditions after the first block. However, a slower learning rate from negative feedback when evaluating all learning blocks was found after sleep restriction. Despite a marked increase in sleepiness and slowed learning rate for negative feedback, sleep restriction did not appear to alter strategies and generalisation of learning from positive or negative feedback.
Keywords: carrot or stick; feedback-based learning; lack of sleep; reward or punishment; sleep deprivation; valanced feedback.
© 2020 The Authors. Journal of Sleep Research published by John Wiley & Sons Ltd on behalf of European Sleep Research Society.
Conflict of interest statement
The authors declare no competing interests.
Figures
Similar articles
-
The influence of trial order on learning from reward vs. punishment in a probabilistic categorization task: experimental and computational analyses.Front Behav Neurosci. 2015 Jul 24;9:153. doi: 10.3389/fnbeh.2015.00153. eCollection 2015. Front Behav Neurosci. 2015. PMID: 26257616 Free PMC article.
-
Altered learning from positive feedback in adolescents with anorexia nervosa.J Int Neuropsychol Soc. 2024 Aug;30(7):651-659. doi: 10.1017/S1355617724000237. Epub 2024 Sep 18. J Int Neuropsychol Soc. 2024. PMID: 39291440 Free PMC article.
-
Dissociable feedback valence effects on frontal midline theta during reward gain versus threat avoidance learning.Psychophysiology. 2023 May;60(5):e14235. doi: 10.1111/psyp.14235. Epub 2022 Dec 18. Psychophysiology. 2023. PMID: 36529988
-
Reinforcement learning deficits in people with schizophrenia persist after extended trials.Psychiatry Res. 2014 Dec 30;220(3):760-4. doi: 10.1016/j.psychres.2014.08.013. Epub 2014 Aug 15. Psychiatry Res. 2014. PMID: 25172610 Free PMC article.
-
Reward positivity: Reward prediction error or salience prediction error?Psychophysiology. 2016 Aug;53(8):1185-92. doi: 10.1111/psyp.12673. Epub 2016 May 17. Psychophysiology. 2016. PMID: 27184070 Review.
References
-
- Åkerstedt, T., & Gillberg, M. (1990). Subjective and objective sleepiness in the active individual. The International Journal of Neuroscience, 1, 29–37. - PubMed
-
- Elmenhorst, D., Elmenhorst, E. M., Hennecke, E., Kroll, T., Matusch, A., Aeschbach, D., & Bauer, A. (2017). Recovery sleep after extended wakefulness restores elevated A1 adenosine receptor availability in the human brain. Proceedings of the National Academy of Sciences of the United States of America, 114, 4243–4248. - PMC - PubMed
-
- Frank, M. J. (2004). By carrot or by stick: Cognitive reinforcement learning in parkinsonism. Science, 306, 1940–1943. - PubMed
MeSH terms
LinkOut - more resources
Full Text Sources
Miscellaneous
