

Iron accumulation in the choroid plexus, ependymal cells and CNS parenchyma in a rat strain with low-grade haemolysis of fragile macrocytic red blood cells
- PMID: 33220123
- PMCID: PMC8018038
- DOI: 10.1111/bpa.12920
Iron accumulation in the choroid plexus, ependymal cells and CNS parenchyma in a rat strain with low-grade haemolysis of fragile macrocytic red blood cells
Abstract
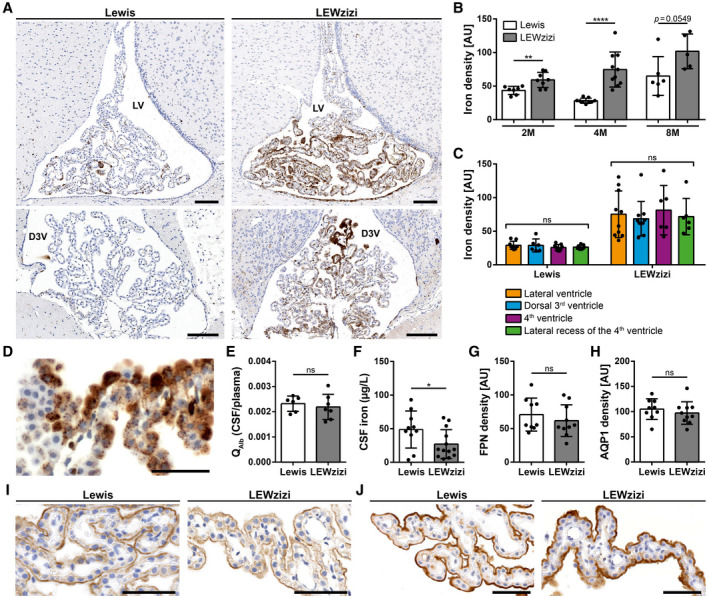
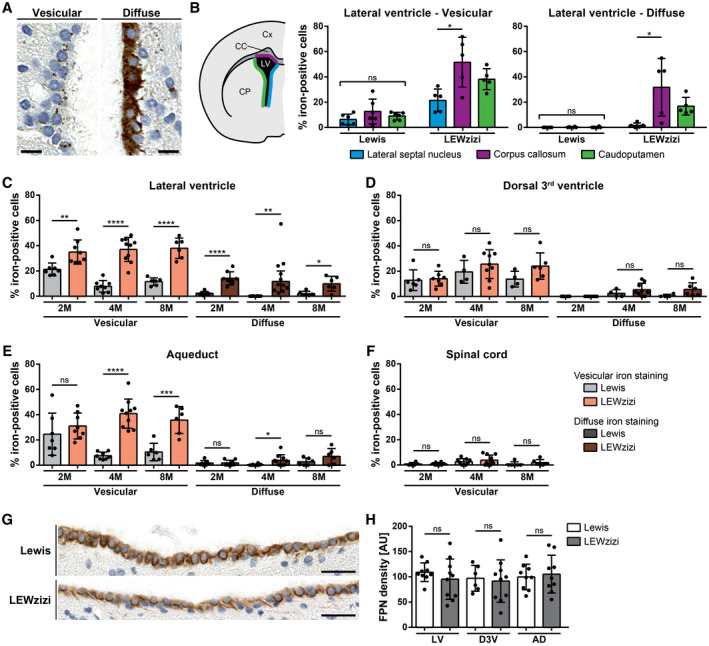
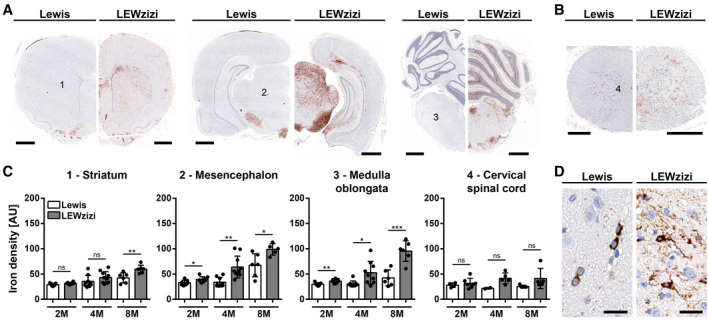
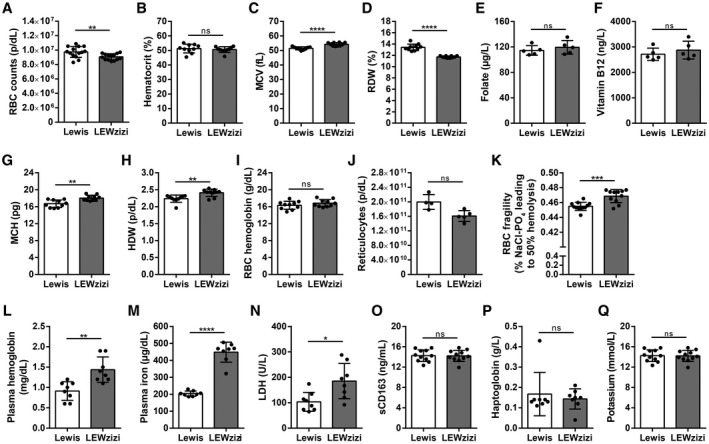
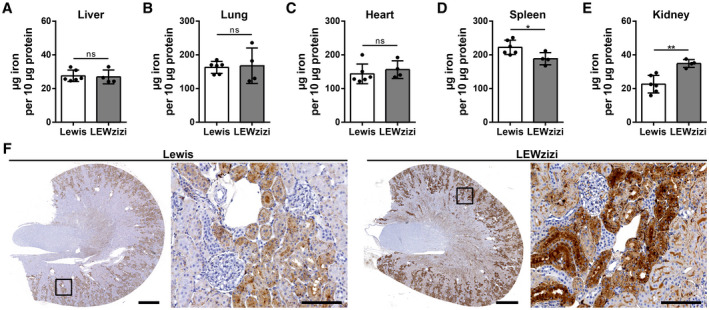
Iron accumulation in the CNS is associated with many neurological diseases via amplification of inflammation and neurodegeneration. However, experimental studies on iron overload are challenging, since rodents hardly accumulate brain iron in contrast to humans. Here, we studied LEWzizi rats, which present with elevated CNS iron loads, aiming to characterise choroid plexus, ependymal, CSF and CNS parenchymal iron loads in conjunction with altered blood iron parameters and, thus, signifying non-classical entry sites for iron into the CNS. Non-haem iron in formalin-fixed paraffin-embedded tissue was detected via DAB-enhanced Turnbull Blue stainings. CSF iron levels were determined via atomic absorption spectroscopy. Ferroportin and aquaporin-1 expression was visualised using immunohistochemistry. The analysis of red blood cell indices and serum/plasma parameters was based on automated measurements; the fragility of red blood cells was manually determined by the osmotic challenge. Compared with wild-type animals, LEWzizi rats showed strongly increased iron accumulation in choroid plexus epithelial cells as well as in ependymal cells of the ventricle lining. Concurrently, red blood cell macrocytosis, low-grade haemolysis and significant haemoglobin liberation from red blood cells were apparent in the peripheral blood of LEWzizi rats. Interestingly, elevated iron accumulation was also evident in kidney proximal tubules, which share similarities with the blood-CSF barrier. Our data underscore the importance of iron gateways into the CNS other than the classical route across microvessels in the CNS parenchyma. Our findings of pronounced choroid plexus iron overload in conjunction with peripheral iron overload and increased RBC fragility in LEWzizi rats may be seminal for future studies of human diseases, in which similar constellations are found.
Keywords: cerebrospinal fluid; erythrocyte osmotic fragility; iron overload; kidney proximal tubule; multiple sclerosis; zitter rat.
© 2020 The Authors. Brain Pathology published by John Wiley & Sons Ltd on behalf of International Society of Neuropathology.
Conflict of interest statement
SHa received speaker's honoraria from Biogen, Sanofi Aventis and unrestricted research grant from Merck. HL received honoraria for lectures from Novartis, Biogen and Sanofi Aventis. Moreover, he is a member of advisory boards at Roche and Medday. TB received personal fees from pharmaceutical companies marketing drugs for multiple sclerosis. The other authors declare no competing financial or non‐financial interests specific to this study.
Figures
Similar articles
-
Cardiotrophin-1 in choroid plexus and the cerebrospinal fluid circulatory system.Neuroscience. 2004;127(1):43-52. doi: 10.1016/j.neuroscience.2004.03.065. Neuroscience. 2004. PMID: 15219667
-
Pathogenic implications of cerebrospinal fluid barrier pathology in neuromyelitis optica.Acta Neuropathol. 2017 Apr;133(4):597-612. doi: 10.1007/s00401-017-1682-1. Epub 2017 Feb 9. Acta Neuropathol. 2017. PMID: 28184993 Free PMC article.
-
Brain iron homeostasis.Dan Med Bull. 2002 Nov;49(4):279-301. Dan Med Bull. 2002. PMID: 12553165 Review.
-
Phorbol ester induced changes in tight and adherens junctions in the choroid plexus epithelium and in the ependyma.Brain Res. 2000 Jan 31;854(1-2):197-206. doi: 10.1016/s0006-8993(99)02355-0. Brain Res. 2000. PMID: 10784122
-
Involvement of the choroid plexus in central nervous system inflammation.Microsc Res Tech. 2001 Jan 1;52(1):112-29. doi: 10.1002/1097-0029(20010101)52:1<112::AID-JEMT13>3.0.CO;2-5. Microsc Res Tech. 2001. PMID: 11135454 Review.
Cited by
-
Roles of Ependymal Cells in the Physiology and Pathology of the Central Nervous System.Aging Dis. 2023 Apr 1;14(2):468-483. doi: 10.14336/AD.2022.0826-1. eCollection 2023 Apr 1. Aging Dis. 2023. PMID: 37008045 Free PMC article. Review.
-
Multiciliated ependymal cells: an update on biology and pathology in the adult brain.Acta Neuropathol. 2024 Sep 10;148(1):39. doi: 10.1007/s00401-024-02784-0. Acta Neuropathol. 2024. PMID: 39254862 Review.
-
Pathogenic role of autoantibodies at the ependyma in autoimmune disorders of the central nervous system.Front Cell Neurosci. 2023 Sep 13;17:1257000. doi: 10.3389/fncel.2023.1257000. eCollection 2023. Front Cell Neurosci. 2023. PMID: 37771929 Free PMC article.
-
Peripheral Hemolysis in Relation to Iron Rim Presence and Brain Volume in Multiple Sclerosis.Front Neurol. 2022 Jun 29;13:928582. doi: 10.3389/fneur.2022.928582. eCollection 2022. Front Neurol. 2022. PMID: 35865643 Free PMC article.
-
Iron homeostasis and post-hemorrhagic hydrocephalus: a review.Front Neurol. 2024 Jan 12;14:1287559. doi: 10.3389/fneur.2023.1287559. eCollection 2023. Front Neurol. 2024. PMID: 38283681 Free PMC article. Review.
References
-
- Crichton RR, Dexter DT, Ward RJ. Brain iron metabolism and its perturbation in neurological diseases. J Neural Transm. 2011;118(3):301–14. - PubMed
-
- Sánchez M, Sabio L, Gálvez N, Capdevila M, Dominguez‐Vera JM. Iron chemistry at the service of life. IUBMB Life. 2017;69(6):382–8. - PubMed
-
- Todorich B, Pasquini JM, Garcia CI, Paez PM, Connor JR. Oligodendrocytes and myelination: the role of iron. Glia. 2009;57(5):467–78. - PubMed
-
- Kehrer JP. The Haber‐Weiss reaction and mechanisms of toxicity. Toxicology. 2000;149(1):43–50. - PubMed
-
- Moos T, Nielsen TR, Skjørringe T, Morgan EH. Iron trafficking inside the brain. J Neurochem. 2007;103(5):1730–40. - PubMed
Publication types
MeSH terms
Substances
Grants and funding
LinkOut - more resources
Full Text Sources
Other Literature Sources
Medical
