. 2021 Feb;185(2):401-412.
doi: 10.1002/ajmg.a.61974. Epub 2020 Nov 21.

Clinical charts for surveillance of growth and body proportion development in achondroplasia and examples of their use

Affiliations

Clinical charts for surveillance of growth and body proportion development in achondroplasia and examples of their use

Luitgard Neumeyer et al. Am J Med Genet A. 2021 Feb.

Abstract

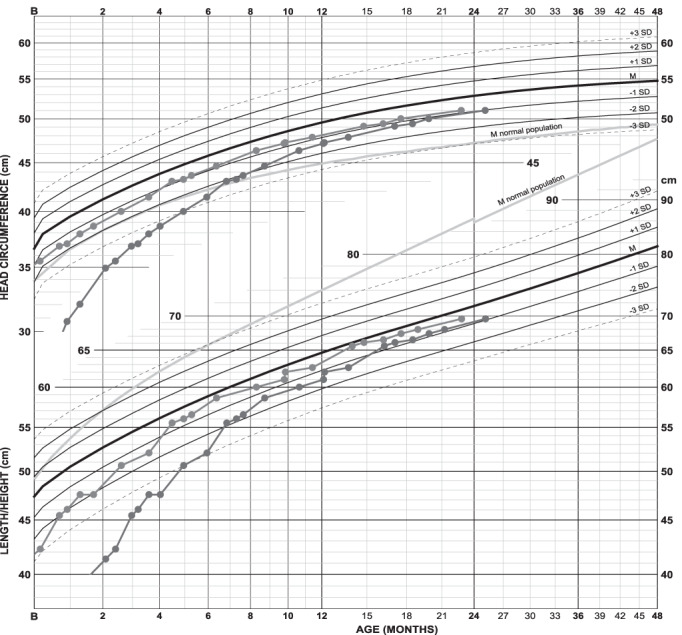
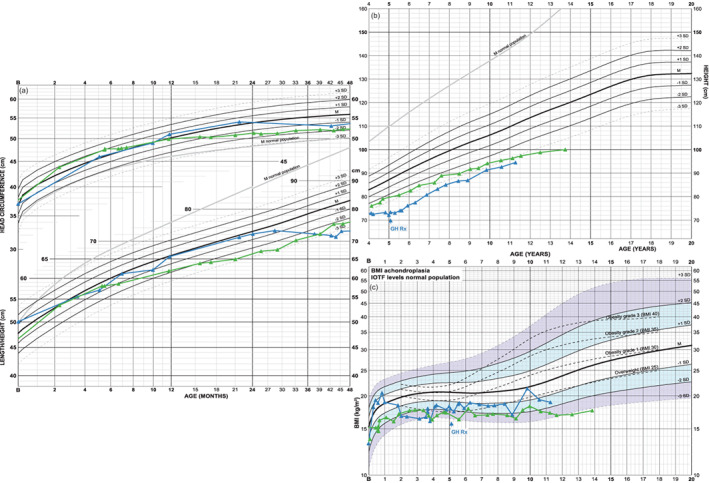
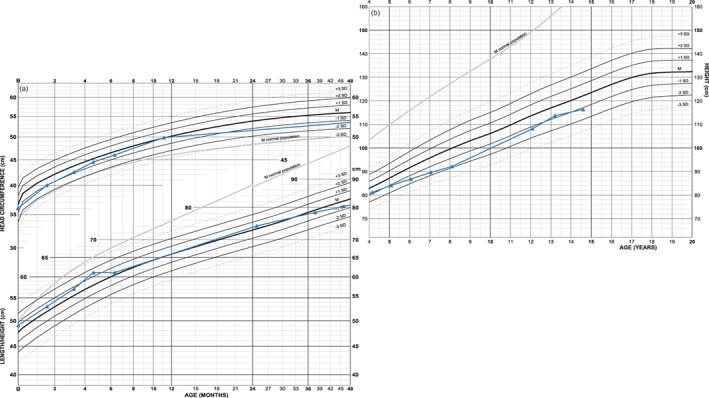
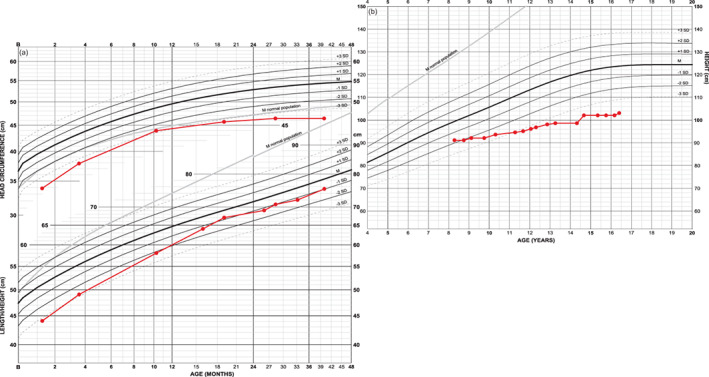
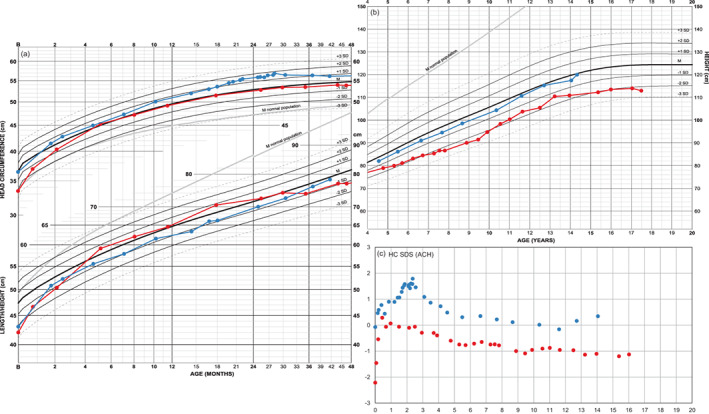
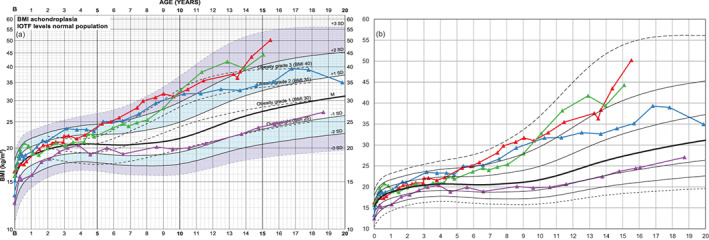
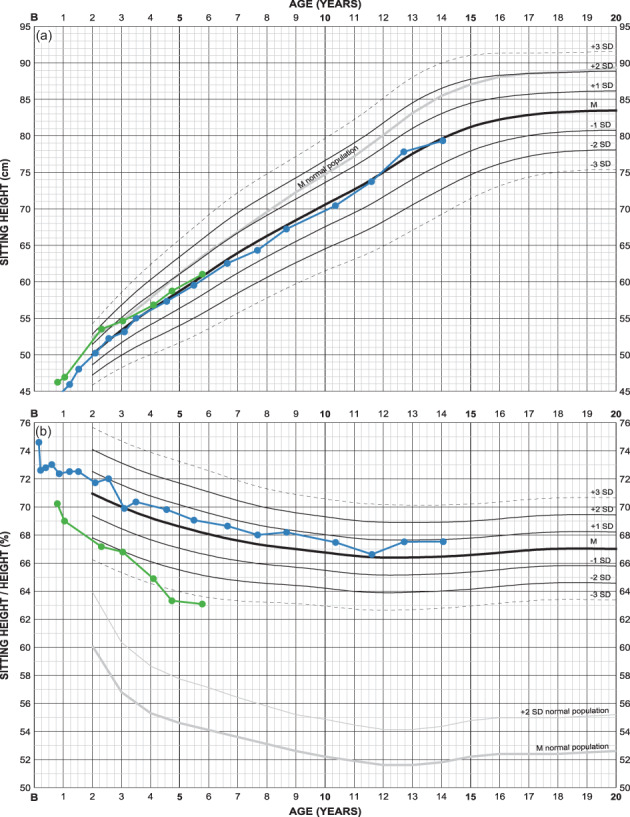
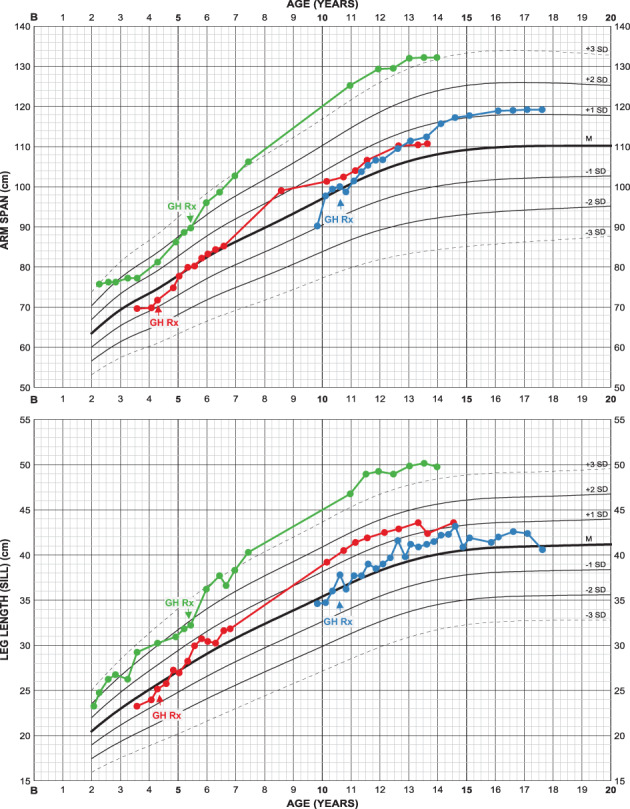
Clinical surveillance of infants and children with achondroplasia necessitates syndrome-specific charts due to extreme short stature with deviating body proportions. Height, arm span and leg length develop far below normal population ranges. We present growth and body proportion charts for ages 0-20 years, constructed from semi-longitudinal standardized measurements of about 450 children, along with some examples of achondroplasia typical and atypical growth pattern. We combine head circumference, height and weight for 0-4 years into one (infancy) page and height and weight for 4-20 years in another (childhood-adolescence) using nonlinear axes to account for the rapidly decreasing growth velocity. Similarly, weight and BMI are based on nonlinear axes to balance wide SD-channels at higher and narrow SD-channels at lower levels of weight/BMI. Charts for following sitting height, sitting height/height ratio, arm span, leg and foot length are also presented. Clinical examples illustrating the applicability of the charts include cases of extreme prematurity, extreme head circumference development before and after shunting, achondroplasia complicated by chromosomal or additional genetic abnormality and by growth hormone deficiency as well as of evaluating growth promoting therapy.

Keywords: achondroplasia; clinical surveillance; growth chart.


Conflict of interest statement

Lars Hagenäs has received a research grant and consultant fee from BioMarin Europe Ltd. and has received consultant fee from Ascendis Inc.

Figures

FIGURE 1
FIGURE 1
Growth chart of a girl with achondroplasia and extreme prematurity: Length and head circumference are shown both uncorrected (in red) and corrected (in blue) for 10 weeks prematurity. A catch‐up in length is seen during the first 4 months. The difference between both curves naturally diminishes with age since degree of adjustment shrinks on the age scale. Length is at 0, 6 months, and 2 years of age respectively −2.7, −0.3, and −0.4 SDS. Without age correction length would be −5.9, −3.0, and −0.9 SDS [Color figure can be viewed at wileyonlinelibrary.com]
FIGURE 2
FIGURE 2
Growth charts of two boys with atypical achondroplasia height pattern: Growth of the boy in green is probably influenced by foramen magnum stenosis with atrophy of medulla oblongata with paraplegia and hypoventilation requiring nighttime respiratory support. His length develops at the lower extremes of achondroplasia, that is, at −3 SDS as of 2 years of age, mainly due to limitations of leg growth (shown in Supporting information S3). His head grows normally until 12 months of age but slows down thereafter resulting in a “loss” in growth chart position; head circumference SDS at 12, 16, and 43 months respectively: +0.1, −0.6, −2.0 SDS. Note that his curve is corrected for 6 weeks prematurity. Height development in the other boy (in blue), probably growth hormone (GH) deficient and also with failure to thrive, stops at about 2 years of age resulting in a change of height position from −0.4 SDS to −4.5 SDS at 5 years of age, when GH therapy (GH Rx) is initiated. Following treatment start, a partial catch‐up growth is seen, −3.7 SDS at 7 years of age, mainly depending on increased position in sitting height (shown in Supporting information S3) [Color figure can be viewed at wileyonlinelibrary.com]
FIGURE 3
FIGURE 3
Growth chart of a boy with achondroplasia and Mb Down: Length follows strictly achondroplasia mean during the first postnatal years. Thereafter height position decreases to −2 SDS but it is unclear whether this decrease is dependent on the trisomy or on a temporary slower tempo of growth during childhood. Body disproportion develops in a milder direction than is typical for achondroplasia (charts found in Supporting information S4) [Color figure can be viewed at wileyonlinelibrary.com]
FIGURE 4
FIGURE 4
Growth chart of a girl with achondroplasia and Kabuki syndrome: She is small at birth and seems to catch‐up from outside achondroplasia normal ranges to −1 SDS at about 18 months of age. Note, however, that length position in achondroplasia typically rapidly falls during the first year of life and that her postnatal length curve develops in parallel to normal population mean (gray orientation line in the chart) indicating that intrauterine growth might be affected and that the same length position is retained during infancy and childhood; after 1 month, at 12 months and after 18 months respectively −3.2, −2.0, and −1.1 SDS in the achondroplasia chart versus −5.5 SDS at all three age points in the WHO reference. Final height seems to be reached at 15 years of age; height is 102 cm at 14.7 years of age or −4.8 SDS in the achondroplasia chart (−9.3 SDS in WHO reference) [Color figure can be viewed at wileyonlinelibrary.com]
FIGURE 5
FIGURE 5
Growth charts and head circumference SDS curves of two girls both shunted at 2 years of age: The head grows slower in both girls after shunting resulting in a decrease in head circumference SDS. The increased tempi in head circumference growth could hypothetically influence tempo in height. Height in one girl (in blue) is −0.7 SDS at 2 years of age and improves to −0.4 SDS during childhood, approaching achondroplasia population mean during pubertal ages. Height position in the other girl (in red) falls from 0.1 SDS at 2 years of age to below normal ranges despite a temporary improvement caused by pubertal spurt. Adult height (114 cm) approaches prepubertal position at −2.1 SDS (−7.3 SDS in WHO reference) [Color figure can be viewed at wileyonlinelibrary.com]
FIGURE 6
FIGURE 6
BMI charts of four boys with achondroplasia: (a) the nonlinear BMI‐axis causes upper BMI “channels” to be increasingly compressed compared to a linear axis (b). Three boys (in blue, green, red) with pronounced ability to gain weight and one boy (in purple) with more healthy weight and thus BMI development are shown. The boy marked in red gains 13 kg within 14 months, 23 kg within 22 months, weight increasing from +2.1 to +2.8 SDS (not shown), which pushes BMI from +2.0 to +2.7 SDS at 15.5 years of age. During the same period, the boy marked in purple gains 9 kg, changing from −0.8 to −0.4 SDS in the weight chart (not shown) or −1.0 to −0.9 SDS in the BMI chart [Color figure can be viewed at wileyonlinelibrary.com]
FIGURE 7
FIGURE 7
Sitting height charts of two girls with different FGFR3 mutations: one (in blue, from Figure 5) with Gly380Arg/achondroplasia and one (in green) with Asn540Lys/hypochondroplasia. At 6 years of age, sitting height is −0.1 and +0.1 SDS respectively at a relative sitting height of +0.5 and −3.4 SDS. Height corresponds to −0.3 and +1.9 SDS (shown in Supporting information S5) [Color figure can be viewed at wileyonlinelibrary.com]
FIGURE 8
FIGURE 8
Arm span and leg length charts of three girls with achondroplasia, all treated with growth hormone (GH Rx) from indicated ages: Both arm span and leg length seem to be stimulated by the treatment ending up in favorable measures in all girls. Note that these cases are selected only to show the usability of the charts and cannot be regarded as representative for growth hormone treatment in achondroplasia. Corresponding height and sitting height charts can be found in Supporting information S6 [Color figure can be viewed at wileyonlinelibrary.com]

References

    1. Arditi, J. D. , Thomaidis, L. , Frysira, H. , Doulgeraki, A. , Chrousos, G. P. , & Kanaka‐Gantenbein, C. (2017, July). Long‐term follow‐up of a child with Klinefelter syndrome and achondroplasia from infancy to 16 years. Journal of Pediatric Endocrinology & Metabolism: JPEM, 30, 797–803. 10.1515/jpem-2016-0362 - DOI - PubMed
    1. Bogin, B. , & Varela‐Silva, M. I. (2010). Leg length, body proportion, and health: A review with a note on beauty. International Journal of Environmental Research and Public Health, 7(3), 1047–1075. 10.3390/ijerph7031047 - DOI - PMC - PubMed
    1. Cole, T. J. , Freeman, J. V. , & Preece, M. A. (1998). British 1990 growth reference centiles for weight, height, body mass index and head circumference fitted by maximum penalized likelihood. Statistics in Medicine, 17(4), 407–429. - PubMed
    1. Cole, T. J. , & Green, P. J. (1992). Smoothing reference centile curves: The LMS method and penalized likelihood. Statistics in Medicine, 11(10), 1305–1319. - PubMed
    1. Cole, T. J. , & Lobstein, T. (2012). Extended international (IOTF) body mass index cut‐offs for thinness, overweight and obesity. Pediatric Obesity, 7(4), 284–294. 10.1111/j.2047-6310.2012.00064.x - DOI - PubMed

Publication types

MeSH terms