. 2021 Jan 20;109(2):241-256.e9.
doi: 10.1016/j.neuron.2020.10.035. Epub 2020 Nov 20.

Mutations in Spliceosomal Genes PPIL1 and PRP17 Cause Neurodegenerative Pontocerebellar Hypoplasia with Microcephaly

Affiliations

Mutations in Spliceosomal Genes PPIL1 and PRP17 Cause Neurodegenerative Pontocerebellar Hypoplasia with Microcephaly

Guoliang Chai et al. Neuron. .

Abstract

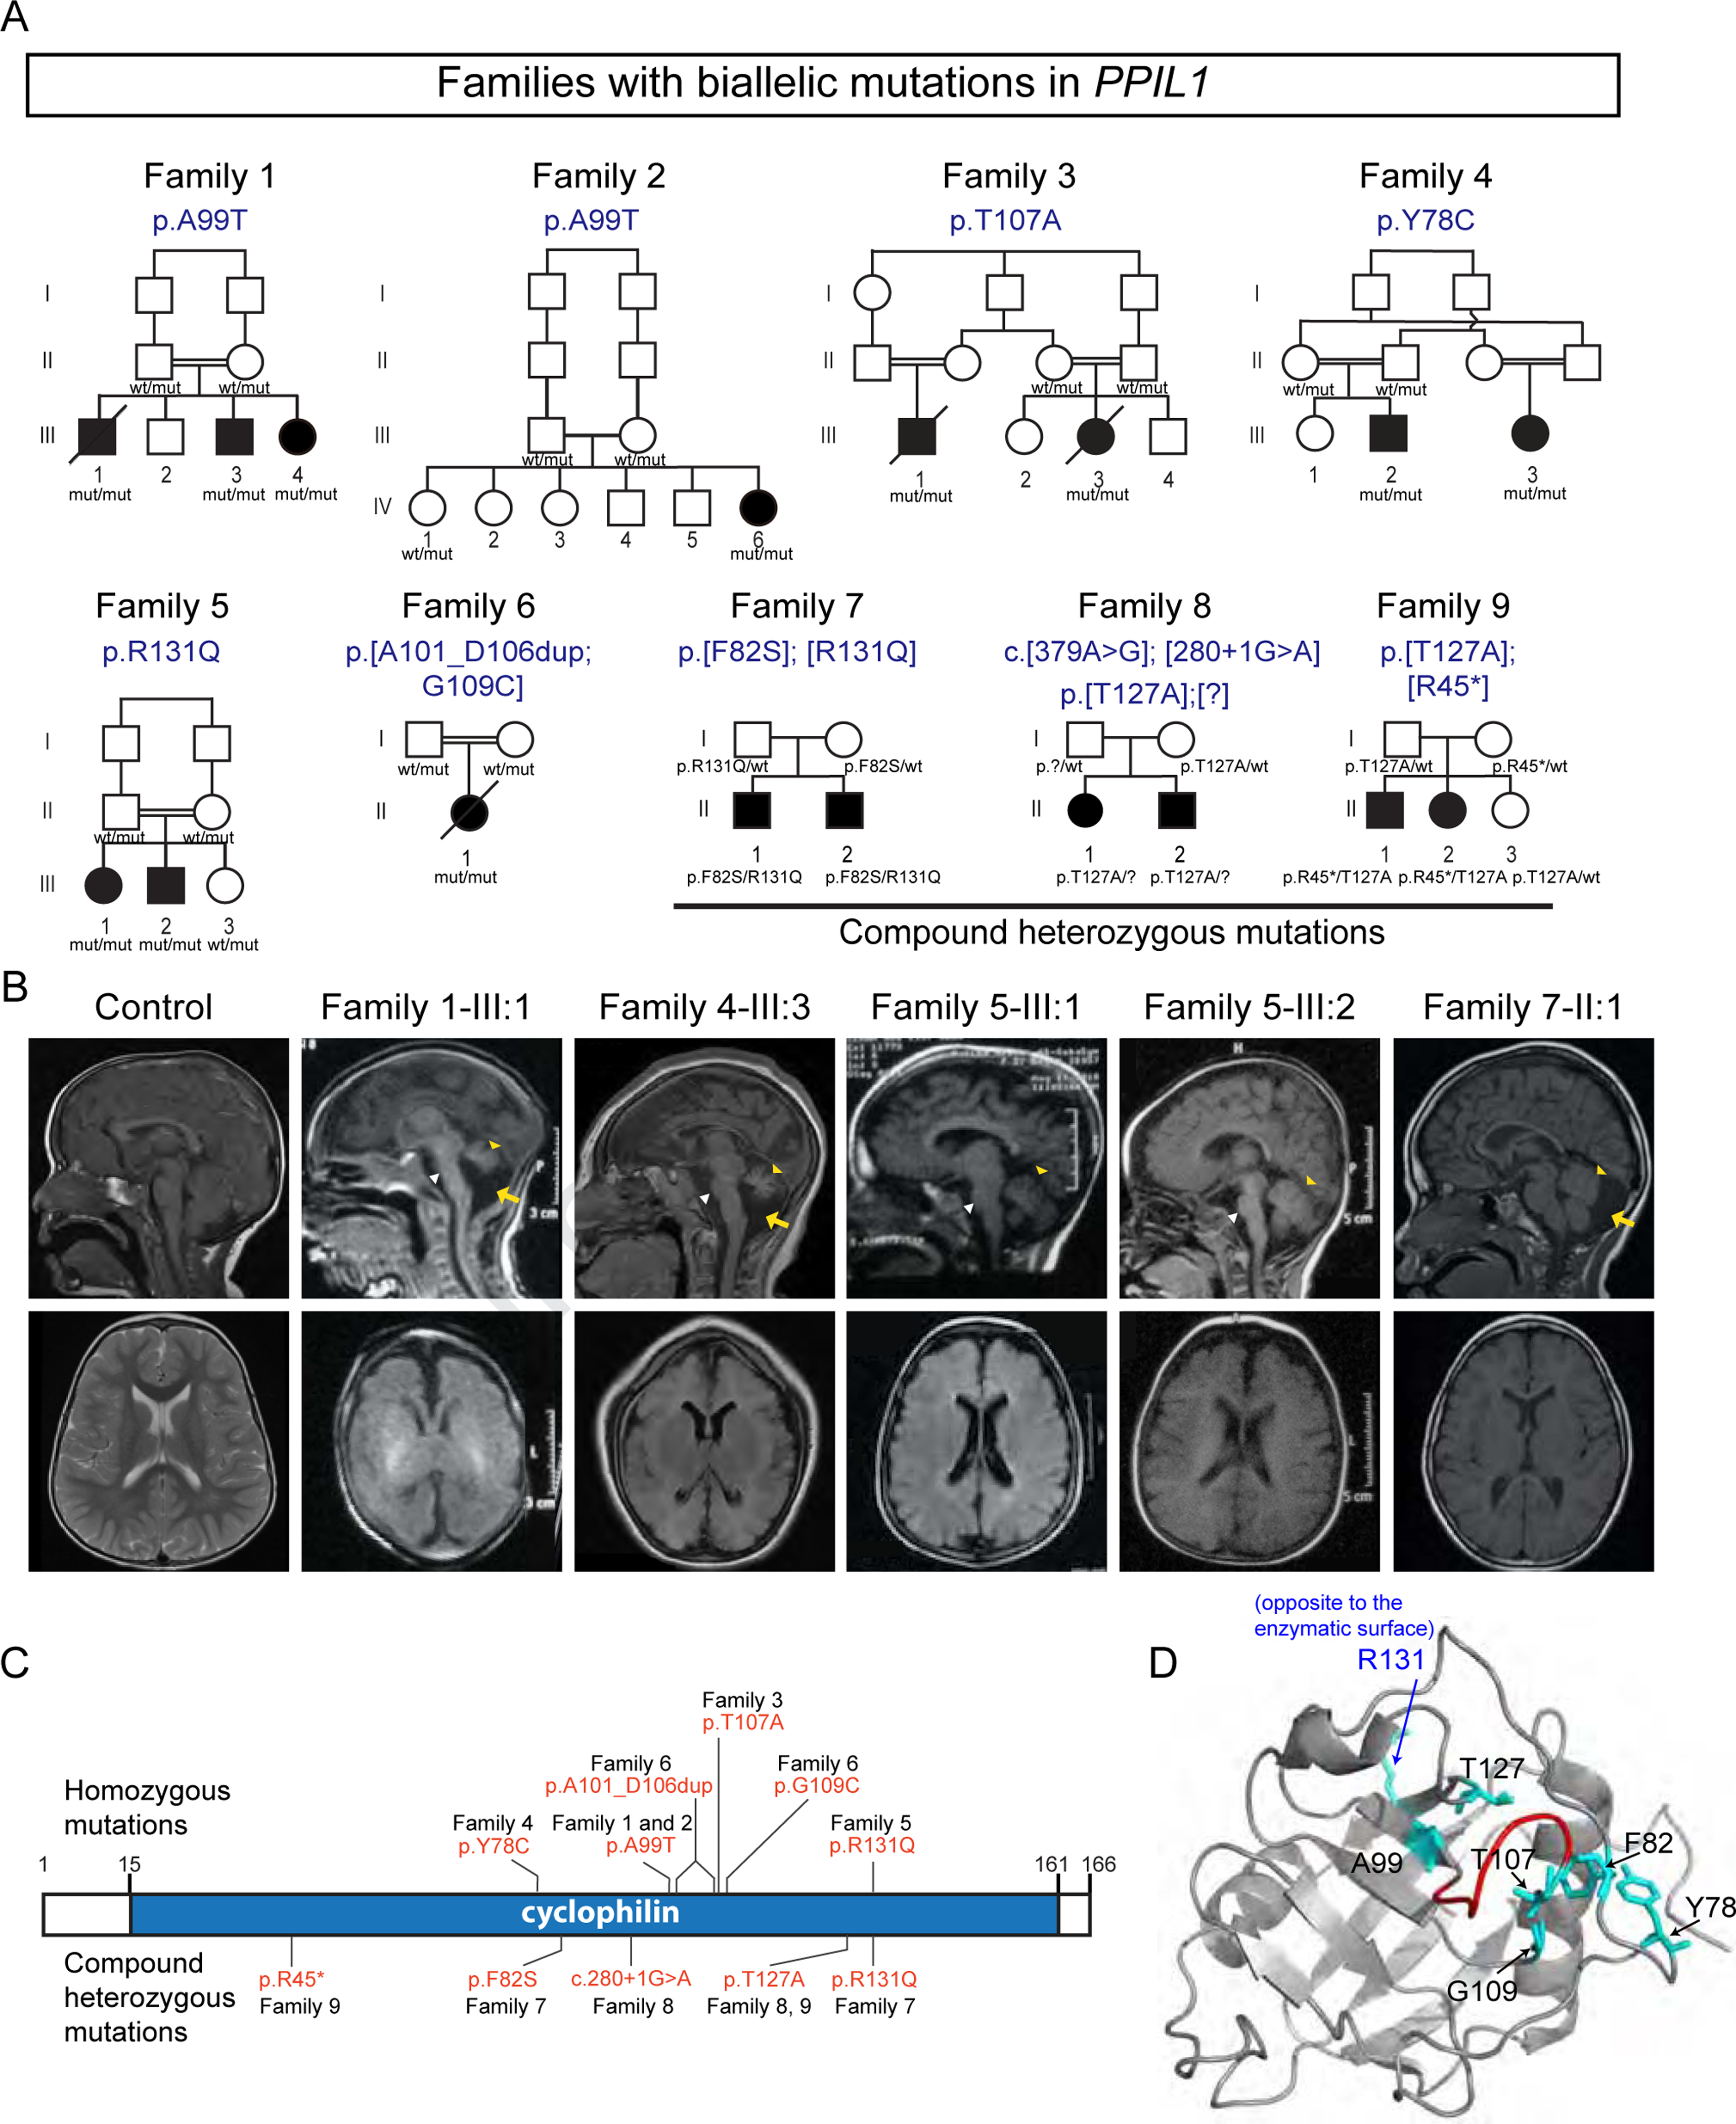
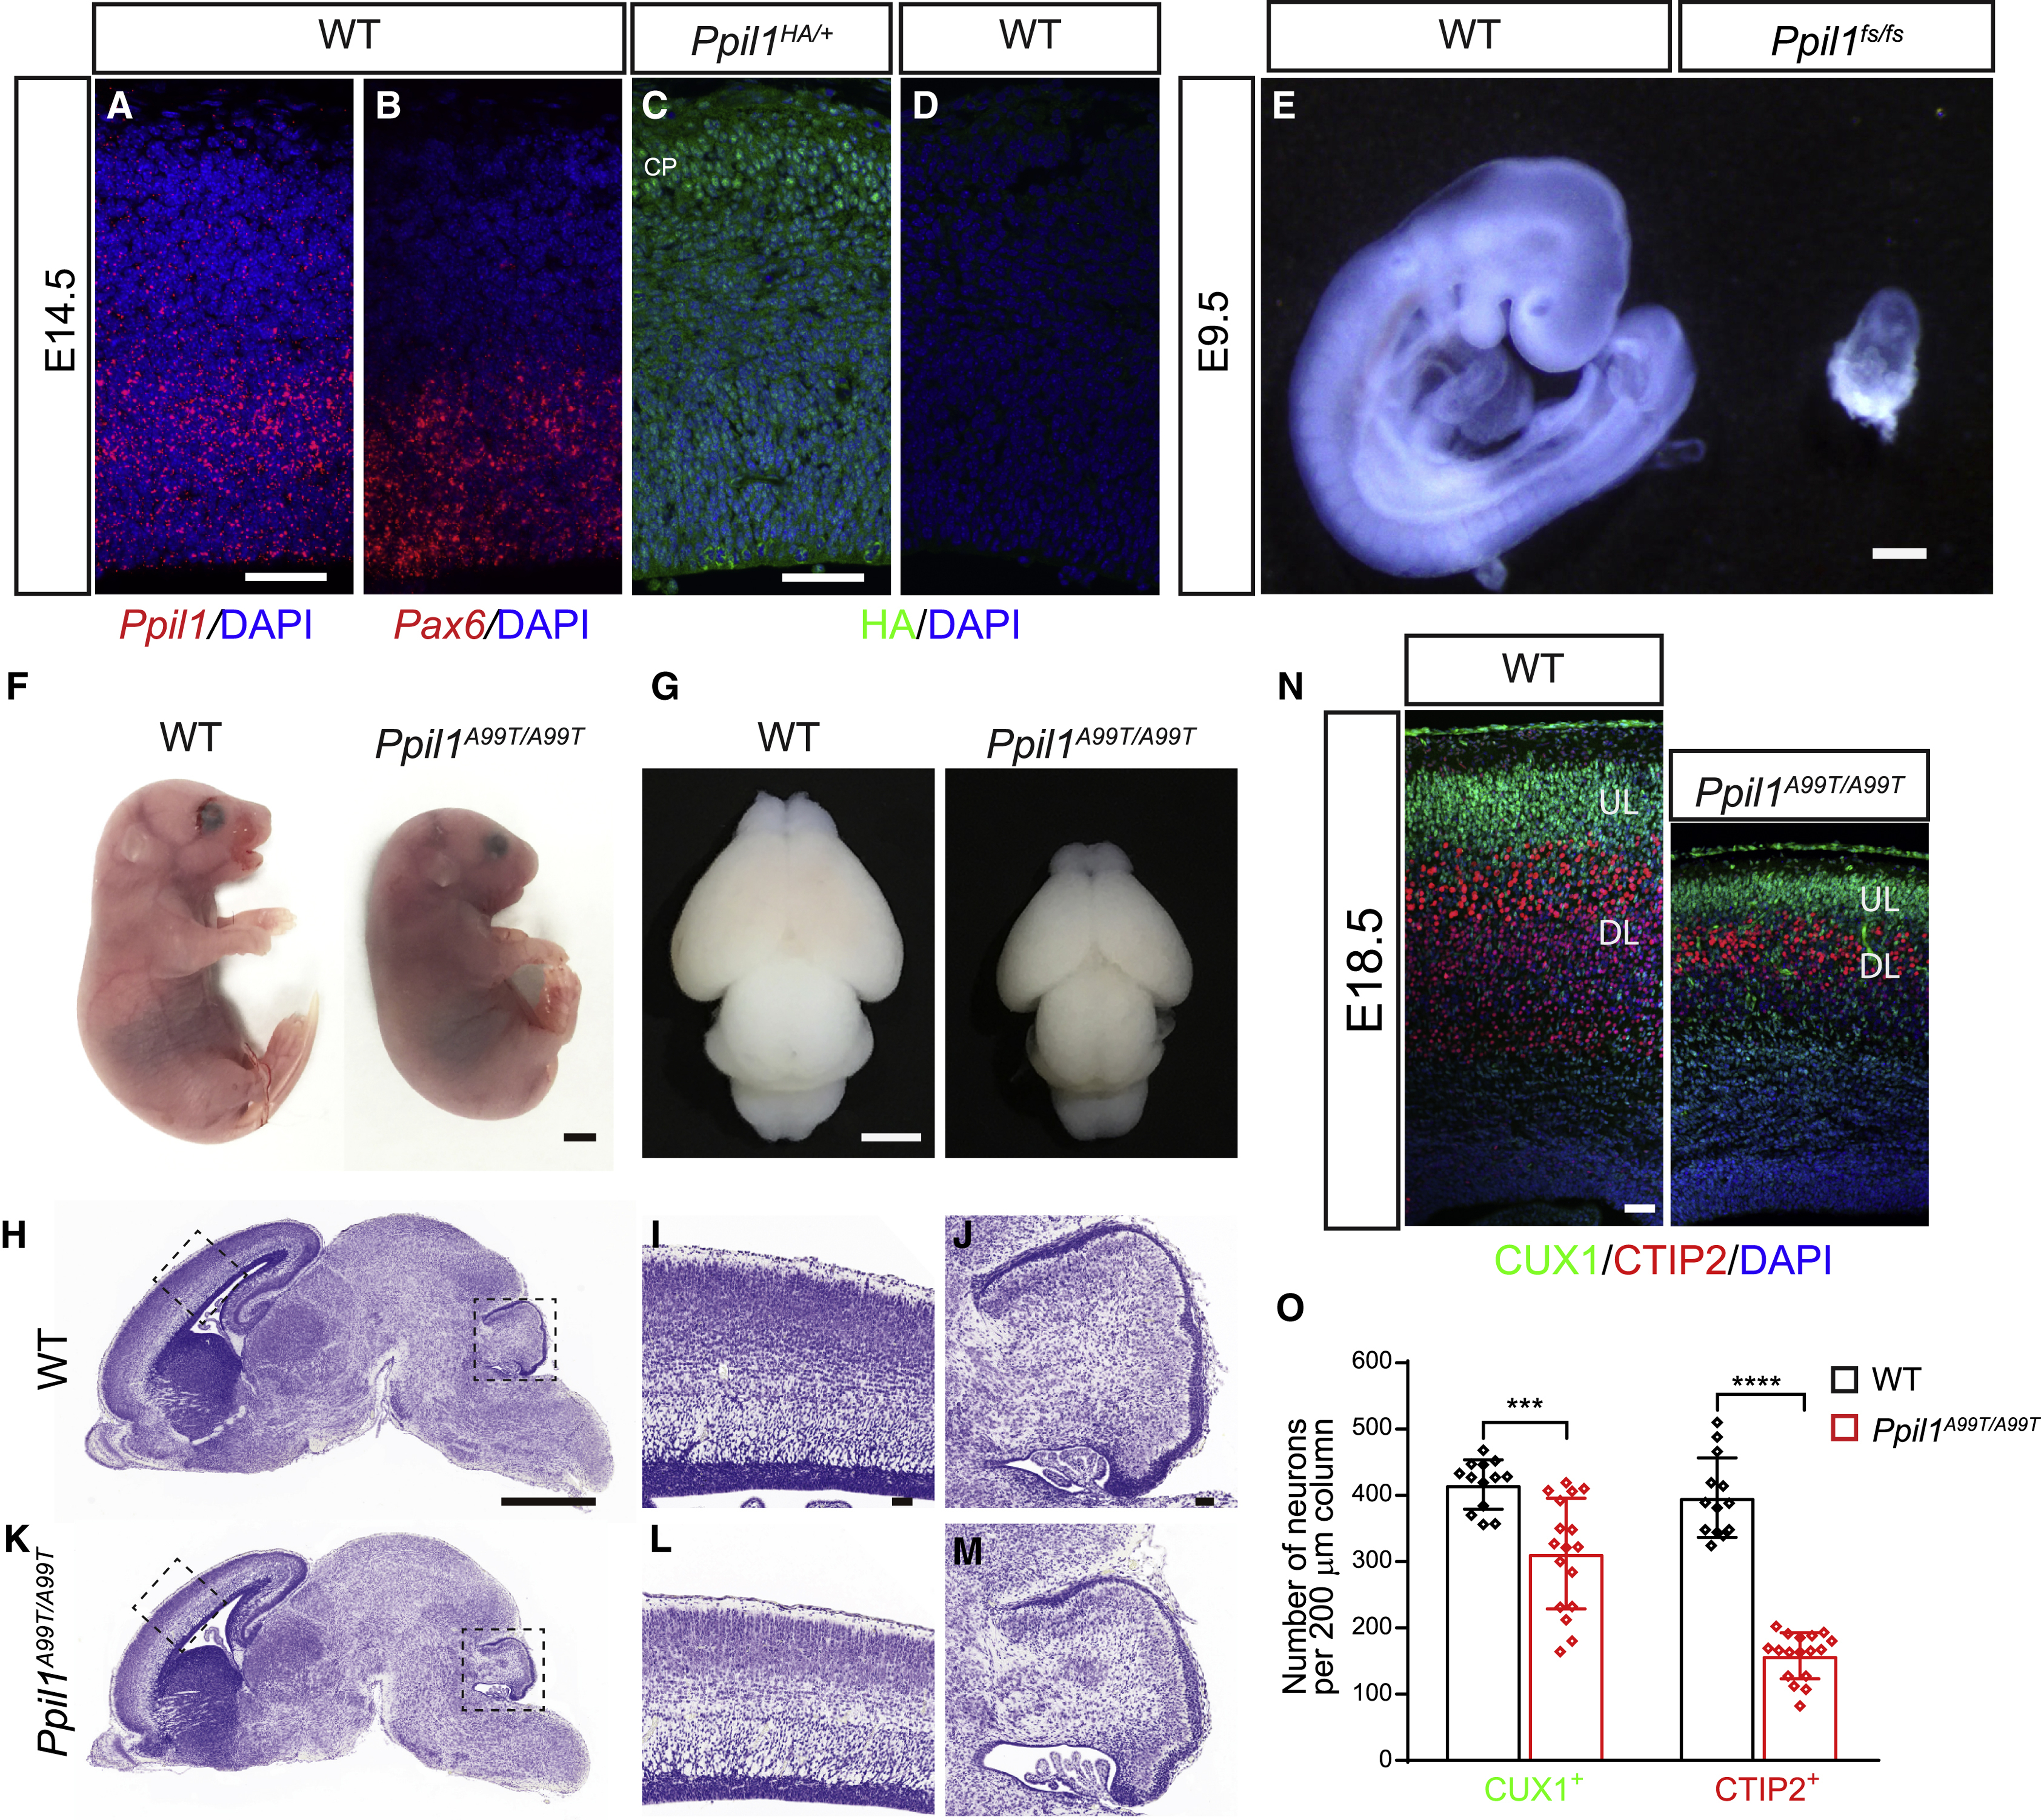
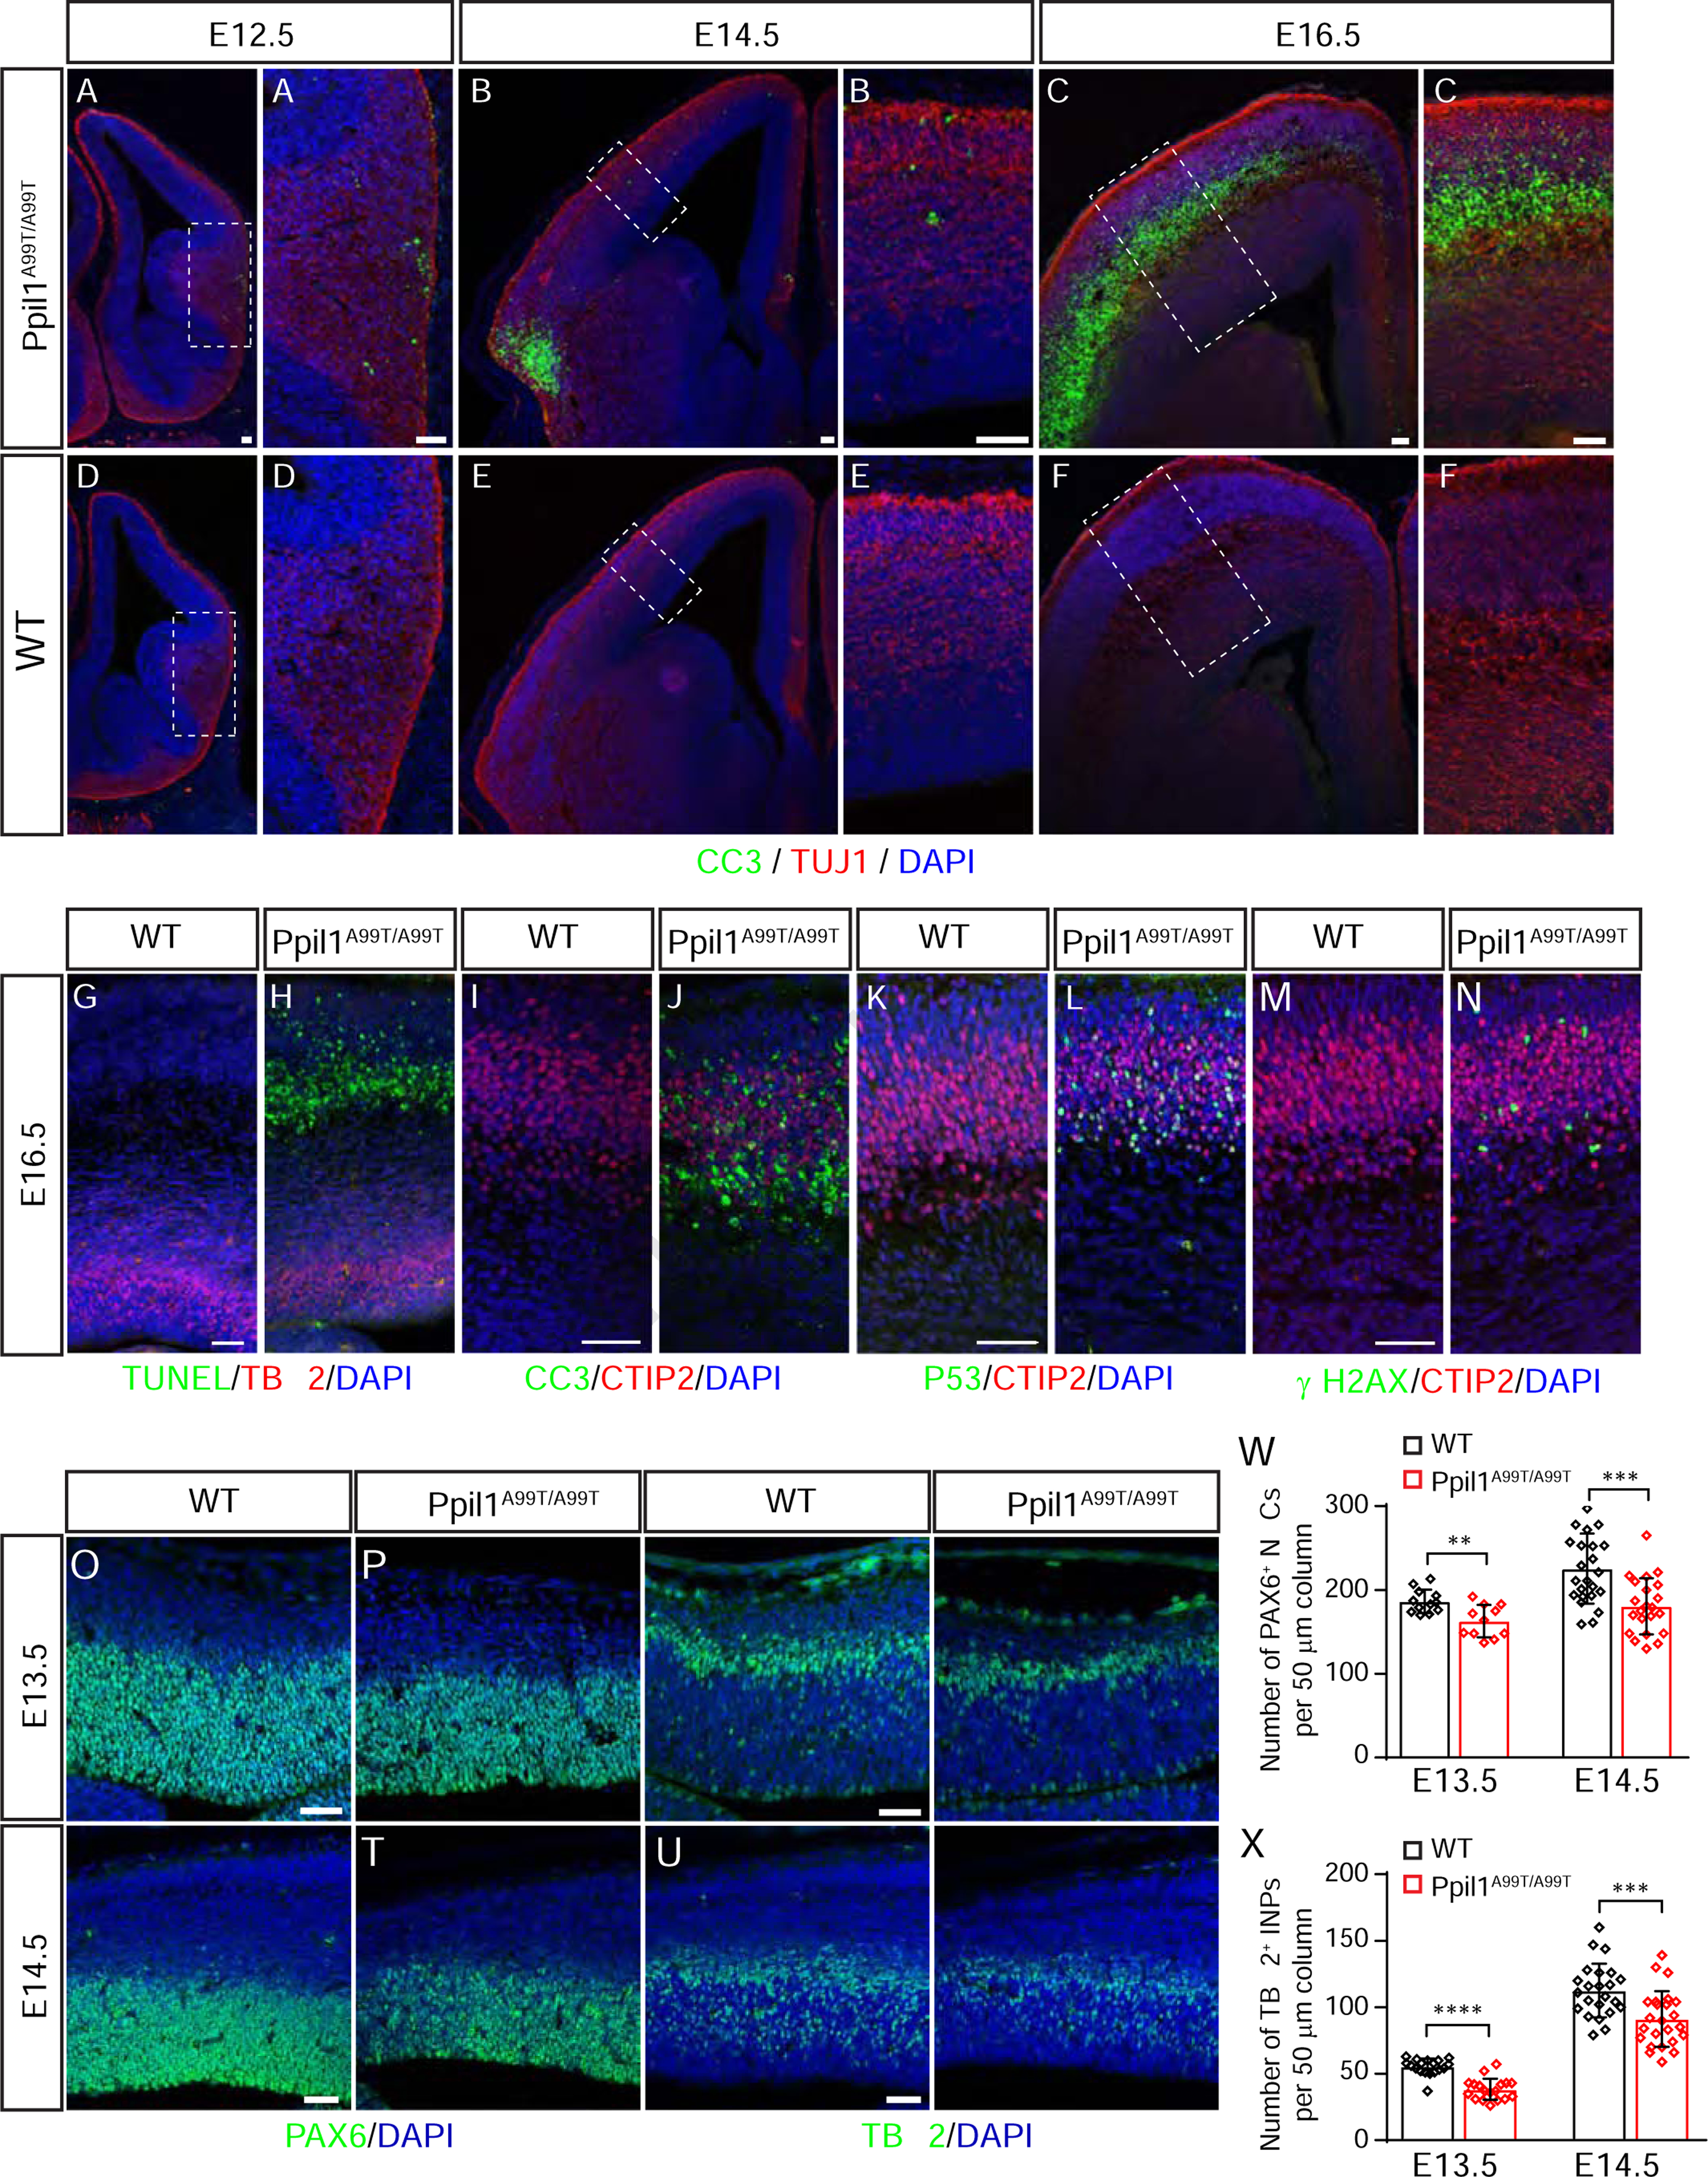
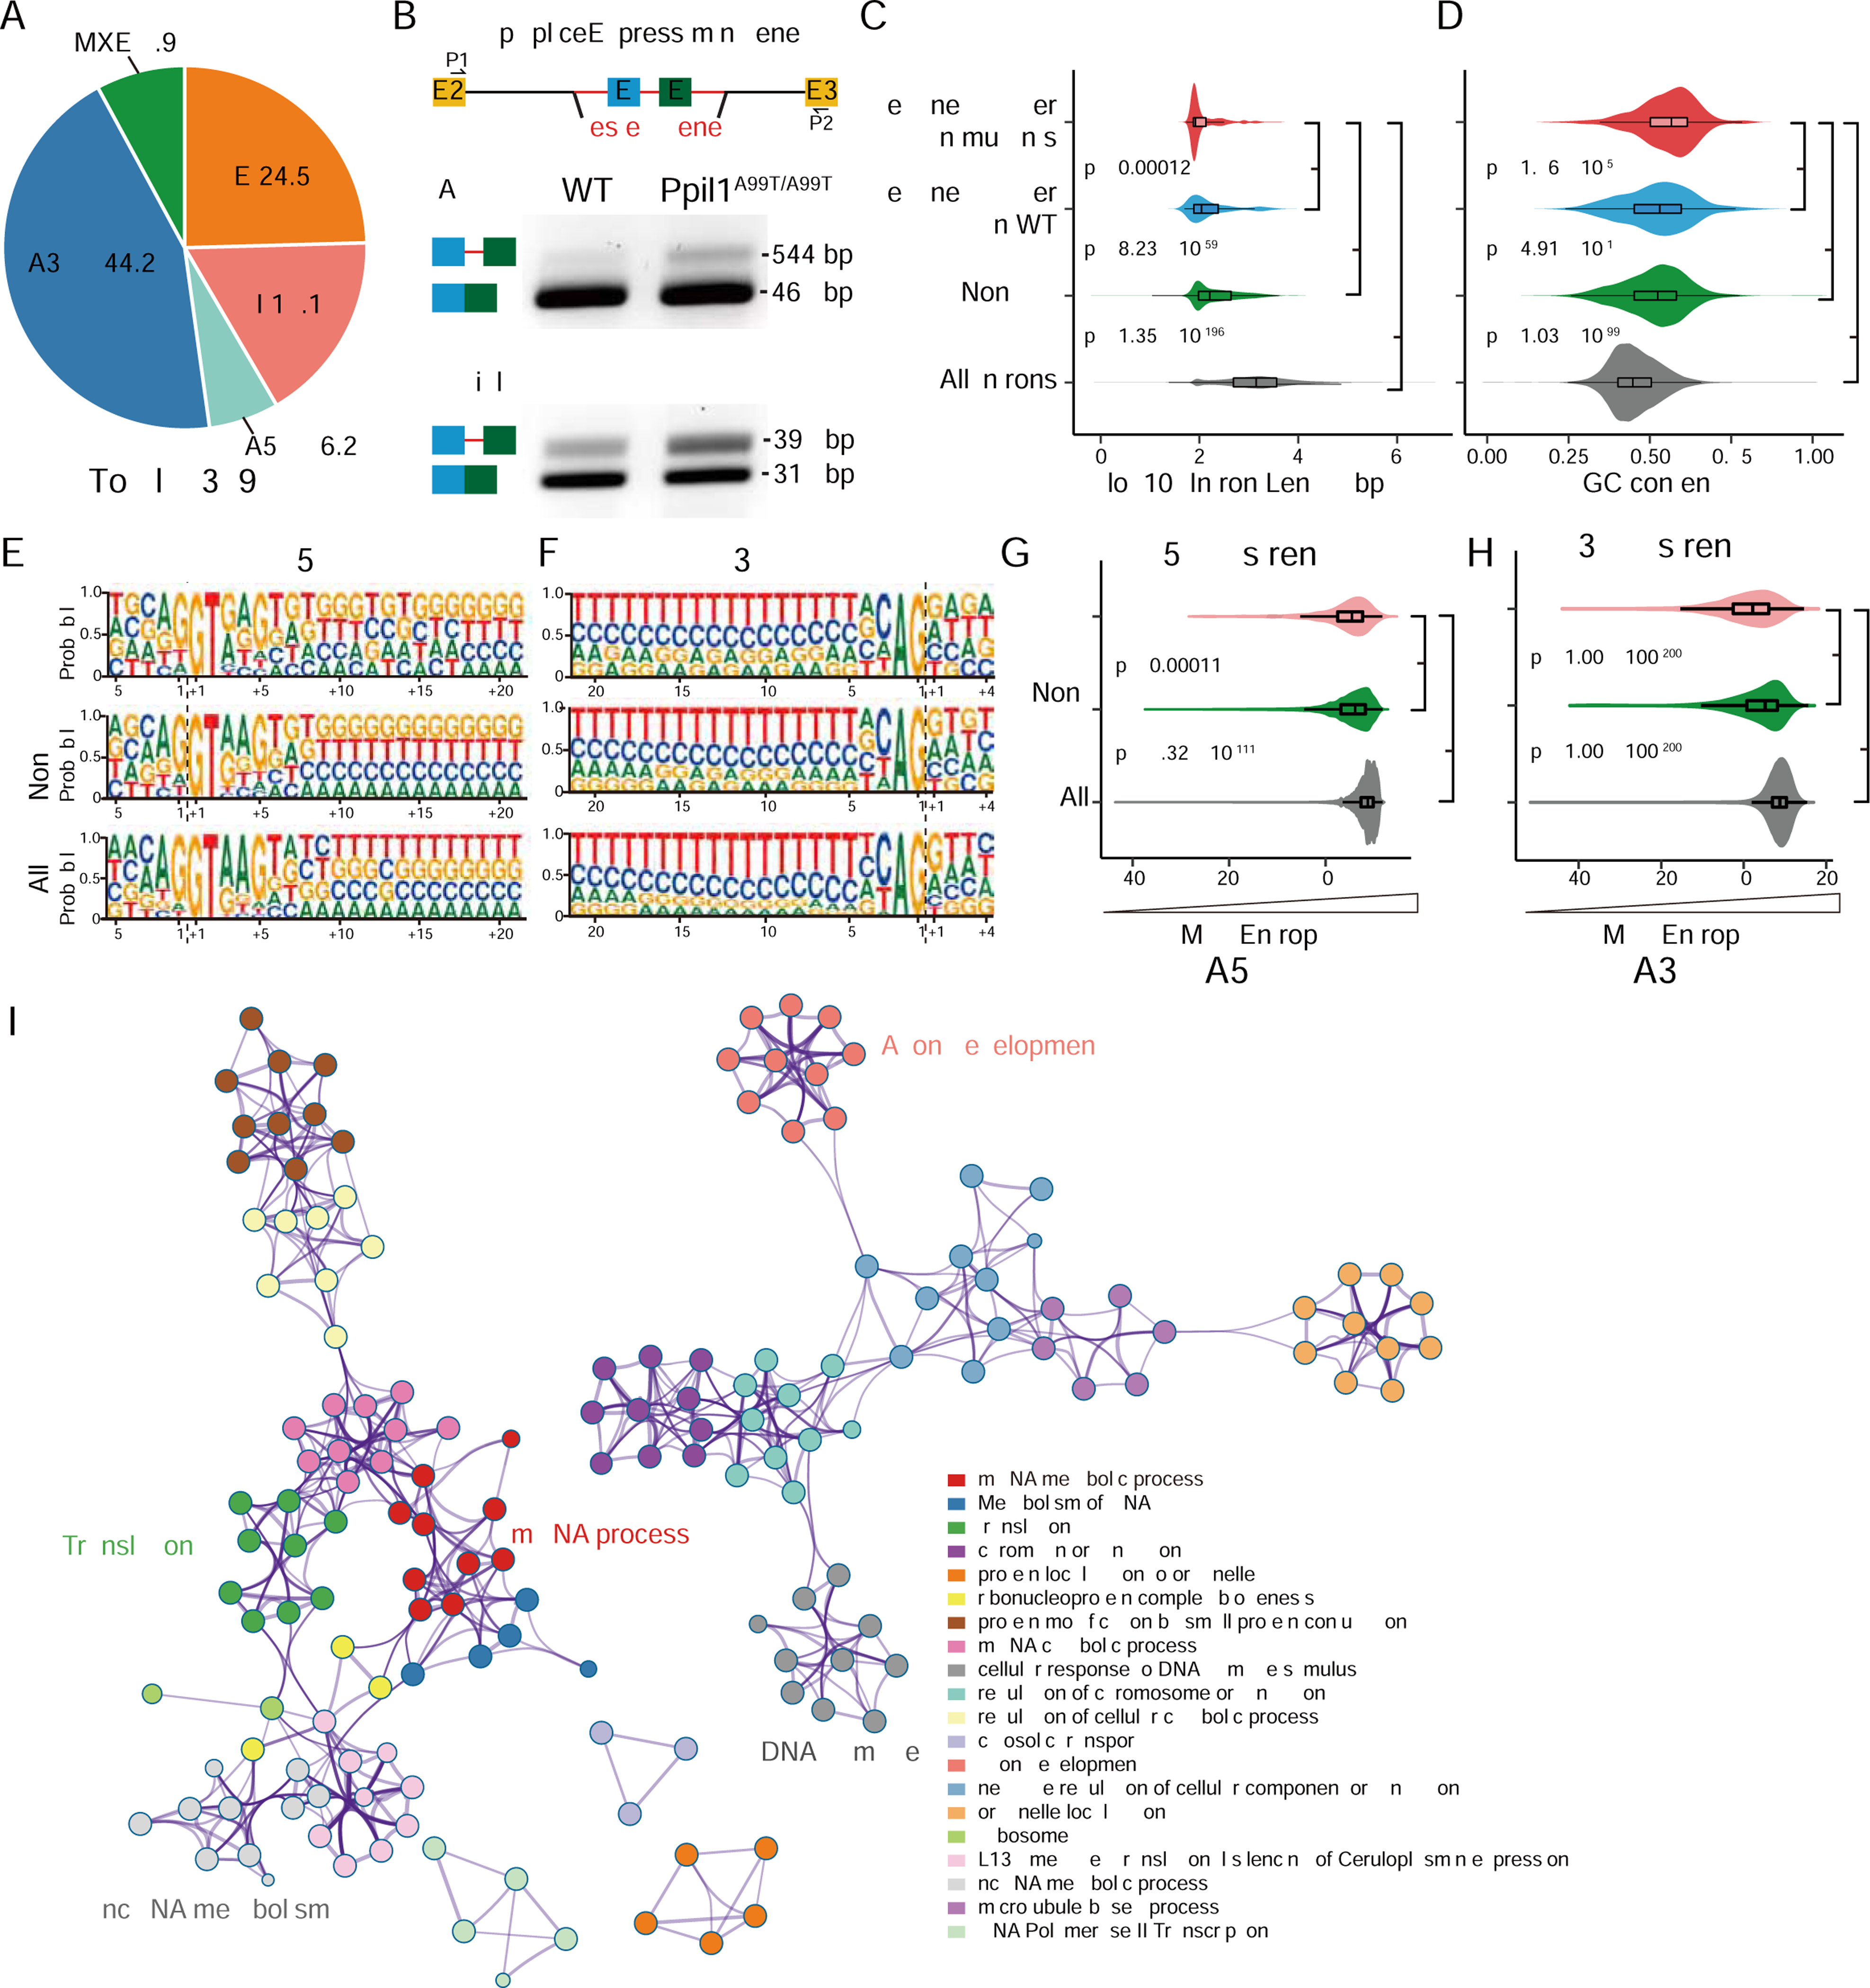
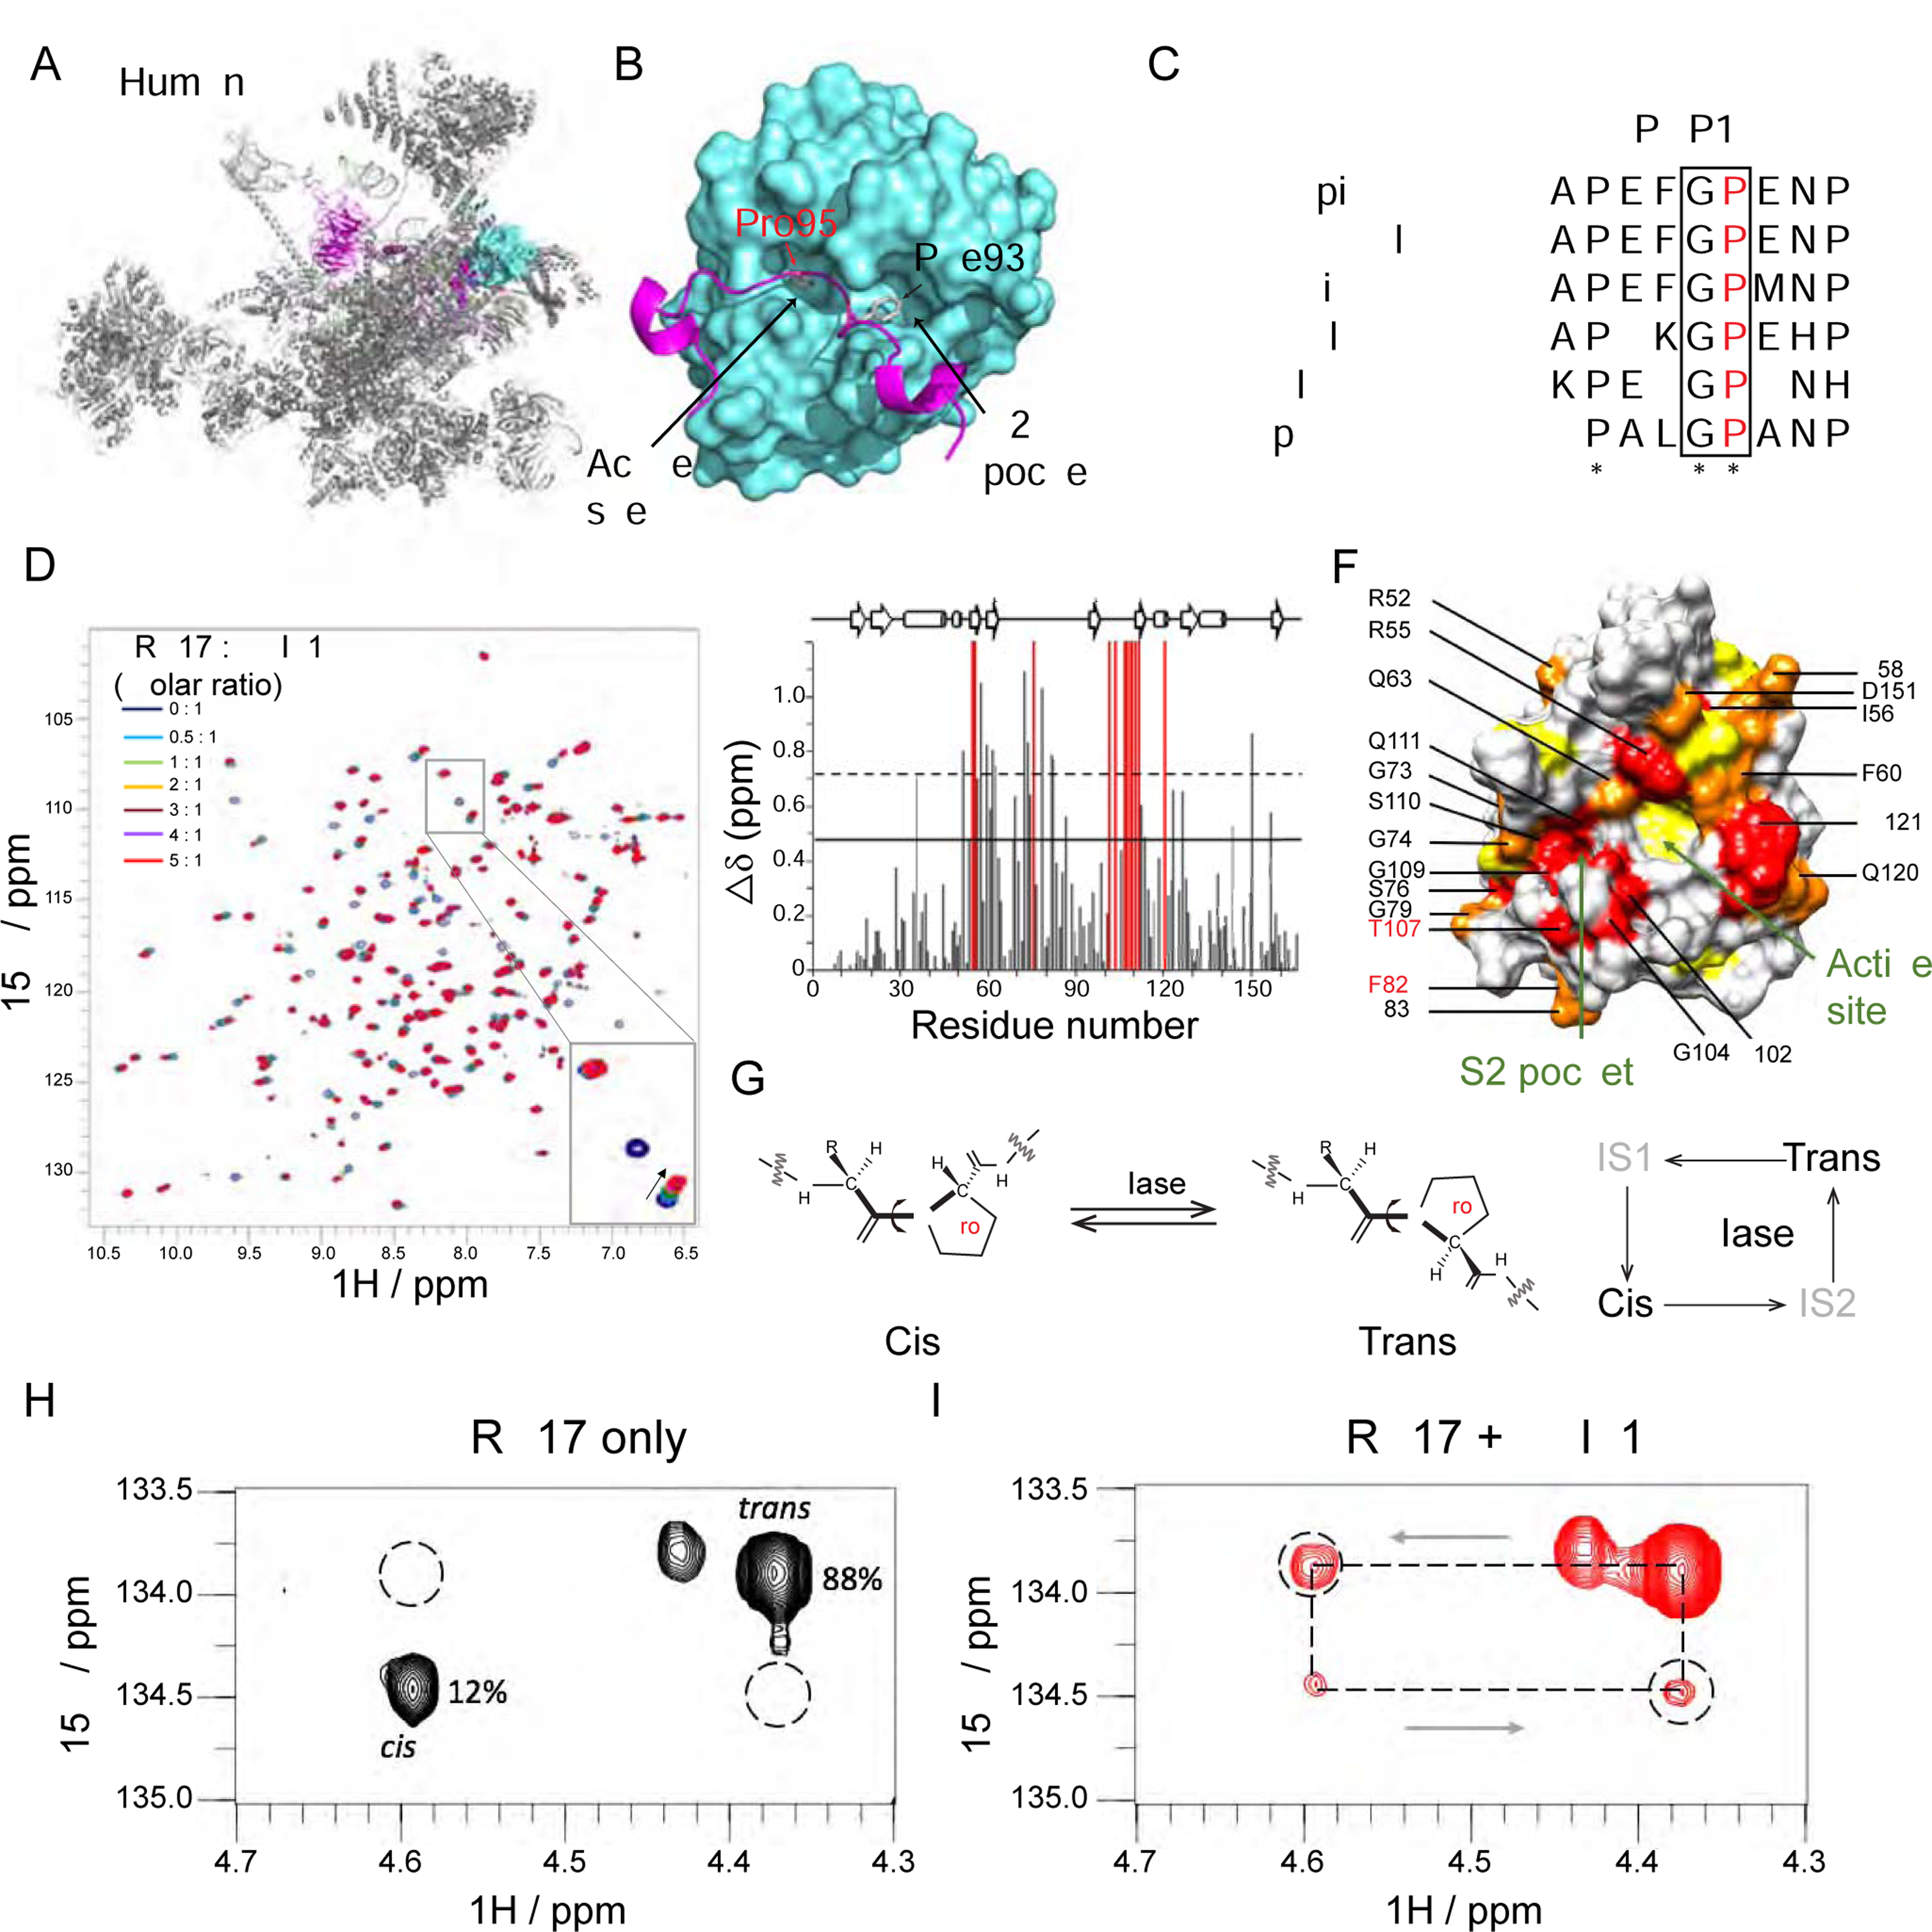
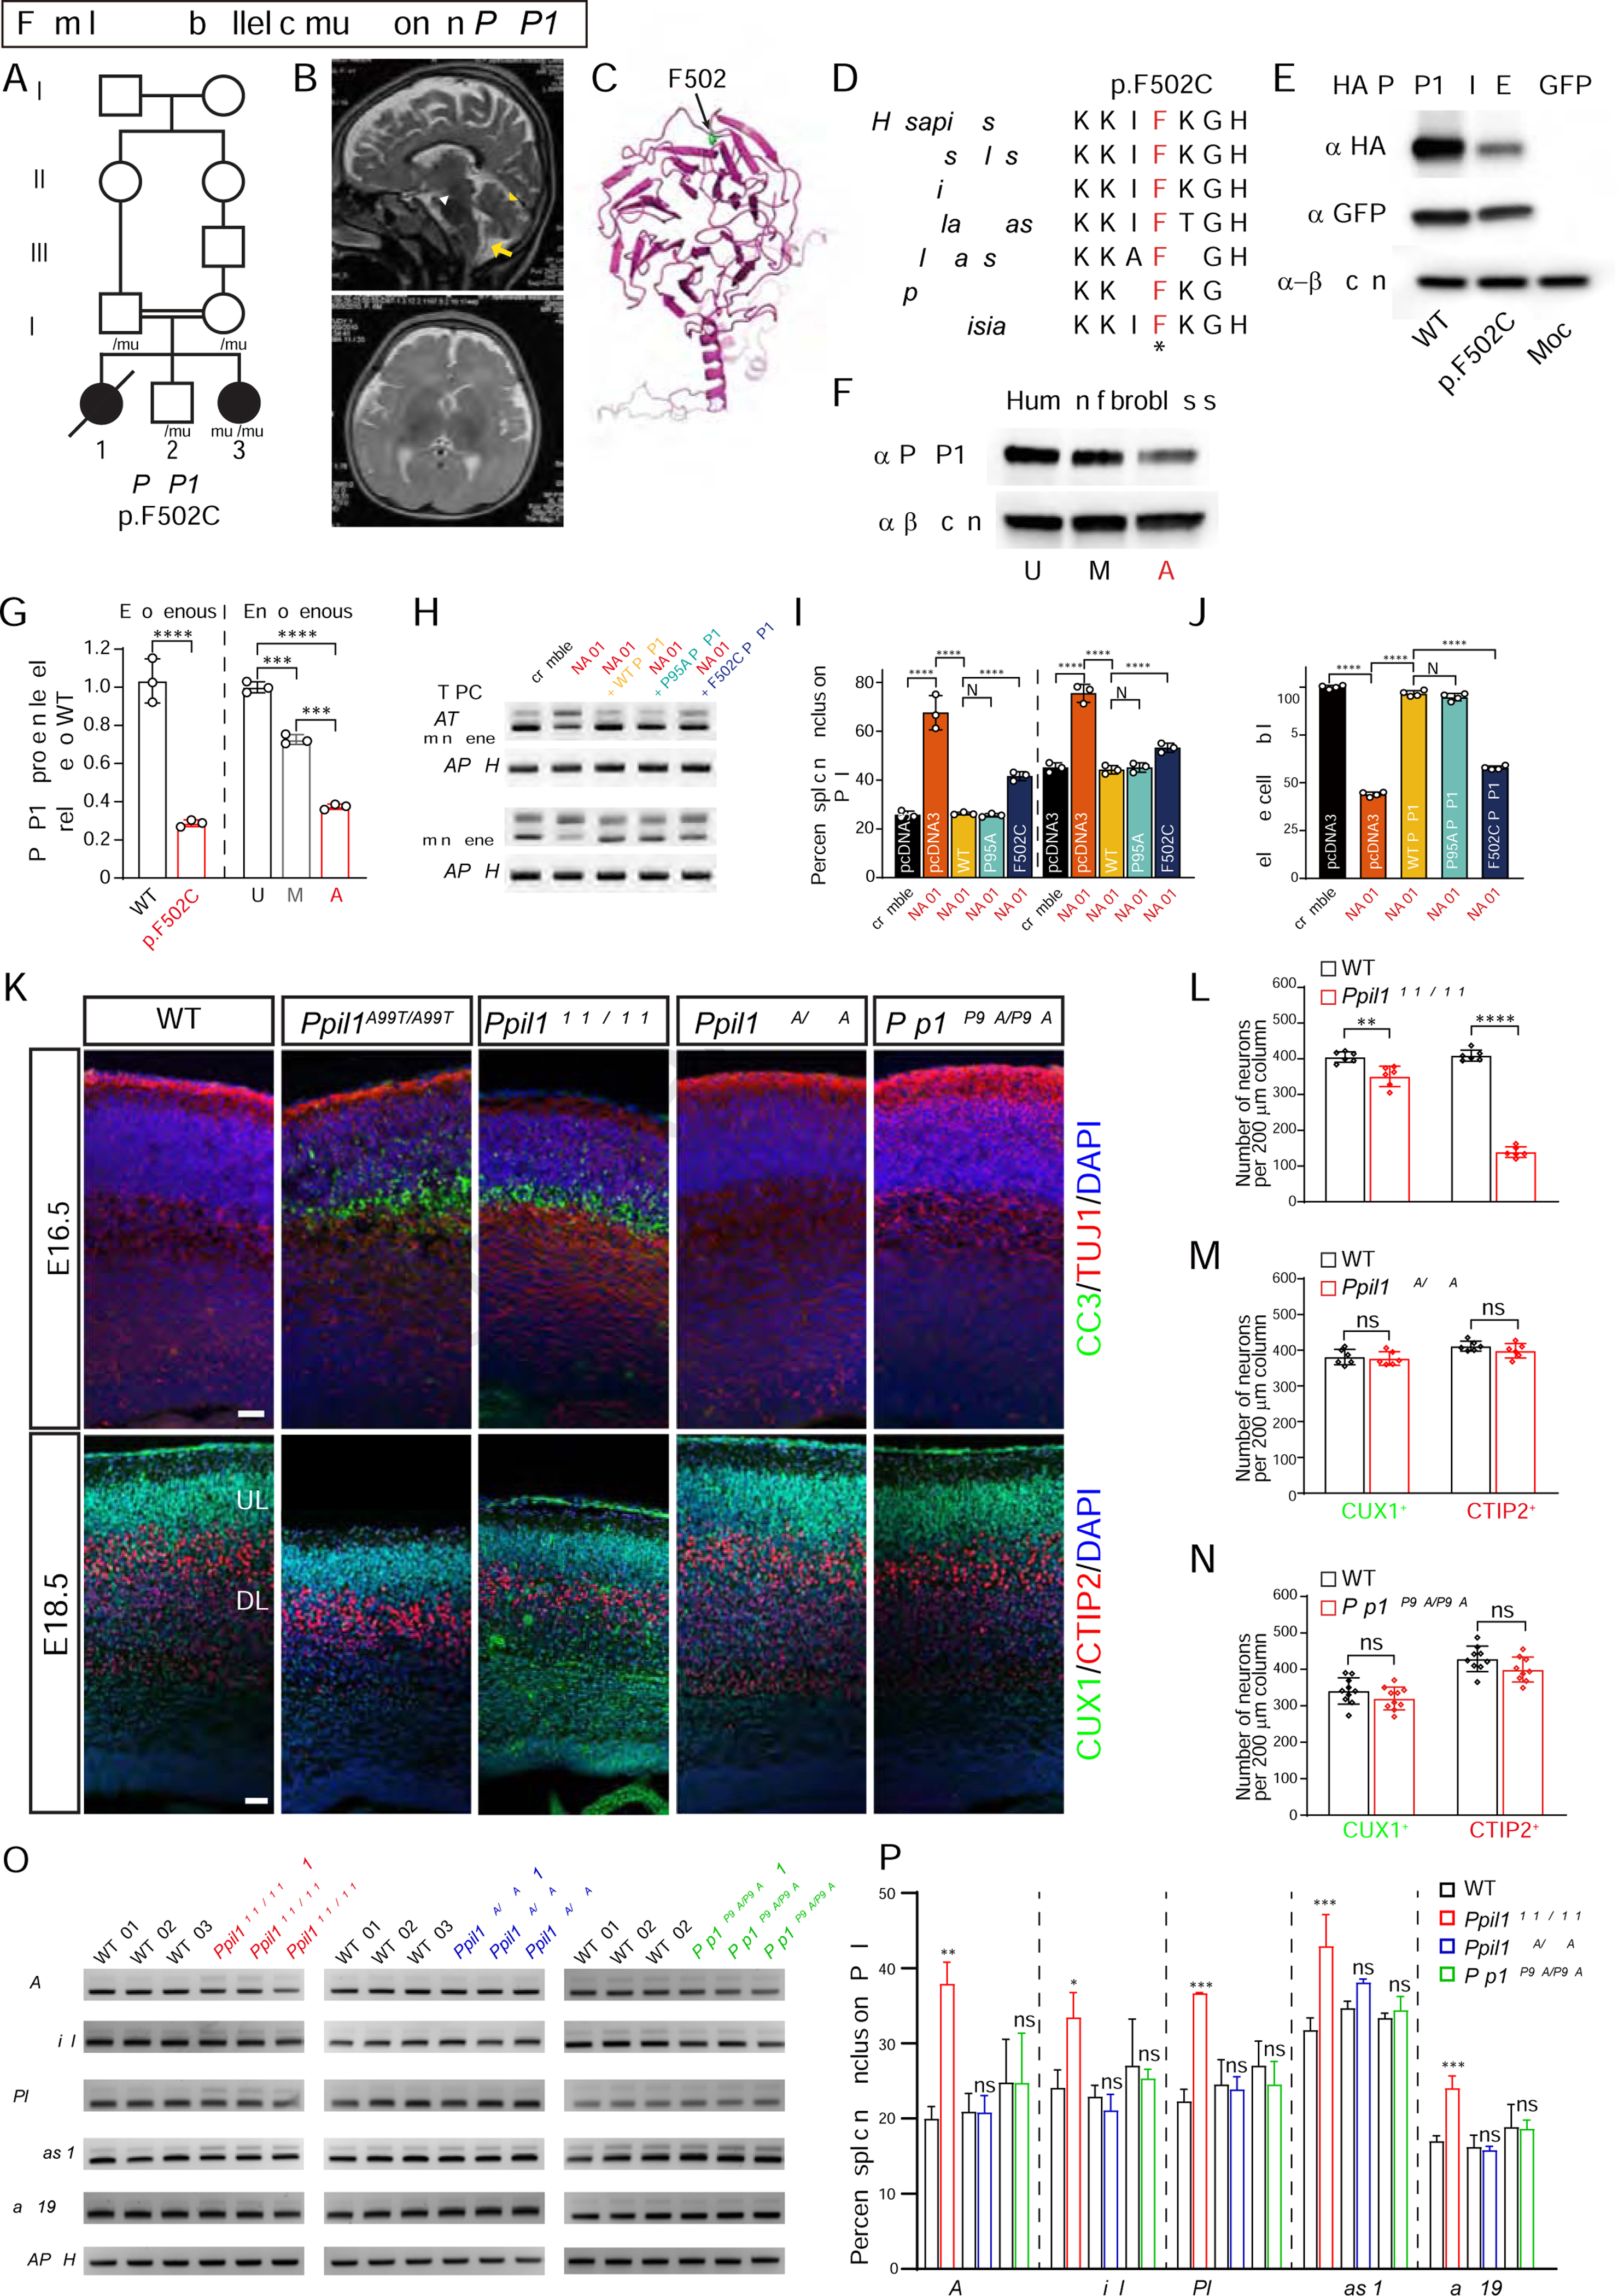
Autosomal-recessive cerebellar hypoplasia and ataxia constitute a group of heterogeneous brain disorders caused by disruption of several fundamental cellular processes. Here, we identified 10 families showing a neurodegenerative condition involving pontocerebellar hypoplasia with microcephaly (PCHM). Patients harbored biallelic mutations in genes encoding the spliceosome components Peptidyl-Prolyl Isomerase Like-1 (PPIL1) or Pre-RNA Processing-17 (PRP17). Mouse knockouts of either gene were lethal in early embryogenesis, whereas PPIL1 patient mutation knockin mice showed neuron-specific apoptosis. Loss of either protein affected splicing integrity, predominantly affecting short and high GC-content introns and genes involved in brain disorders. PPIL1 and PRP17 form an active isomerase-substrate interaction, but we found that isomerase activity is not critical for function. Thus, we establish disrupted splicing integrity and "major spliceosome-opathies" as a new mechanism underlying PCHM and neurodegeneration and uncover a non-enzymatic function of a spliceosomal proline isomerase.

Keywords: NMR; PCHM; PPIL1; PRP17; alternative splicing; brain development; cyclophilin; microcephaly; neurodegeneration; pontocerebellar hypoplasia; proline isomerase; recessive disease; spliceosome.


Conflict of interest statement

Declaration of Interests The authors declare no competing interests.

Figures

Figure 1.
Figure 1.. Biallelic mutations in PPIL1 lead to neurodegenerative pontocerebellar hypoplasia with microcephaly (PCHM) in human
(A) The families with predicted effects of PPIL1 variants listed above pedigree. All variants are homozygous in affected individuals, except Family 7–9, which are compound heterozygous. All pathogenic variants segregated as a recessive trait. Filled symbols: affected; p.[?]: splice donor site mutation, c.280+1G>A; square: male; circle: female; double bar: consanguinity; diagonal line: deceased. wt, reference allele; mut, patient variant allele. (B) Sagittal (top) and axial (bottom) T1-weighted brain MRIs show reduced cerebellar volume (yellow arrowhead), atrophic pons (white arrowhead) and posterior fossa fluid accumulation (yellow arrows) indicative of cerebellar atrophy in affected individuals. Simplified gyri pattern is most apparent in the affected from Family 1 and 4. (C) Identified PPIL1 mutations. Above: homozygous variants. Below: compound heterozygous mutations. (D) En face view of enzymatic surface with labeled variant residues in NMR-resolved PPIL1 structure (PDB: 2K7N). All except R131 (blue) localized to the enzymatic surface. Red: duplicated region in Family 6 (A101-D106). See also Figure S1.
Figure 2.
Figure 2.. Patient PPIL1 mutation knockin mice exhibit PCHM-like phenotype
(A and B) Fluorescent in situ hybridization (FISH) on coronal sections of E14.5 brain cortex hybridized with Ppil1 (A) and Pax6 (B) probes using RNAscope. Scale bar: 50 μm. (C and D) Coronal sections of E14.5 embryos from Ppil1HA/+ (C) and WT (D) embryos immunostained with an anti-HA antibody showing ubiquitous expression of PPIL1. CP: cortical plate. Bar: 50 μm. (E) Ppil1 fs/fs mouse embryos showed reabsorption at E9.5. Bar: 2 mm. (F and G) Homozygous patient variant p.A99T knockin mouse with microcephaly at E18.5. (H-M) Nissl stained sagittal sections of E18.5 Ppil1A99T/A99T brains, magnified for dashed regions in the cerebral cortex and cerebellum. (N) E18.5 Ppil1A99T/A99T cortex (coronal) shows reduced thickness but with intact lamination based upon immunostaining against CUX1 (upper layer neurons) and CTIP2 (lower layer neurons). (O) Reduced density of cortical CUX1+ and CTIP2+ neurons in E18.5 Ppil1A99T/A99T cortex. n = 4 mice/genotype. Mean ± s.d.; p = 0.0003 CUX1+ cells; p < 0.0001 CTIP2+ cells; two-tailed unpaired t-test. Scale bar: 1 mm in H and K; 50 μm in I, J, and L–M. See also Figure S2.
Figure 3.
Figure 3.. Ppil1 knockin mice show increased neuron-specific apoptosis and depletion of neural progenitor cells
(A-F) Embryonic Ppil1A99T/A99T brains (coronal) shows increased cleaved Caspase 3 (CC3, green). (G-N) Coronal sections of E16.5 brain cortex from WT and Ppil1A99T/A99T embryos stained for TUNEL and TBR2 (G and H), CC3 and CTIP2 (I and J), p53 and CTIP2 (K and L), γ-H2AX and CTIP2 (M and N). (O-V) Embryonic Ppil1A99T/A99T cortex (coronal) shows reduced PAX6 (neural stem cells, NSC) and TBR2 (intermediate neural progenitor, INP) positive cells. (W and X) Reduced density of cortical PAX6+ neural stem cells and TBR2+ intermediate progenitor cells in E13.5 and E14.5 cortex. Mean ± s.d.; p = 0.0029 E13.5 PAX6+, p = 0.0002 E14.5 PAX6+; p < 0.0001 E13.5 TBR2+; p = 0.0008 E14.5 TBR2+; two-tailed unpaired t-test. Scale bar: 50 μm. See also Figures S2 and S3.
Figure 4.
Figure 4.. Global splicing integrity defects in Ppil1A99T/A99T developing brain
(A) Impact of p.A99T mutation on five major types of AS events detected with rMATS in E14.5 brain hemispheres (3 KI vs. 3WT). A3SS was most impacted, followed by SE, RI, MXE, and A5SS. (B) Minigene splicing reporter assays in transfected Ppil1A99T/A99T mouse embryonic fibroblasts show higher intron retention levels in mutant cells for both Atg4d and Evi5l. (C and D) Distribution of differential splicing identified by rMATS in KI or control, based upon intron length and GC content. Introns with short length or high GC content show significantly retained higher in Ppil1 KI brains. All introns represent all identified introns from mouse reference genome. p-value: Wilcox test. (E-H) Splice-site strength analysis of 5’SS and 3’SS in all introns (All, gray), non-significant A5SS or A3SS events (Non-sig, green), and significant A5SS or A3SS events (Sig, red) identified by rMATS. The 5’SS and 3’SS strength show lower maximum entropy for choice points that were significantly different in KI compared with control. p-value: Wilcox test. (I) Metascape visualization of enriched networks and pathways among all misspliced genes in E14.5 Ppil1A99T/A99T brains (n = 2134 misspliced genes), showing several key modules represented including “mRNA metabolic process” among others. See also Figures S4 and S5 and Table S3.
Figure 5.
Figure 5.. PPIL1 P95 is positioned in the enzymatic pocket of PRP17 in the activated spliceosome
(A and B) Cryo-EM structure of human spliceosome C* complex (PDB: 5XJC) shows an N-terminal loop of PRP17 (cartoon in purple) bound to PPIL1 (teal) enzymatic surface with Pro95 buried inside the S1 enzymatic pocket. (C) Protein sequence alignment of PRP17 from 6 species shows an evolutionarily conserved Gly-Pro (G-P) motif in PRP17. * stands for identical residues, : indicates similar residues. (D) Overlaid 1H-15N HSQC spectra of PPIL1 with PRP17 peptide titrations (0–5 molar equivalents, aa 89–101: FAPEFG[P]ENPFRT). Specific resonance shifts or broadening beyond detection indicates specific binding of PRP17 to PPIL1. Inset: Examples of PPIL1 resonance changes that shift (arrowhead), broaden beyond detection (open arrowhead) or were unchanged (arrow) as a result of PRP17 titration. (E) Average chemical shift perturbations of PPIL1 residues upon titration with PRP17. Gray: shifted resonances. Red: broadened beyond detection resonances. Solid or dashed lines: shifts >1 or >2 SD above mean, respectively. (F) Space-filling model of PPIL1 (PDB: 2X7K) showed significantly perturbed residues upon PRP17 peptide binding. Red: residues broadened beyond detection, Orange: residues >2 SD, Yellow: residues >1 SD above mean. Residues affected in patients are labeled in red. (G) Schematic of cis-trans Xaa-Pro peptide bond isomerization catalyzed by PPIase. IS: Intermediate State. (H and I) 2D 1H, 15N-H(Cα)N ZZ exchange spectra of PRP1 peptide in the absence (H) or presence (I) of sub-stoichiometric concentrations (1% molar ratio) of PPIL1, with appearance of ‘exchange signals’ (dashed circles), i.e. significant interconversion between cis-trans states. See also Figures S5 and S6, Table S4, and Movie S1.
Figure 6.
Figure 6.. PPIL1 and PRP17 control neuronal survival independent of catalysis
(A) Pedigrees of PCHM Family 10 with homozygous PRP17 p.F502C variant segregating as a recessive trait. Filled symbols: affected; square: male; circle: female; double bar: consanguinity; diagonal line: deceased. (B) T2-weighted brain MRI shows reduced cerebellar volume (yellow arrowhead), atrophic pons (white arrowhead) and posterior fossa fluid accumulation (yellow arrows) indicative of cerebellar atrophy in the living affected. (C) The structure of PRP17 resolved from the cryo-EM structure of spliceosomal C complex (PDB: 5XJC) showing mutated residue F502 within the C-terminal WD40 domain. (D) Protein sequence alignment of PRP17 showing mutated F502 residue highly conserved across eukaryotes. *: identical. (E) Western blot of overexpressed HA-tagged PRP17 shows that the p.F502C substitution destabilized the protein. (F) Western blot of endogenous PRP17 from dermal fibroblasts demonstrating reduced protein levels from affected (A) compared with mother (M) and unaffected control (U). (G) Quantification of exogenous and endogenous PRP17 protein in transfected HEK293T cells and human dermal fibroblasts, respectively. n = 3. (H) RT-PCR based minigene splicing assay following PRP17 repression in HEK293T cells, showing full rescue by WT or p.P95A PRP17 but only partial rescue by p.F502C PRP17. (I) Quantification of percent splicing inclusion (PSI) for minigene splicing reporters. PSI was calculated as percent of inclusion form transcripts among all transcripts (inclusion and exclusion forms). n = 3. (J) Reduced cell viability following PRP17 repression was fully rescued by WT or p.P95A PRP17 but only partially by p.F502C PRP17. n = 4. (K) Coronal sections of E16.5 (top) and E18.5 (bottom) mouse brains with upregulated cleaved caspase 3 (CC3) and reduced cortical thickness in Ppil1A99T/A99T and Ppil1R131Q/R131Q, but not in Ppil1R55A/R55A or Prp17P95A/P95A. CUX1 and CTIP2 label upper and deep layer cortical neurons, respectively. Scale bar: 50 μm. (L–N) Quantification of cortical CUX1+ and CTIP2+ neurons in E18.5 cortex of Ppil1R131Q/R131Q (L), Ppil1R55A/R55A (M), Prp17P95A/P95A (N), and littermate controls. n = 3 mice/genotype. (O) Semi-quantitative RT-PCR analysis of significant RI events in Ppil1A99T/A99T among E14.5 brains of Ppil1R131Q/R131Q (red), Ppil1R55A/R55A (blue), Prp17P95A/P95A (green), and littermate controls. GAPDH as loading control. (P) Quantification of percent splicing inclusion (PSI) for RI events. n = 3 for each genotype. Mean ± s.d.; p-value: ns > 0.05; * <0.05; ** <0.005; *** <0.001; **** <0.0001; one-way ANOVA test for all panels. See also Figure S7.

Comment in

Similar articles

Cited by

References

    1. Adams BM, Coates MN, Jackson SR, Jurica MS, and Davis TL (2015). Nuclear cyclophilins affect spliceosome assembly and function in vitro. Biochem J 469, 223–233. - PMC - PubMed
    1. Agafonov DE, Deckert J, Wolf E, Odenwalder P, Bessonov S, Will CL, Urlaub H, and Luhrmann R. (2011). Semiquantitative proteomic analysis of the human spliceosome via a novel two-dimensional gel electrophoresis method. Mol Cell Biol 31, 2667–2682. - PMC - PubMed
    1. Akizu N, Cantagrel V, Schroth J, Cai N, Vaux K, McCloskey D, Naviaux RK, Van Vleet J, Fenstermaker AG, Silhavy JL, et al. (2013). AMPD2 regulates GTP synthesis and is mutated in a potentially treatable neurodegenerative brainstem disorder. Cell 154, 505–517. - PMC - PubMed
    1. Bertram K, Agafonov DE, Liu WT, Dybkov O, Will CL, Hartmuth K, Urlaub H, Kastner B, Stark H, and Luhrmann R. (2017). Cryo-EM structure of a human spliceosome activated for step 2 of splicing. Nature 542, 318–323. - PubMed
    1. Bessonov S, Anokhina M, Krasauskas A, Golas MM, Sander B, Will CL, Urlaub H, Stark H, and Luhrmann R. (2010). Characterization of purified human Bact spliceosomal complexes reveals compositional and morphological changes during spliceosome activation and first step catalysis. RNA 16, 2384–2403. - PMC - PubMed

Publication types

MeSH terms

Supplementary concepts