. 2020 Dec 15;53(6):1215-1229.e8.
doi: 10.1016/j.immuni.2020.10.020. Epub 2020 Nov 20.

Antagonistic Inflammatory Phenotypes Dictate Tumor Fate and Response to Immune Checkpoint Blockade

Affiliations

Antagonistic Inflammatory Phenotypes Dictate Tumor Fate and Response to Immune Checkpoint Blockade

Eduardo Bonavita et al. Immunity. .

Abstract

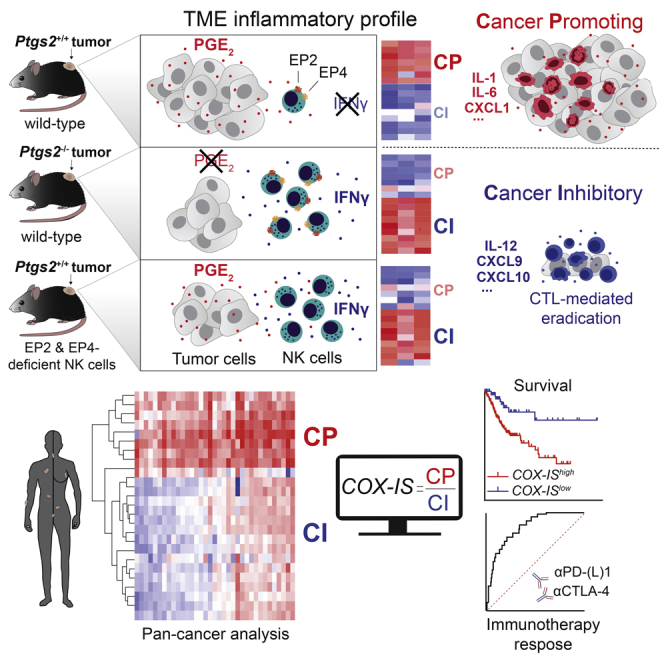
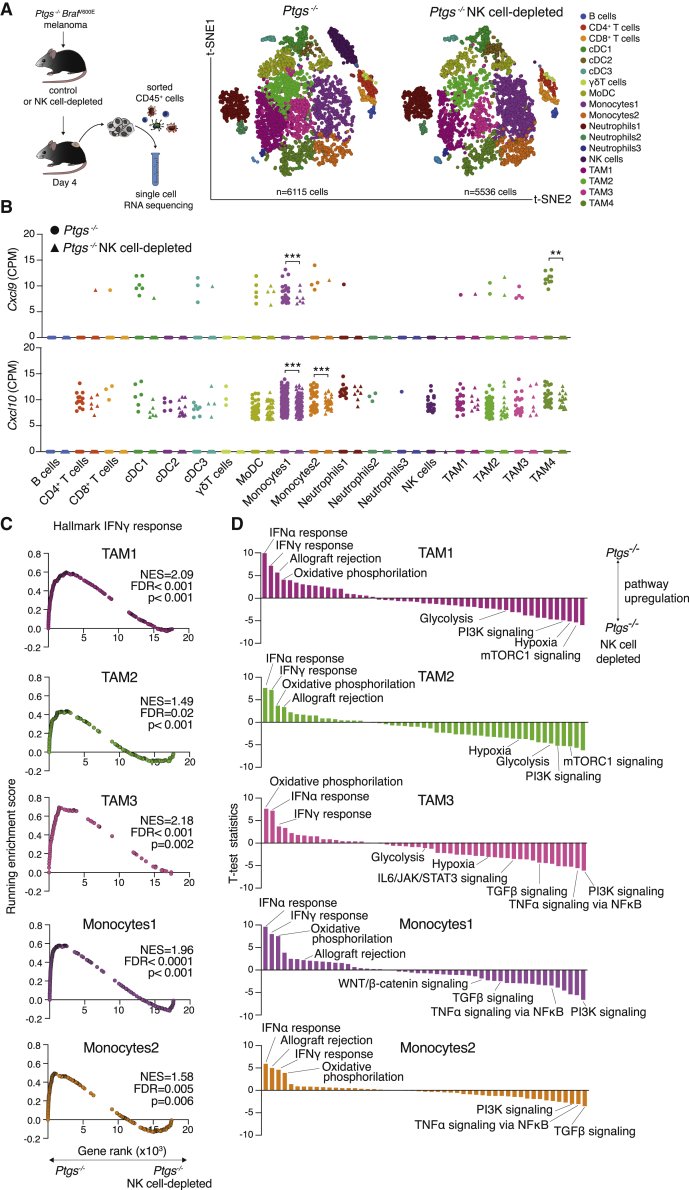
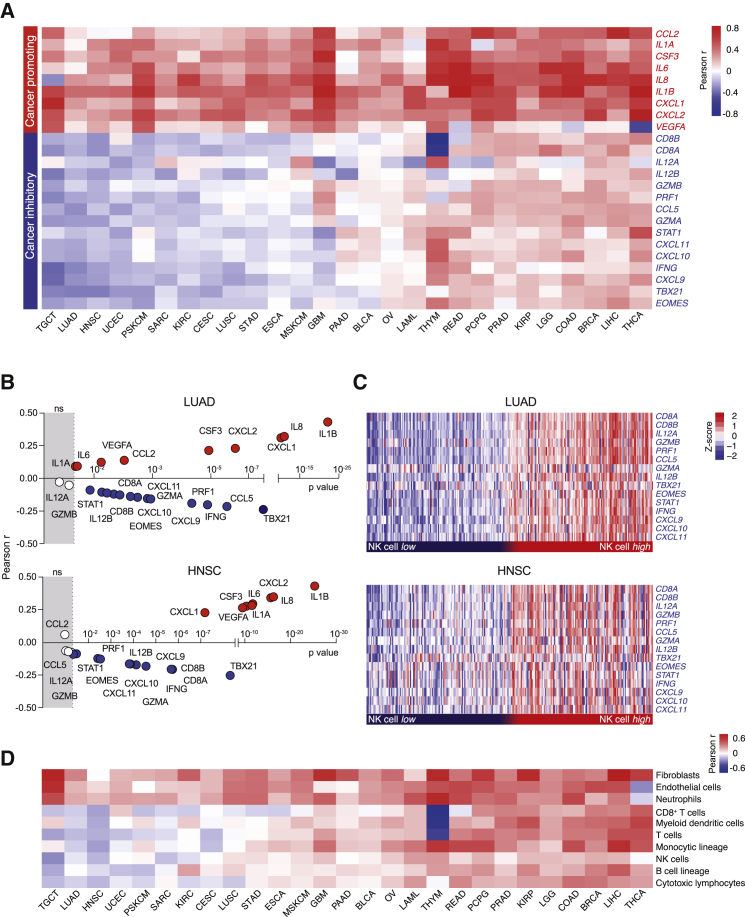
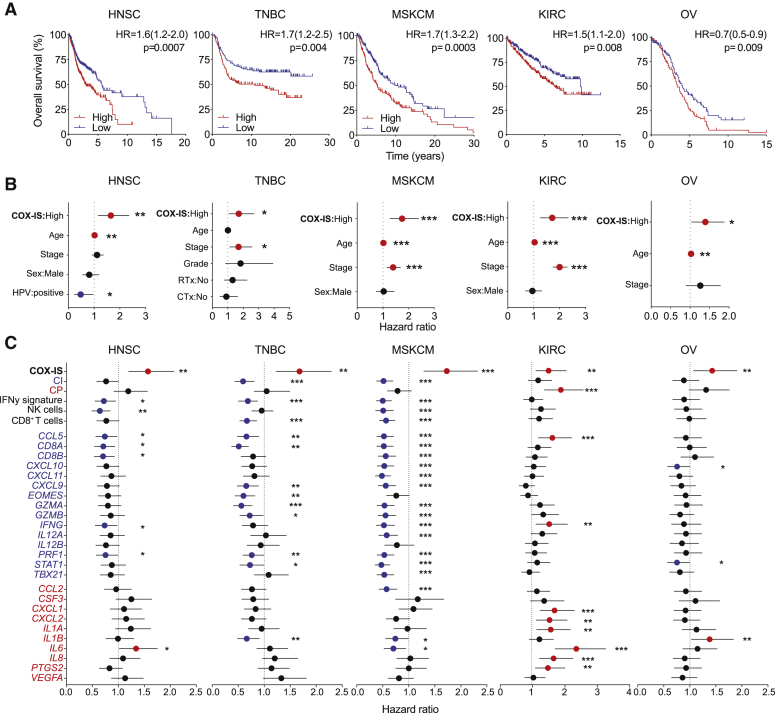
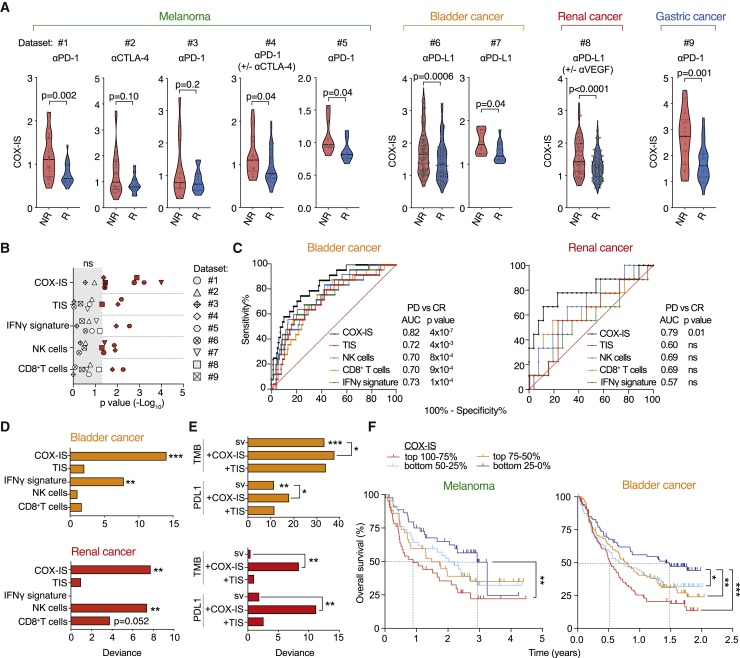
Inflammation can support or restrain cancer progression and the response to therapy. Here, we searched for primary regulators of cancer-inhibitory inflammation through deep profiling of inflammatory tumor microenvironments (TMEs) linked to immune-dependent control in mice. We found that early intratumoral accumulation of interferon gamma (IFN-γ)-producing natural killer (NK) cells induced a profound remodeling of the TME and unleashed cytotoxic T cell (CTL)-mediated tumor eradication. Mechanistically, tumor-derived prostaglandin E2 (PGE2) acted selectively on EP2 and EP4 receptors on NK cells, hampered the TME switch, and enabled immune evasion. Analysis of patient datasets across human cancers revealed distinct inflammatory TME phenotypes resembling those associated with cancer immune control versus escape in mice. This allowed us to generate a gene-expression signature that integrated opposing inflammatory factors and predicted patient survival and response to immune checkpoint blockade. Our findings identify features of the tumor inflammatory milieu associated with immune control of cancer and establish a strategy to predict immunotherapy outcomes.

Keywords: NK cells; cancer-related inflammation; cytotoxic T cells; immune evasion; immunotherapy; interferon-gamma; prostaglandin E2; tumor immunity; tumor microenvironment.


Conflict of interest statement

Declaration of Interests The COX-IS is the subject of a patent application (WO2019243567A1) in which E.B., C.P.B., and S.Z. are listed as inventors.

Figures

None
Graphical abstract
Figure 1
Figure 1
Ablation of Cancer Cell-Intrinsic COX Alters the Intratumoral Accumulation of Select Innate Immune Cell Subsets (A) Kaplan-Meier plots showing the fraction of tumor-bearing wild-type (n = 10), Tmem173−/− (n = 5), Cgas−/− (n = 5), Trif−/− (n = 7), Mavs−/− (n = 6), and Myd88−/− (n = 6) mice injected with Ptgs−/− or Ptgs+/+ melanoma tumor cells in wild-type (n = 10) hosts. (B–D) Immune cell infiltrate analysis of Ptgs+/+, Ptgs−/−, and Ptgs−/−+COX-2 tumors 4 days post-implantation. (B) Two-dimensional distributed stochastic neighbor embedding (t-SNE) projections of CD45+ cells for each group (n = 6 concatenated samples per group). The frequency and the number of intratumoral neutrophils (C) and NK cells (D) are shown. (E) Weight of Ptgs+/+ and Ptgs−/− tumors 4 days post-implantation in wild-type, NK cell-depleted, or Rag1−/− mice. (F) Ptgs+/+, Ptgs−/− (+/− synthetic PGE2), and Ptgs−/−+COX-2 melanoma cells tested for susceptibility to NK cell-mediated killing. E:T refers to ratio of effector:target cells. (G) Percentage of NK cells contacting either 1 or more (2–5) Ptgs+/+, Ptgs−/−, or Ptgs−/−+COX2 targets. (H) Violin plots representing the number of interactions and the cumulative contact time of NK cells with Ptgs+/+, Ptgs−/−, and Ptgs−/−+COX-2 targets. Data are expressed as mean ± SEM, one-way ANOVA (C–F and H) or Fisher’s exact test. (G).
Figure 2
Figure 2
NK Cells Contribute to Both Innate and Adaptive Immune Control of Ptgs−/− Tumors (A) Growth profile of Ptgs+/+ and Ptgs−/− melanoma cells implanted into Rag1−/− or wild-type mice untreated or depleted of NK, CD4+, and/or CD8+ cells. (B and C) Frequency of CD8+ T cells (B); representative plots and frequency of CD8+ CD44+, CD8+ IFNγ+, and CD4+ IFNγ+ T cells (C) gated on live, CD45+, CD3ε+ cells in Ptgs+/+ and Ptgs−/− untreated or NK cell-depleted wild-type mice analyzed 7 days post-implantation. (D) Individual growth profiles of Ptgs−/− melanoma cells in wild-type mice depleted of NK cells from the day before or a week after cancer cell implantation. (E) Growth profile of Ptgs+/+ and Ptgs−/− cells in wild-type mice or Ptgs+/+ cells in GPP mice. (F) Tumor weight, NK cell frequency, and number per g of tumor analyzed 4 days after implantation of Ptgs+/+ and Ptgs−/− cells in wild-type or Ptgs+/+ cells in GPP mice. (G) Growth profile of Ptgs+/+ and Ptgs−/− melanoma cells in wild-type or Ptgs+/+ melanoma cells in Ptger2−/− or Gzmb-Cre Ptger4floxed/floxed mice. Data are expressed as mean ± SEM, one-way (B–C and F) or two-way ANOVA (A).
Figure 3
Figure 3
IFNγ-Producing NK Cells Drive an Early Switch toward Cancer Inhibitory Inflammation Characteristic of T Cell-Inflamed Tumors (A) Analysis by RNA sequencing (RNA-seq) of bulk Ptgs+/+ and Ptgs−/− tumors in wild-type mice or Ptgs−/− tumors from NK cell-depleted mice 4 days post-implantation. GSEA of a hallmark IFN-γ response gene set in Ptgs−/− tumors compared to that of Ptgs+/+ or Ptgs−/− tumors from NK cell-depleted mice. False discovery rate (FDR) was calculated using GSEA. (B) Percentage of intratumoral IFN-γ+ NK cells and tumor weight of Ptgs+/+and Ptgs−/− tumors in wild-type mice or Ptgs−/− in Ifng−/− mice 4 days post-implantation. (C) Tumor growth of Ptgs+/+and Ptgs−/− tumors in wild-type mice or Ptgs−/− in Ifng−/− mice. (D) Gene expression of factors associated with CP (red) or CI (blue) inflammation normalized to Gapdh in NK cell-competent or -depleted mice injected with Ptgs+/+ or Ptgs−/− melanoma cells. (E) Expression levels of CI genes in Ptgs+/+ tumors in wild-type mice (n = 16) or in Ptgs−/− tumors in NK cell-competent (n = 16) or -depleted (n = 9) wild-type, Rag1−/− (n = 9), and Ifng−/− (n = 8) mice. Data are normalized to Gapdh and expressed as mean ± SEM of the fold change of the average expression in Ptgs+/+ tumors. One-way ANOVA followed by multiple comparisons (Dunnet) against levels in Ptgs−/− tumors from wild-type mice.
Figure 4
Figure 4
Single-Cell RNA-Seq Uncovers a Broad NK Cell-Driven Myeloid Cell Reprogramming from Pro-tumorigenic to Anti-tumorigenic Pathways Single-cell RNA-seq of 11,651 CD45+ cells isolated from pooled tumors from wild-type or NK cell-depleted Ptgs−/− tumor-bearing mice. (A) t-SNE plots showing the clustering and distribution. Each point represents a single cell colored according to cluster designation. (B) Cxcl9 and Cxcl10 gene expression analysis in all cell clusters shown in (A). Data are expressed as normalized counts-per-million (CPM), unpaired Student’s t test. (C) Enrichment analysis for hallmark IFN-γ response gene set in various monocyte and TAM clusters. (D) Single-sample GSEA of all hallmark gene sets in the same myeloid populations as in (C).
Figure 5
Figure 5
COX-2 Expression Delineates Cancer-Promoting from Cancer-Inhibitory Inflammation in Human Cancers (A) Heatmap showing the Pearson correlation coefficient of PTGS2 expression with the mouse-derived COX-IS genes across various human datasets from TCGA: testicular germ cell tumors (TGCT; n = 155), lung adenocarcinoma (LUAD; n = 512), head and neck squamous cell carcinoma (HNSC; n = 517), uterine corpus endometrial carcinoma (UCEC; n = 530), primary skin cutaneous melanoma (PSKCM; n = 115), sarcoma (SARC; n = 259), kidney renal clear cell carcinoma (KIRC;, n = 516), cervical and endocervical cancers (CESCs; n = 305), lung squamous cell carcinoma (LUSC; n = 487), stomach adenocarcinoma (STAD; n = 412), esophageal carcinoma (ESCA; n = 183), metastatic skin cutaneous melanoma (MSKCM; n = 357), pancreatic adenocarcinoma (PAAD; n = 178), glioblastoma multiforme (GBM; n = 166), bladder urothelial carcinoma (BLCA; n = 408), ovarian cancer (OV; n = 305), acute myeloid leukemia (LAML; n = 173), thymoma (THYM; n = 120), rectum adenocarcinoma (READ; n = 156), prostate adenocarcinoma (PRAD; n = 495), pheochromocytoma and paraganglioma (PCPG; n = 183), kidney renal papillary cell carcinoma (KIRP; n = 286), brain lower grade glioma (LGG; n = 528), colon adenocarcinoma (COAD; n = 445), breast invasive carcinoma (BRCA; n = 976), liver hepatocellular carcinoma (LIHC; n = 370), and thyroid carcinoma (THCA; n = 507). (B) Correlation analysis of PTGS2 against COX-IS genes in LUAD and HNSC datasets. The Pearson coefficient and the corresponding p value are shown. (C) CI gene expression in NK cell high (top 25%) and NK cell low (bottom 25%) tumors stratified based on an NK cell-specific gene signature (see also Table S4) in LUAD and HNSC datasets. (D) Pearson correlation coefficient of PTGS2 expression with the indicated cell populations defined using the Microenvironment cell population (MCP) counter algorithm in all datasets shown in (A).
Figure 6
Figure 6
The COX-IS Is an Independent Prognostic Factor across Various Cancer Types (A–C) Survival analysis of HNSC (TCGA, n = 517), TNBC (METABRIC, n = 251), MSKCM (TCGA, n = 357), KIRC (TCGA, n = 516), and OV (TCGA, n = 305) patients stratified according to the COX-IS. (A) Kaplan-Meier survival plots parsed as high versus low on a median cutoff for COX-IS. (B) Forest plots showing a multivariate Cox regression analysis for the indicated risk factors in HNSC, MSKCM, TNBC, KIRC, and OV. (C) Hazard ratio associated with the indicated gene signatures or the individual gene elements of the COX-IS. Hazard ratio (95% confidence interval [CI]), log-rank (Mantel-Cox) test (A–C).
Figure 7
Figure 7
The COX-IS Predicts Response to ICB in Different Tumor Types (A) Analysis of COX-IS at baseline in responder (R) and non-responder (NR) groups in melanoma (dataset 1: Riaz et al., 2017; 2: Van Allen et al., 2015; 3: Hugo et al., 2016; 4: Gide et al., 2019; 5: Chen et al., 2016), bladder (dataset 6: Mariathasan et al., 2018; 7: Snyder et al., 2017), renal (dataset 8: McDermott et al., 2018), and gastric (dataset 9: Kim et al., 2018) cancer patients as defined in the original studies (see STAR Methods). (B) Analysis of COX-IS; TIS; and IFN-γ, NK cell, and CD8+ T cell signatures (see Table S4) at baseline in R and NR patients shown in (A). The p value (−log10) for each comparison is plotted. (C) ROC analysis for COX-IS; TIS; and IFN-γ, NK cell, and CD8+ T cell signatures in PD versus CR patient from datasets 6 and 8. The area under the ROC curve was used to quantify response prediction. (D and E) Explained variance (deviance) in patient response for generalized linear models fit using single variables (sv) (D) or their combinations with TMB or PD-L1 expression (E) in dataset 6 and 8. Chi-square test was used to compare nested models. (F) Survival of melanoma (pooled datasets 1, 2, 3, and 4) and bladder cancer (dataset 6) patients stratified in quantiles according to their COX-IS. Log-rank (Mantel-Cox) test.

Comment in

References

    1. André P., Denis C., Soulas C., Bourbon-Caillet C., Lopez J., Arnoux T., Bléry M., Bonnafous C., Gauthier L., Morel A. Anti-NKG2A mAb is a checkpoint inhibitor that promotes anti-tumor immunity by unleashing both T and NK cells. Cell. 2018;175 1731–1743.e13. - PMC - PubMed
    1. Ayers M., Lunceford J., Nebozhyn M., Murphy E., Loboda A., Kaufman D.R., Albright A., Cheng J.D., Kang S.P., Shankaran V. IFN-γ-related mRNA profile predicts clinical response to PD-1 blockade. J. Clin. Invest. 2017;127:2930–2940. - PMC - PubMed
    1. Barrow A.D., Edeling M.A., Trifonov V., Luo J., Goyal P., Bohl B., Bando J.K., Kim A.H., Walker J., Andahazy M. Natural killer cells control tumor growth by sensing a growth factor. Cell. 2018;172 534–548.e519. - PMC - PubMed
    1. Barry K.C., Hsu J., Broz M.L., Cueto F.J., Binnewies M., Combes A.J., Nelson A.E., Loo K., Kumar R., Rosenblum M.D. A natural killer-dendritic cell axis defines checkpoint therapy-responsive tumor microenvironments. Nat. Med. 2018;24:1178–1191. - PMC - PubMed
    1. Becht E., Giraldo N.A., Lacroix L., Buttard B., Elarouci N., Petitprez F., Selves J., Laurent-Puig P., Sautès-Fridman C., Fridman W.H., de Reyniès A. Estimating the population abundance of tissue-infiltrating immune and stromal cell populations using gene expression. Genome Biol. 2016;17:218. - PMC - PubMed

Publication types

MeSH terms

Substances