

Differential effects of Hsp90 inhibition on corneal cells in vitro and in vivo
- PMID: 33220237
- PMCID: PMC7856234
- DOI: 10.1016/j.exer.2020.108362
Differential effects of Hsp90 inhibition on corneal cells in vitro and in vivo
Abstract
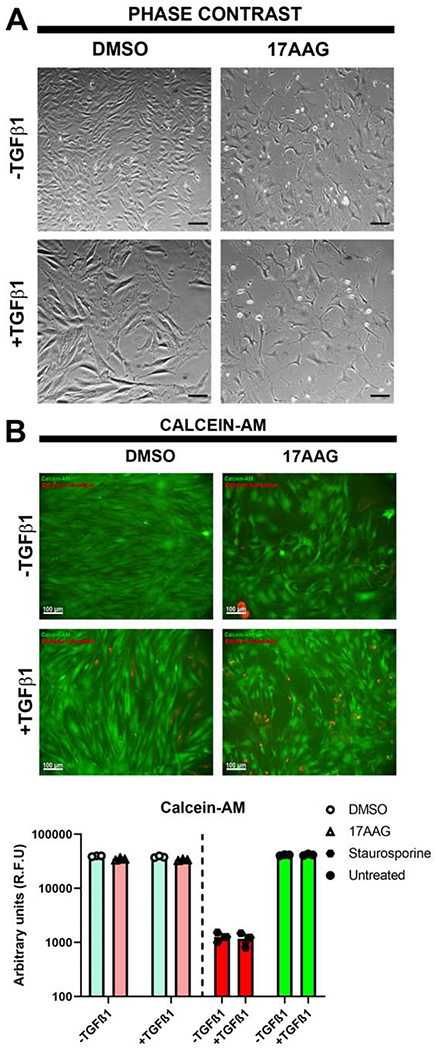
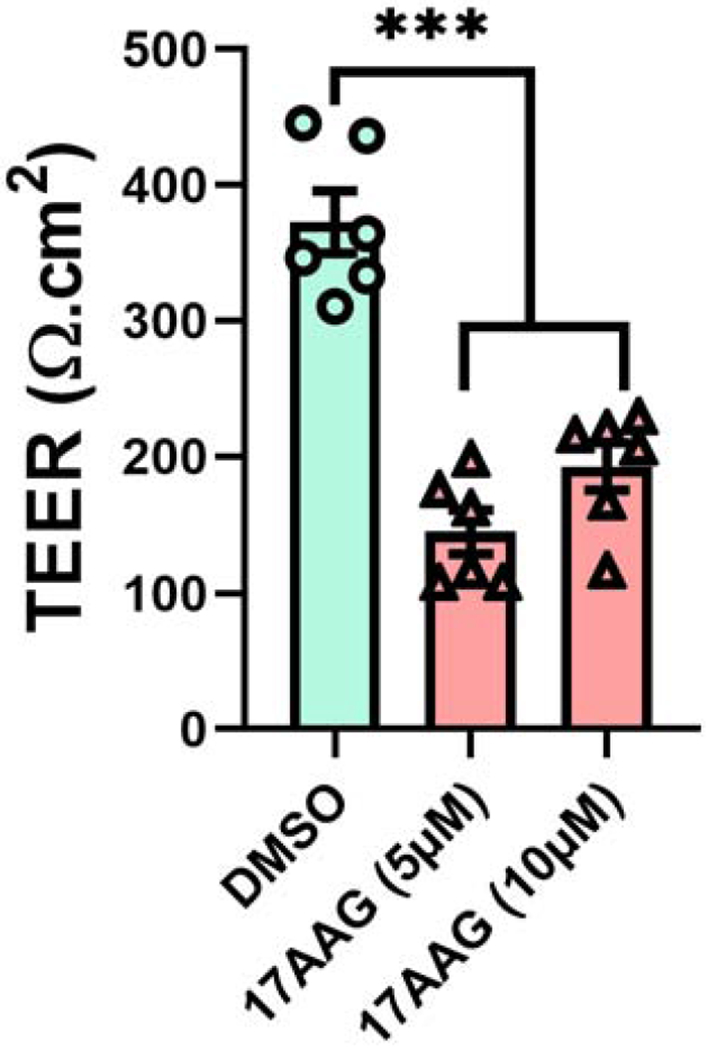
The transformation of quiescent keratocytes to activated fibroblasts and myofibroblasts (KFM transformation) largely depends on transforming growth factor beta (TGFβ) signaling. Initiation of the TGFβ signaling cascade results from binding of TGFβ to the labile type I TGFβ receptor (TGFβRI), which is stabilized by the 90 kDa heat shock protein (Hsp90). Since myofibroblast persistence within the corneal stroma can result in stromal haze and corneal fibrosis in patients undergoing keratorefractive therapy, modulation of TGFβ signaling through Hsp90 inhibition would represent a novel approach to prevent myofibroblast persistence. In vitro, rabbit corneal fibroblasts (RCFs) or stratified immortalized human corneal epithelial cells (hTCEpi) were treated with a Hsp90 inhibitor (17AAG) in the presence/absence of TGFβ1. RCFs were cultured either on tissue culture plastic, anisotropically patterned substrates, and hydrogels of varying stiffness. Cellular responses to both cytoactive and variable substrates were assessed by morphologic changes to the cells, and alterations in expression patterns of key keratocyte and myofibroblast proteins using PCR, Western blotting and immunocytochemistry. Transepithelial electrical resistance (TEER) measurements were performed to establish epithelial barrier integrity. In vivo, the corneas of New Zealand White rabbits were wounded by phototherapeutic keratectomy (PTK) and treated with 17AAG (3× or 6× daily) either immediately or 7 days after wounding for 28 days. Rabbits underwent clinical ophthalmic examinations, SPOTS scoring and advanced imaging on days 0, 1, 3, 7, 10, 14, 21 and 28. On day 28, rabbits were euthanized and histopathology/immunohistochemistry was performed. In vitro data demonstrated that 17AAG inhibited KFM transformation with the de-differentiation of spindle shaped myofibroblasts to dendritic keratocyte-like cells accompanied by significant upregulation of corneal crystallins and suppression of myofibroblast markers regardless of TGFβ1 treatment. RCFs cultured on soft hydrogels or patterned substrates exhibited elevated expression of α-smooth muscle actin (αSMA) in the presence of 17AAG. Treatment of hTCEpi cells disrupted zonula occludens 1 (ZO-1) adherens junction formation. In vivo, there were no differences detected in nearly all clinical parameters assessed between treatment groups. However, rabbits treated with 17AAG developed greater stromal haze formation compared with controls, irrespective of frequency of administration. Lastly, there was increased αSMA positive myofibroblasts in the stroma of 17AAG treated animals when compared with controls. Hsp90 inhibition promoted reversion of the myofibroblast to keratocyte phenotype, although this only occurred on rigid substrates. By contrast, in vivo Hsp90 inhibition was detrimental to corneal wound healing likely due to impairment in corneal epithelial closure and barrier function restoration. Collectively, our data demonstrated a strong interplay in vitro between biophysical cues and soluble signaling molecules in determining corneal stromal cell phenotype.
Copyright © 2020 Elsevier Ltd. All rights reserved.
Figures


Similar articles
-
Latrunculin B and substratum stiffness regulate corneal fibroblast to myofibroblast transformation.Exp Eye Res. 2018 May;170:101-107. doi: 10.1016/j.exer.2018.02.003. Epub 2018 Feb 6. Exp Eye Res. 2018. PMID: 29421383 Free PMC article.
-
Modulation of human corneal stromal cell differentiation by hepatocyte growth factor and substratum compliance.Exp Eye Res. 2018 Nov;176:235-242. doi: 10.1016/j.exer.2018.09.001. Epub 2018 Sep 5. Exp Eye Res. 2018. PMID: 30193807 Free PMC article.
-
Fibrocyte migration, differentiation and apoptosis during the corneal wound healing response to injury.Exp Eye Res. 2018 May;170:177-187. doi: 10.1016/j.exer.2018.02.018. Epub 2018 Feb 24. Exp Eye Res. 2018. PMID: 29481786 Free PMC article.
-
The corneal fibrosis response to epithelial-stromal injury.Exp Eye Res. 2016 Jan;142:110-8. doi: 10.1016/j.exer.2014.09.012. Exp Eye Res. 2016. PMID: 26675407 Free PMC article. Review.
-
Injury and defective regeneration of the epithelial basement membrane in corneal fibrosis: A paradigm for fibrosis in other organs?Matrix Biol. 2017 Dec;64:17-26. doi: 10.1016/j.matbio.2017.06.003. Epub 2017 Jun 15. Matrix Biol. 2017. PMID: 28625845 Free PMC article. Review.
Cited by
-
Studying the Proliferative Activity of Human Corneal Stromal Cell Populations.Bull Exp Biol Med. 2023 Nov;176(1):105-110. doi: 10.1007/s10517-023-05976-y. Epub 2023 Dec 12. Bull Exp Biol Med. 2023. PMID: 38085398
-
Squishy matters - Corneal mechanobiology in health and disease.Prog Retin Eye Res. 2024 Mar;99:101234. doi: 10.1016/j.preteyeres.2023.101234. Epub 2024 Jan 2. Prog Retin Eye Res. 2024. PMID: 38176611 Free PMC article. Review.
-
The Therapeutic Roles of Recombinant Hsp90α on Cornea Epithelial Injury.Invest Ophthalmol Vis Sci. 2022 Feb 1;63(2):30. doi: 10.1167/iovs.63.2.30. Invest Ophthalmol Vis Sci. 2022. PMID: 35201262 Free PMC article.
-
Metal Oxide Engineered Nanomaterials Modulate Rabbit Corneal Fibroblast to Myofibroblast Transformation.Transl Vis Sci Technol. 2021 Oct 4;10(12):23. doi: 10.1167/tvst.10.12.23. Transl Vis Sci Technol. 2021. PMID: 34661622 Free PMC article.
-
Decreased Hsp90 activity protects against TDP-43 neurotoxicity in a C. elegans model of amyotrophic lateral sclerosis.PLoS Genet. 2024 Dec 26;20(12):e1011518. doi: 10.1371/journal.pgen.1011518. eCollection 2024 Dec. PLoS Genet. 2024. PMID: 39724103 Free PMC article.
References
-
- Amiri A, Noei F, Feroz T, Lee JM, 2007. Geldanamycin Anisimycins Activate Rho and Stimulate Rho- and ROCK-Dependent Actin Stress Fiber Formation. Mol. Cancer Res 5, 933–942. - PubMed
-
- Andersson A-S, Olsson P, Lidberg U, Sutherland D, 2003. The effects of continuous and discontinuous groove edges on cell shape and alignment. Exp. Cell Res 288, 177–188. - PubMed
-
- Bachmann KA, Ghosh R, 2001. The use of in vitro methods to predict in vivo pharmacokinetics and drug interactions. Curr Drug Metab 2, 299–314. - PubMed
Publication types
MeSH terms
Substances
Grants and funding
LinkOut - more resources
Full Text Sources
Other Literature Sources
Medical
