Review
. 2021 Jan;17(1):85-101.
doi: 10.1016/j.hfc.2020.08.007. Epub 2020 Oct 28.

Magnetic Resonance-Based Characterization of Myocardial Architecture

Affiliations
Review

Magnetic Resonance-Based Characterization of Myocardial Architecture

David E Sosnovik. Heart Fail Clin. 2021 Jan.

Abstract

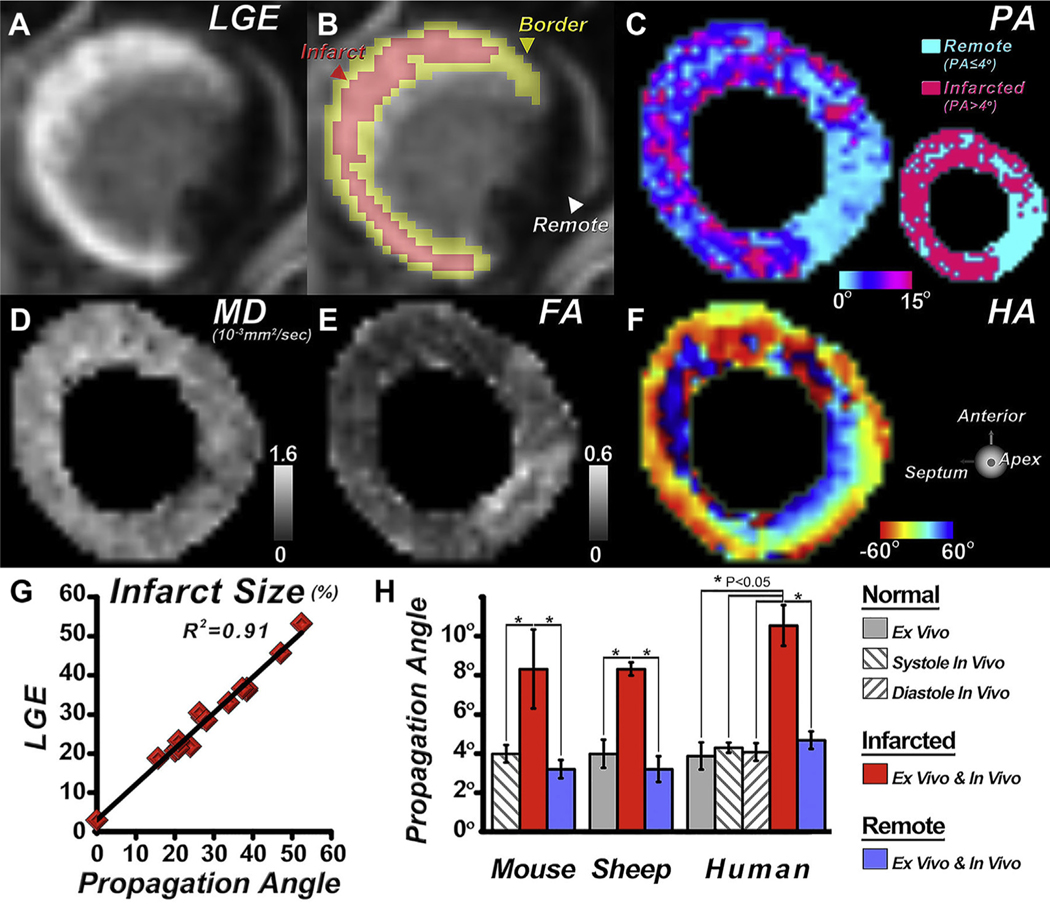
Advances in technology have made it possible to image the microstructure of the heart with diffusion-weighted magnetic resonance. The technique provides unique insights into the cellular architecture of the myocardium and how this is perturbed in a range of disease contexts. In this review, the physical basis of diffusion MRI and the challenges of implementing it in the beating heart are discussed. Cutting edge acquisition and analysis techniques, as well as the results of initial clinical studies, are reported.

Keywords: Cellular architecture; Diffusion tensor; Heart; Magnetic resonance; Microstructure; Myocardium; Tractography.


Conflict of interest statement

Disclosure The Martinos Center for Biomedical Imaging receives research support from Siemens Medical, Erlangen Germany.

Figures

Fig. 1.
Fig. 1.
Cardiomyocyte orientation streamline (COST) tractography of the human heart in vivo. The tracts have been color-coded by the cardiomyocyte helix angle, which ranges from approximately 60° in the subendocardium to −60° in the subepicardium. A magnified view of COST tracts in the lateral wall of the heart is provided in the inset. The COSTs in the midmyocardium are circumferential but in the subendocardium and subepicardium they have a significant longitudinal component and cross over each other with an angle of approximately 120°. (From Mekkaoui C, Reese TG, Jackowski MP, et al. Diffusion tractography of the entire left ventricle by using free-breathing accelerated simultaneous multisection imaging. Radiology. 2017;282(3):850–6; with permission.)
Fig. 2.
Fig. 2.
Ex vivo tractography of the developing and adult human heart. (A–C) COSTs in the lateral wall of the developing human heart at various stages of gestation. By 19 weeks the characteristic crossing pattern of the COST tracts is clear and the heart’s microstructure resembles that of (D) a postnatal human heart (PN). (E) COST tractography of an entire heart at 19 weeks of gestation shows that its microstructure is maturing. (F–H) Ex vivo COST tractography of a small section of the lateral wall in the adult human, sheep, and rat heart, respectively, shows that the architecture of the heart is highly conserved across species. (From [A–E] Mekkaoui C, Porayette P, Jackowski MP, et al. Diffusion MRI tractography of the developing human fetal heart. PloS One. 2013;8(8):e72795; with permission; and [F–H] Mekkaoui C, Huang S, Chen HH, et al. Fiber architecture in remodeled myocardium revealed with a quantitative diffusion CMR tractography framework and histological validation. J Cardiovasc Magn Reson. 2012;14:70; with permission.)
Fig. 3.
Fig. 3.
Pulse sequences for diffusion MRI of the heart. The diffusion-encoding gradients are represented by black rectangles (rise and fall times are ignored), TD is the trigger delay, TE is the echo time, δ is the duration of the diffusion-encoding gradient, and Δ represents the time between diffusion gradients. Breaks in the baseline of the electrocardiogram indicate that the timeline is not drawn to scale. (A) The pulsed gradient spin echo (PGSE) or Stejskal-Tanner sequence has monopolar diffusion-encoding gradients on either side of a 180° refocusing pulse. The sequence is extremely sensitive to motion and has a relatively long TE, but supports high-quality ex vivo imaging. (B) Dual-gated STE sequence, where the diffusion time equals TE/2 plus the mixing time (TM) and is thus equal to 1 RR interval. (C) Velocity- or M1-compensated PGSE sequence with bipolar diffusion-encoding gradients on either side of the 180° refocusing pulse. (D) Acceleration or M2-compensated PGSE sequence where the diffusion-encoding gradients on both sides of the refocusing pulse have a 1–2′−1 configuration. The M1 and M2 compensated PGSE sequences require systems with ultra-high gradient strengths, which allow δ and TE to be kept acceptably short. (From Sosnovik DE, Wang R, Dai G, Reese TG, Wedeen VJ. Diffusion MR tractography of the heart. J Cardiovasc Magn Reson. 2009;11:47; with permission.)
Fig. 4.
Fig. 4.
COST tractography of the human heart in vivo using simultaneous multislice (SMS) excitation. Images of the entire left ventricle and a small section of tissue in the lateral wall are shown. Image quality is well preserved even at an SMS rate of 3, which allows the number of breath-holds to be reduced by a factor of 3. No significant differences are seen in the transmural slope of HA, or the values of MD and FA, between the accelerated and nonaccelerated images. (From Mekkaoui C, Reese TG, Jackowski MP, et al. Diffusion tractography of the entire left ventricle by using free-breathing accelerated simultaneous multisection imaging. Radiology. 2017;282(3):850–6; with permission.)
Fig. 5.
Fig. 5.
Detection and characterization of chronic infarction with diffusion MRI. (A) Swine with 8-week-old infarct, which is well detected by measuring the apparent diffusion coefficient. (B) Ex vivo imaging of a chronic anterior infarct in a rat heart with diffusion spectrum imaging. A complex network of residual myofibers is found in the infarct, particularly at the border zone. (C, D) Microstructural remodeling in the remote zone in sheep with large anteroseptal infarcts. The COST tracts in the lateral wall (remote zone) undergo a rightward/positive shift in their orientation or helix angle. * = statistically significant. (From [A] Nguyen C, Fan Z, Xie Y, et al. In vivo contrast free chronic myocardial infarction characterization using diffusion-weighted cardiovascular magnetic resonance. J Cardiovasc Magn Reson. 2014;16(1):68; with permission; and [B] Sosnovik DE, Wang R, Dai G, et al. Diffusion spectrum MRI tractography reveals the presence of a complex network of residual myofibers in infarcted myocardium. Circ Cardiovasc Imaging. 2009;2(3):206–12; with permission; and [C–D] Mekkaoui C, Huang S, Chen HH, et al. Fiber architecture in remodeled myocardium revealed with a quantitative diffusion CMR tractography framework and histological validation. J Cardiovasc Magn Reson. 2012;14:70; with permission.)
Fig. 6.
Fig. 6.
Diffusion MRI of the heart during acute ischemia and myocardial edema. (A–E) Serial in vivo DTI of the murine heart before and after transient ligation of the left coronary artery. MD maps at baseline (A), 24 hours postinjury (B), and 3 weeks postinjury (C) are shown. Acute injury is associated with a transient increase in MD, which resolves within 3 weeks (arrow). The transient increase in MD (D) is accompanied by a transient decrease in FA (E), which also returns toward baseline. (F–I) MD and T2 are highly correlated in acute ischemia. (F) Microsphere injection showing area-at-risk (AAR). Both T2 (G) and MD (H) are highly increased in the AAR and (I) correlate strongly. (J, K) Serial in vivo tractography. (J) COST tractography at 24 hours reflects both the loss of microstructure and the presence of edema. (K) In vivo tractography of the same mouse 3 weeks later shows the true extent of microstructural damage, without the confounding effects of edema. * = statistically significant. (From Sosnovik DE, Mekkaoui C, Huang S, et al. Microstructural impact of ischemia and bone marrow-derived cell therapy revealed with diffusion tensor magnetic resonance imaging tractography of the heart in vivo. Circulation. 2014;129(17):1731–41; with permission.)
Fig. 7.
Fig. 7.
Definition of the cardiomyocyte orientation or helix angle (HA). Ex vivo tractography of a normal human heart. (A) The HA is defined by the angle of the primary eigenvector with the local radial plane. (B) The cardiomyocytes in the subendocardium have a positive HA and those in the subepicardium a negative HA. Cardiomyocytes in the midmyocardium have low HA values and are circumferential. (C, D) This pattern is highly conserved throughout the heart. It should be stressed that, unlike DNA, the myocytes in the heart are not linked into continuous physical helices. The term HA, although widely used, should be thought of as the cardiomyocyte orientation angle (CAO) at a discrete point. (From Mekkaoui C, Huang S, Chen HH, et al. Fiber architecture in remodeled myocardium revealed with a quantitative diffusion CMR tractography framework and histological validation. J Cardiovasc Magn Reson. 2012;14:70; with permission.)
Fig. 8.
Fig. 8.
Imaging of sheet angle dynamics in the heart. Helix and sheet angle (E2A) maps of a healthy subject and subject with HCM are shown. Visual inspection of the HA maps does not reveal any major differences between systole and diastole or between the healthy control and HCM subject. In contrast, the sheet angle (E2A) is low in diastole and increases substantially during systole in the healthy control. In HCM, however, the sheets fail to assume the characteristic diastolic conformation (low E2A) and the diastolic and systolic E2A maps appear similar. (From Nielles-Vallespin S, Khalique Z, Ferreira PF, et al. Assessment of myocardial microstructural dynamics by in vivo diffusion tensor cardiac magnetic resonance. J Am Coll Cardiol. 2017;69(6):661–76; with permission.)
Fig. 9.
Fig. 9.
Tractography of the heart using the COST propagation angle (PA). (A) The PA is defined as the angle between 2 adjacent segments (primary eigenvectors) in a COST tract, reflecting the change in cardiomyocyte orientation along the tract. Areas of myocardium with low PA are coherent and have a highly ordered microstructure. PA tractography in a human heart (B) in vivo and (C) ex vivo. In most areas of the heart the PA is highly uniform and <4°/voxel. PA values are slightly higher at the right ventricular insertion site and apex. (D) Histograms of PA in the human heart show that most tract segments have a PA <4°, both in vivo and ex vivo. (From Mekkaoui C, Jackowski MP, Kostis WJ, et al. Myocardial scar delineation using diffusion tensor magnetic resonance tractography. J Am
Fig. 10.
Fig. 10.
Detection and characterization of myocardial infarction with diffusion tensor MRI and the COST propagation angle. Short-axis slices of a subject with a large anteroseptal infarct are shown. (A, B) LGE of the infarct with segmentation into infarct, border, and remote zones. (C) PA map, segmented in the inset into infarct and remote zones using a PA threshold of 4°. (D–F) MD in the infarct is increased, FA is decreased, and the transmural distribution of the HA is altered. (G) A high correlation is seen between infarct size calculated by PA and LGE. (H) A PA threshold of 4° accurately detects myocardial infarction across species, with both ex vivo and in vivo imaging. (From Mekkaoui C, Jackowski MP, Kostis WJ, et al. Myocardial scar delineation using diffusion tensor magnetic resonance tractography. J Am Heart Assoc. 2018;7(3); with permission.)
Fig. 11.
Fig. 11.
Detection of microstructural disorder and arrythmogenic substrate using the COST PA. Images of a sheep heart with a large anterior infarct are shown. (A) Segmentation of the infarct and remote zones using a PA threshold of 4°. (B) COST tracts color-coded by PA and the local endocardial voltage, respectively (see inset for voltage map and measurement locations). (C) Histogram of PA in the infarct and remote zones. (D) Regions of the myocardium with a PA <4° have voltages ≥1.5 mV (normal myocardium), those with PA values between 4° and 10° have voltages between 0.5 and 1.5 mV (border zone), and those with a PA >10° have
Fig. 12.
Fig. 12.
Evaluation of myocardial regeneration with diffusion tensor MRI. (A–F) Serial in vivo DTI and tractography in mice with healed infarcts injected with bone marrow mononuclear cells (BMMCs). COST tracts intersecting a region-of-interest in the lateral wall are shown. (A) Normal mouse. (B) Infarcted mouse preinjection and (C) post-BMMC injection. Note the presence of coherent tracts (arrows) in the anterolateral and inferolateral walls, which are lost after injection. (D) Transmural HA plot in the inferolateral (ILat) wall preinjection resembles the uninjured septum. Postinjection, however, the HA slope (black) is severely perturbed. (E) BMMC injection was associated with no change or an increase in MD, a decrease in FA, and the loss of correctly oriented tracts in 11/12 mice. (F) No difference was seen when the donor and recipient strains of the BMMCs were matched or mismatched. (G–I) Serial in vivo DTI in infarcted swine injected with exosomes secreted by cardiosphere-derived cells (CDCs). Injection of the exosomes reduced scar size (arrow) by LGE and in some cases (2/6) resulted in a local restoration of the transmural slope of HA (HAT). (H) The overall effect of exosome injection, however, was to preserve HAT in noninfarcted myocardium and limit infarct expansion. (I) Changes in scar size and HAT both predicted a change in ejection fraction. * = statistically significant. (From [A–F] Sosnovik DE, Mekkaoui C, Huang S, et al. Microstructural impact of ischemia and bone marrow-derived cell therapy revealed with diffusion tensor magnetic resonance imaging tractography of the heart in vivo. Circulation. 2014;129(17):1731–41; with permission; and [G–I] Nguyen CT, Dawkins J, Bi X, Marban E, Li D. Diffusion tensor cardiac magnetic resonance reveals exosomes from cardiosphere-derived cells preserve myocardial fiber architecture after myocardial infarction. JACC Basic Transl Sci. 2018;3(1):97–109; with permission.)
Fig. 13.
Fig. 13.
Diffusion MRI in the detection of cardiac amyloidosis. (A) MD, FA, and native T1 maps in a control subject. (B) MD, FA, native T1, extracellular volume fraction (ECV), LGE, and postcontrast T1 maps in a patient with amyloid. MD is increased and FA is reduced in the subject with amyloid, particularly in those areas showing LGE and increased ECV. (From Gotschy A, von Deuster C, van Gorkum RJH, et al. Characterizing cardiac involvement in amyloidosis using cardiovascular magnetic resonance diffusion tensor imaging. J Cardiovasc Magn Reson. 2019;21(1):56; with permission.)
Fig. 14.
Fig. 14.
Diffusion MRI detects microstructural disarray in HCM. FA was measured using a diffusion-encoded STE sequence in diastole. In healthy subjects, FA in the septum is highest in the midmyocardium. In subjects with HCM, FA in the hypertrophied portions of the septum is reduced. (From Ariga R, Tunnicliffe EM, Manohar SG, et al. Identification of myocardial disarray in patients with hypertrophic cardiomyopathy and ventricular arrhythmias. J Am Coll Cardiol. 2019;73(20):2493–2502; with permission.)

References

    1. Aguirre AD, Vinegoni C, Sebas M, et al. Intravital imaging of cardiac function at the single-cell level. Proc Natl Acad Sci U S A 2014;111(31):11257–62. - PMC - PubMed
    1. Hess AT, Zhong X, Spottiswoode BS, et al. Myocardial 3D strain calculation by combining cine displacement encoding with stimulated echoes (DENSE) and cine strain encoding (SENC) imaging. Magn Reson Med 2009;62(1):77–84. - PMC - PubMed
    1. Scollan DF, Holmes A, Winslow R, et al. Histological validation of myocardial microstructure obtained from diffusion tensor magnetic resonance imaging. Am J Physiol 1998;275(6 Pt 2):H2308–18. - PubMed
    1. Axel L, Wedeen VJ, Ennis DB. Probing dynamic myocardial microstructure with cardiac magnetic resonance diffusion tensor imaging. J Cardiovasc Magn Reson 2014;16:89. - PMC - PubMed
    1. Streeter DD Jr, Spotnitz HM, Patel DP, et al. Fiber orientation in the canine left ventricle during diastole and systole. Circ Res 1969;24(3):339–47. - PubMed

MeSH terms

LinkOut - more resources