Clinical Trial
. 2021 Mar:223:338-347.
doi: 10.1016/j.ajo.2020.11.002. Epub 2020 Nov 19.

Localized Optical Coherence Tomography Precursors of Macular Atrophy and Fibrotic Scar in the Comparison of Age-Related Macular Degeneration Treatments Trials

Affiliations
Clinical Trial

Localized Optical Coherence Tomography Precursors of Macular Atrophy and Fibrotic Scar in the Comparison of Age-Related Macular Degeneration Treatments Trials

Avni P Finn et al. Am J Ophthalmol. 2021 Mar.

Abstract

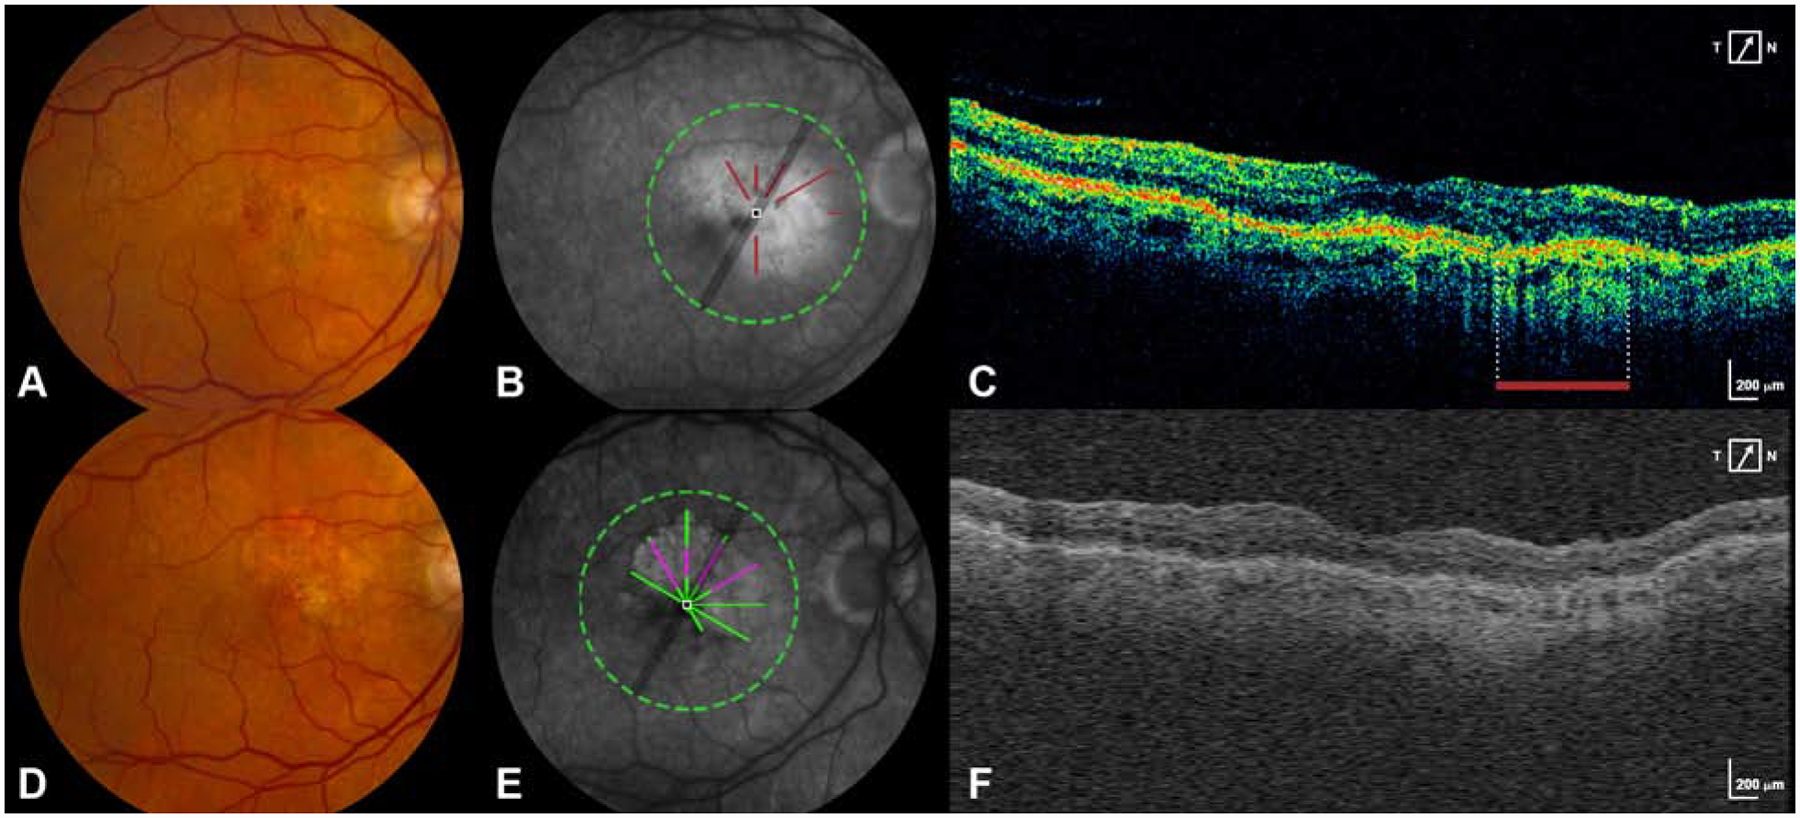
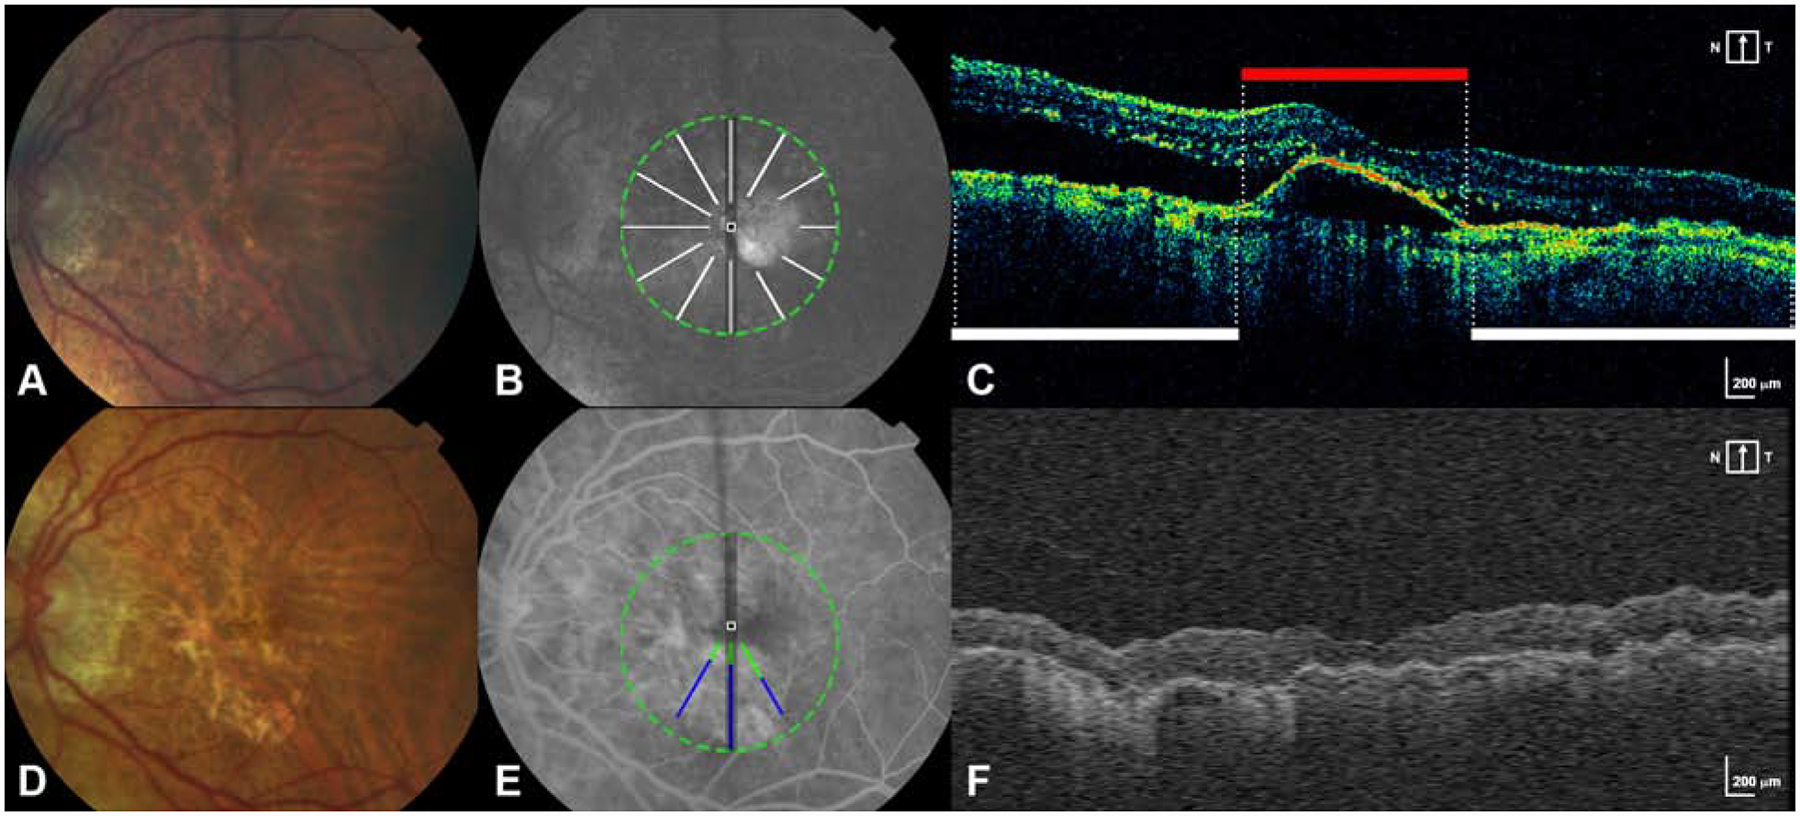
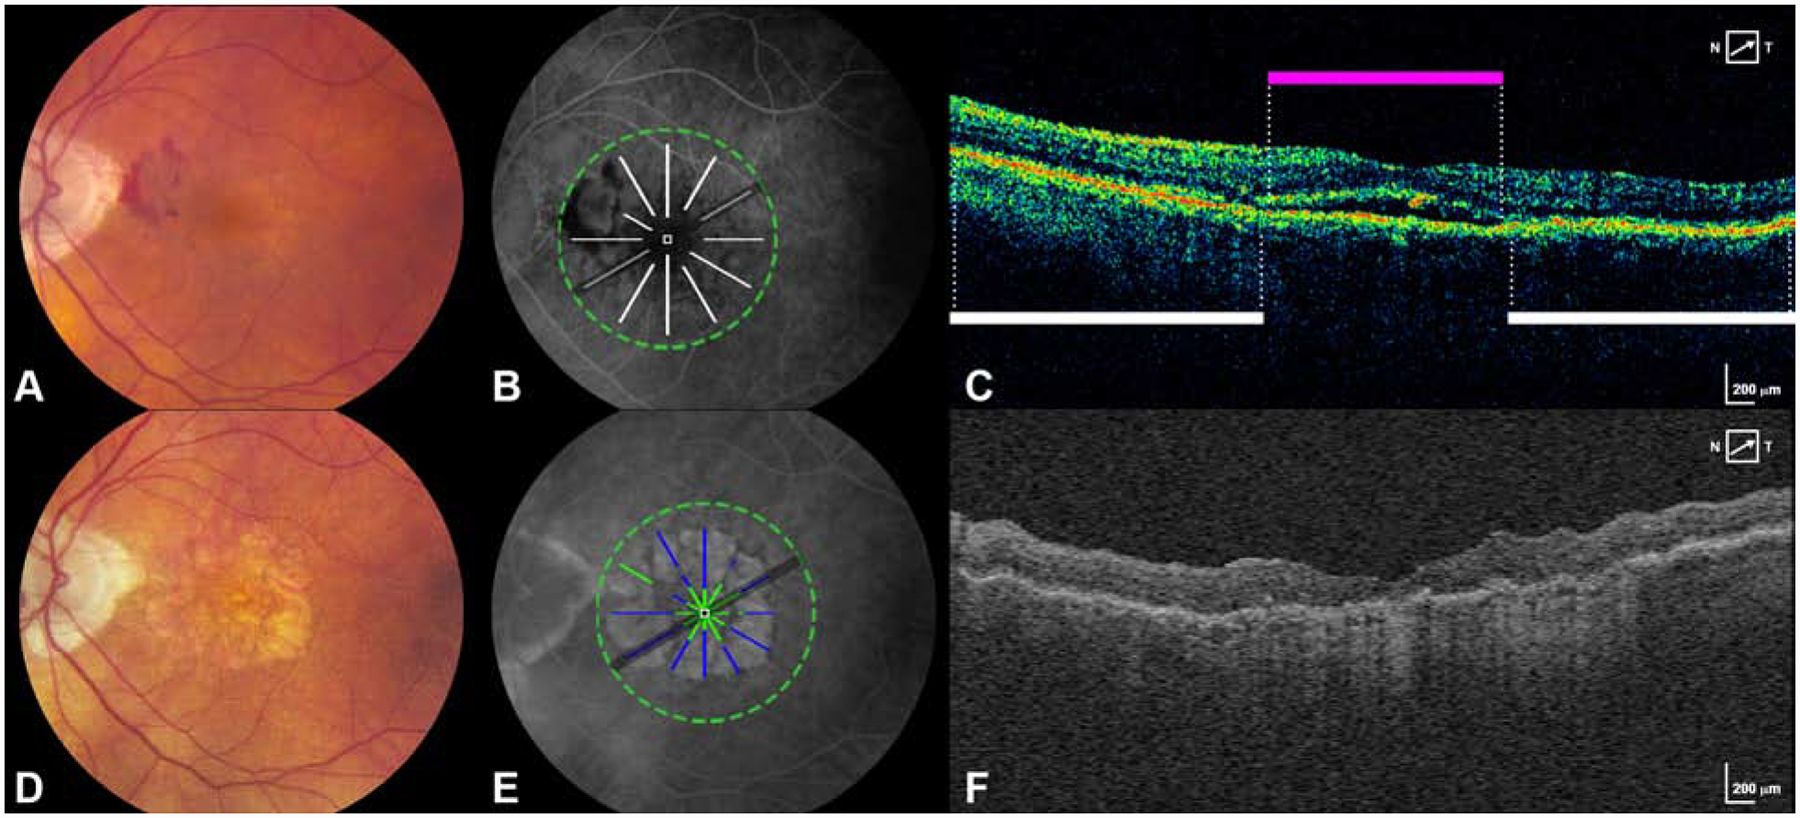
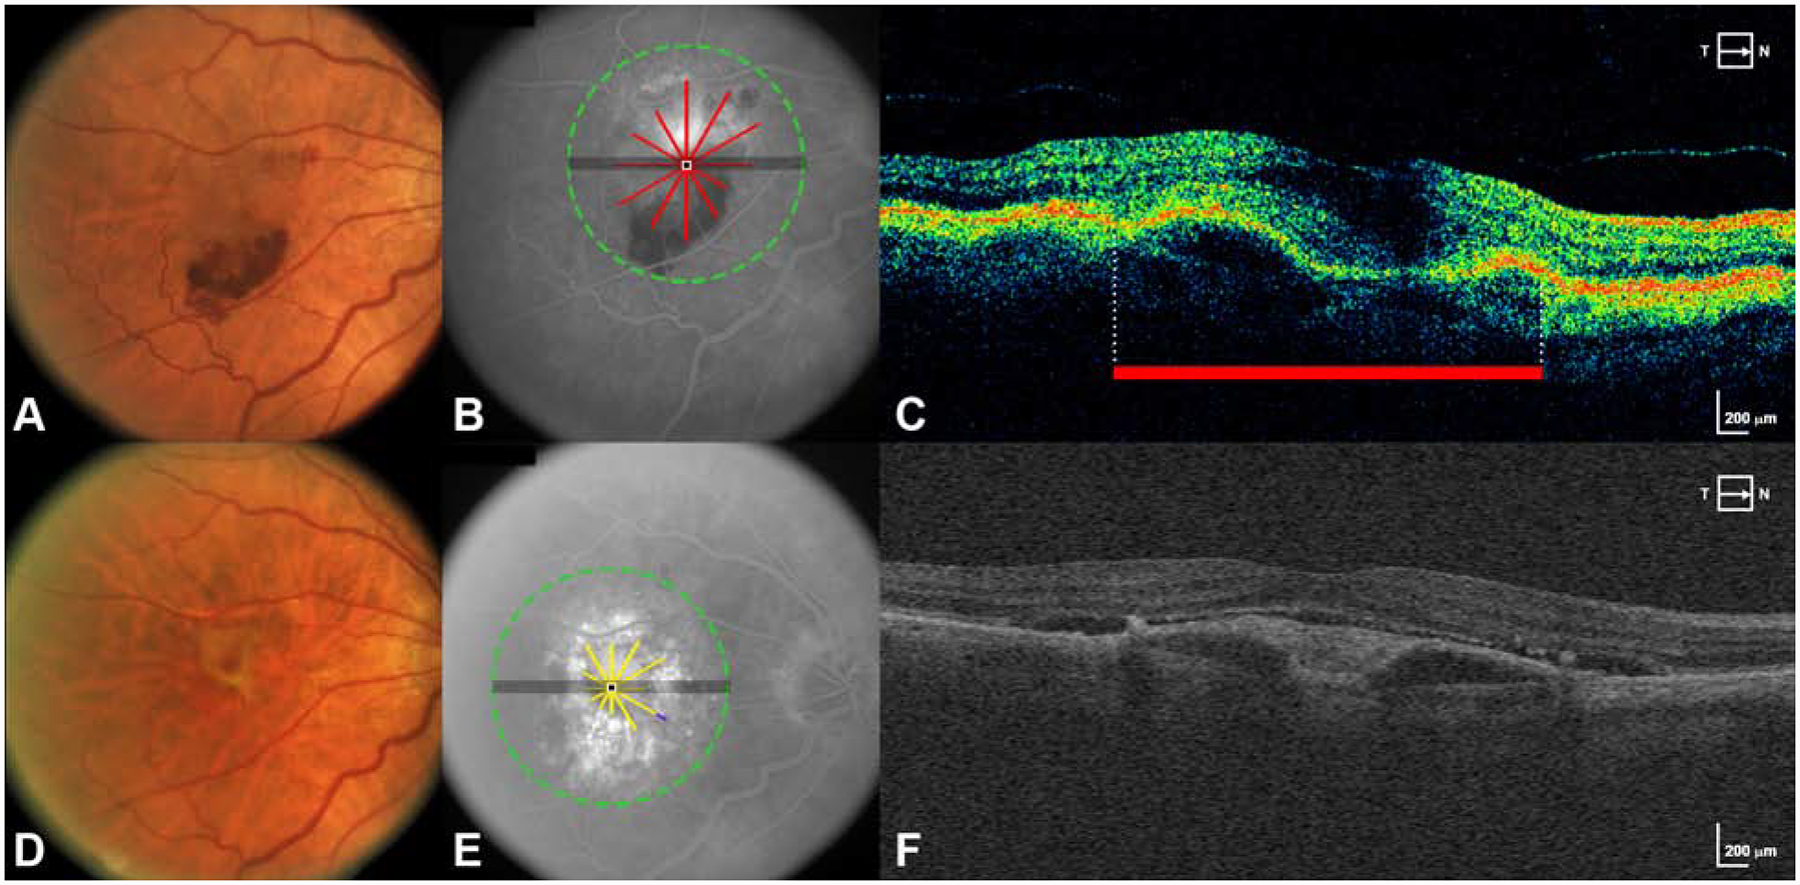
Purpose: To identify precursors of macular atrophy (MA) and of fibrotic scar (FS) in eyes treated with anti-vascular endothelial growth factor through pixel-mapping analysis of baseline optical coherence tomography (OCT).

Methods: Design: Cross-sectional analysis.

Setting: Multicenter clinical trial.

Patient population: 68 eyes from the Comparison of Age-Related Macular Degeneration Treatments Trials.

Intervention: Treatment with anti-vascular endothelial growth factor agents.

Main outcome measure: The percentage of MA or FS pixels with each OCT feature at baseline, and the odds ratio for baseline pixels with an OCT feature to develop MA or FS.

Results: Retinal pigment epithelium atrophy and photoreceptor loss on OCT were highly predictive of MA at that location at years 2 and 5 (P < .0001), but accounted for only 22.5% of the ensuing atrophy at year 2 and less at year 5. Among pixels of MA at year 2, 78% were preceded by thick drusen, 54% by subretinal macular neovascularization (MNV), and 22.5% by no detectable OCT features. MNV, subretinal hyperreflective material, pigment epithelial detachment, intraretinal fluid, and sub-retinal pigment epithelium fluid were predictive of FS at that location (P values <.05). More than 75% of the pixels of FS at years 2 and 5 were preceded by pixels of baseline MNV.

Conclusions: Most pixels of FS were preceded by components of neovascularization. Although one-quarter of MA was accounted for by pre-existing evidence of atrophy on OCT alone, the development of MA in areas of thick drusen, areas with and without subretinal MNV lesion, and areas without detectable OCT precursors argues that the development of MA is multifactorial and may follow, in part, a non-neovascular pathway.


Figures

Figure 1 –
Figure 1 –. New macular atrophy arising from pixels of RPE atrophy with choroidal hypertransmission at baseline.
A. Baseline CFP shows an eye without macular atrophy at baseline. B. FA at baseline is superimposed with the areas of RPE atrophy seen on the baseline OCT scan (brick red lines). C. A B-scan from the baseline OCT scan shows the area of RPE atrophy (delineated by the brick red bar). D. Year 2 CFP shows the development of new macular atrophy. E. FA at year 2 is superimposed with the pixels of MA that developed at year 2 (green+magenta). Magenta represents new MA developing at year 2 in the same location as RPE atrophy on baseline OCT. Green represents new MA developing at year 2 in a location without RPE atrophy on baseline OCT. F. A representative B scan constructed from A-scans of the year 2 SD-OCT volume.
Figure 2 –
Figure 2 –. New macular atrophy can arise from areas with and without preceding MNV lesion at baseline.
A. Baseline CFP shows an eye without macular atrophy at baseline. B. FA at baseline is superimposed with scan areas of pixels without MNV at baseline (white lines). C. A B-scan from the baseline OCT scan delineates area without MNV (white bar) and with MNV lesion/PED (red bar). D. Year 2 CFP shows the development of new macular atrophy. E. FA at year 2 is superimposed with pixels of new MA that developed at year 2 (green+blue). Blue represents new MA arising at year 2 in the same location as pixels without any MNV lesion at baseline. Green represents new MA arising at year 2 in the same location as pixels with MNV lesion at baseline. F. A representative B scan constructed from A-scans of the year 2 SD-OCT volume.
Figure 3 –
Figure 3 –. New macular atrophy can arise from areas without any detectable OCT features at baseline.
A. Baseline CFP shows an eye without macular atrophy at baseline. B. FA at baseline is superimposed with scan areas of pixels without any detectable OCT features at baseline (white lines). C. A B scan at baseline shows locations that were designated as subretinal fluid (magenta bar) and locations without detectable OCT features (white bars). D. Year 2 CFP shows the development of new macular atrophy. E. FA at year 2 is superimposed with pixels of new MA that developed at year 2 (green+blue). Blue represents new MA arising at year 2 in the same location as pixels without any detectable OCT features at baseline. Green represents new MA arising at year 2 in the same location as pixels with detectable OCT features at baseline. F. A representative B scan constructed from A-scans of the year 2 SD-OCT volume.
Figure 4 –
Figure 4 –. New fibrotic scar arises in large part from areas of MNV at baseline.
A. Baseline CFP shows an eye without fibrotic scar at baseline. B. FA at baseline is superimposed with scan areas of pixels with MNV/subretinal lesion at baseline (red lines). C. A B-scan from the baseline OCT scan delineates area with MNV/subretinal lesion (red bar). D. CFP at year 2 shows the development of fibrotic scar. E. FA at year 2 is superimposed with pixels of new FS that developed at year 2 (yellow and purple lines). Yellow is pixels of FS at year 2 arising in the same location as subretinal MNV lesion at baseline. Purple is pixels of FA at year 2 arising in locations without subretinal MNV lesion at baseline. F. A representative B scan constructed from A-scans of the year 2 SD-OCT volume.

Similar articles

Cited by

References

    1. Comparison of Age-related Macular Degeneration Treatments Trials (CATT) Research Group. Five-Year Outcomes with Anti-Vascular Endothelial Growth Factor Treatment of Neovascular Age-Related Macular Degeneration. Ophthalmology. 2016;123(8):1751–1761. doi:10.1016/j.ophtha.2016.03.045 - DOI - PMC - PubMed
    1. Rofagha S, Bhisitkul RB, Boyer DS, Sadda SR, Zhang K, SEVEN-UP Study Group. Seven-Year Outcomes in Ranibizumab-Treated Patients in ANCHOR, MARINA, and HORIZON. Ophthalmology. 2013;120(11):2292–2299. - PubMed
    1. Jaffe GJ, Ying G-S, Toth CA, et al. Macular Morphology and Visual Acuity in Year Five of the Comparison of Age-related Macular Degeneration Treatments Trials (CATT). Ophthalmology. September 2018. - PMC - PubMed
    1. Ying G, Kim BJ, Maguire MG, et al. Sustained Visual Acuity Loss in the Comparison of Age-Related Macular Degeneration Treatments Trials. JAMA Ophthalmol. 2014;132(8):915. - PMC - PubMed
    1. Grunwald JE, Daniel E, Huang J, et al. Risk of Geographic Atrophy in the Comparison of Age-related Macular Degeneration Treatments Trials. Ophthalmology. 2014;121(1):150–161. - PMC - PubMed

MeSH terms

Substances