

A novel Oct4/Pou5f1-like non-coding RNA controls neural maturation and mediates developmental effects of ethanol
- PMID: 33221301
- PMCID: PMC7856281
- DOI: 10.1016/j.ntt.2020.106943
A novel Oct4/Pou5f1-like non-coding RNA controls neural maturation and mediates developmental effects of ethanol
Abstract
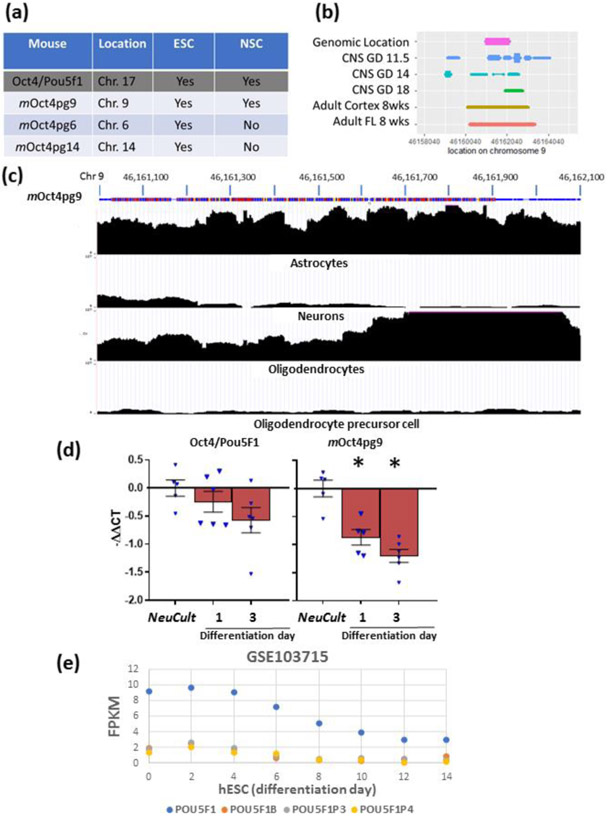
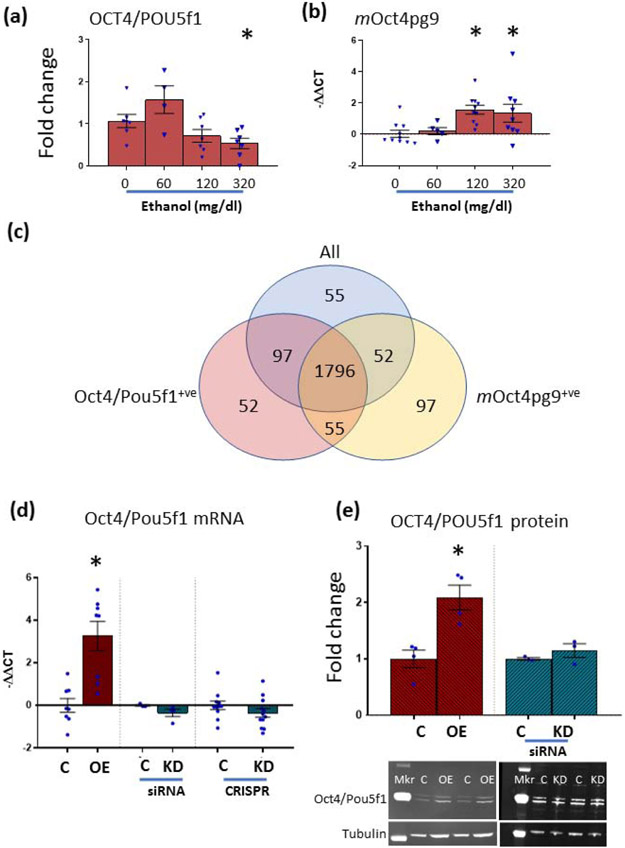
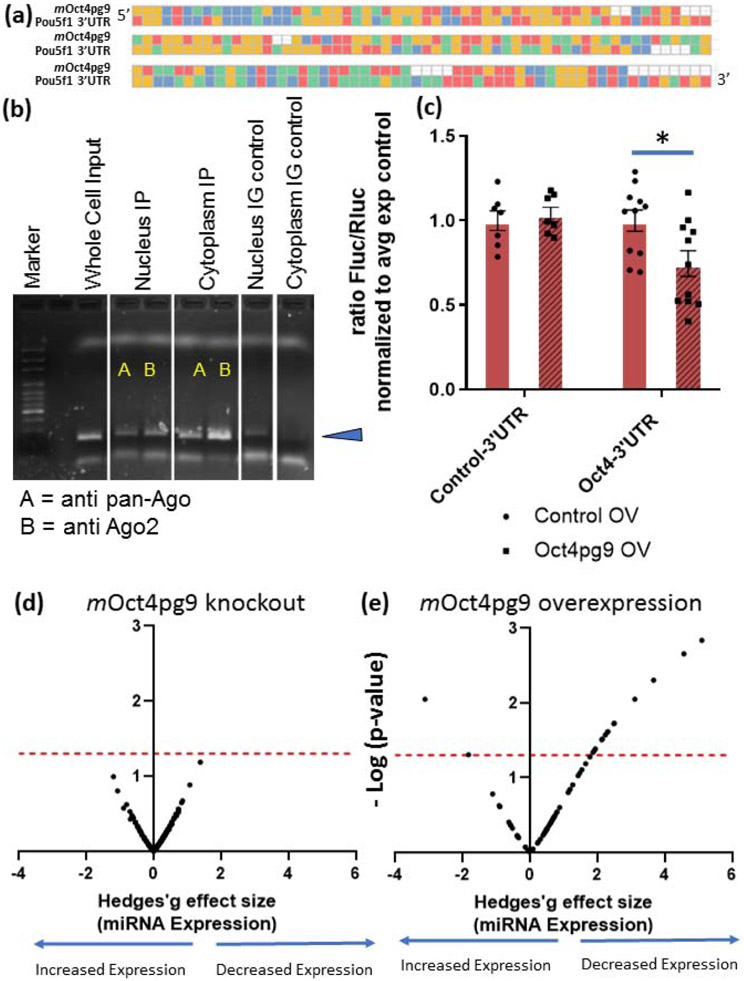
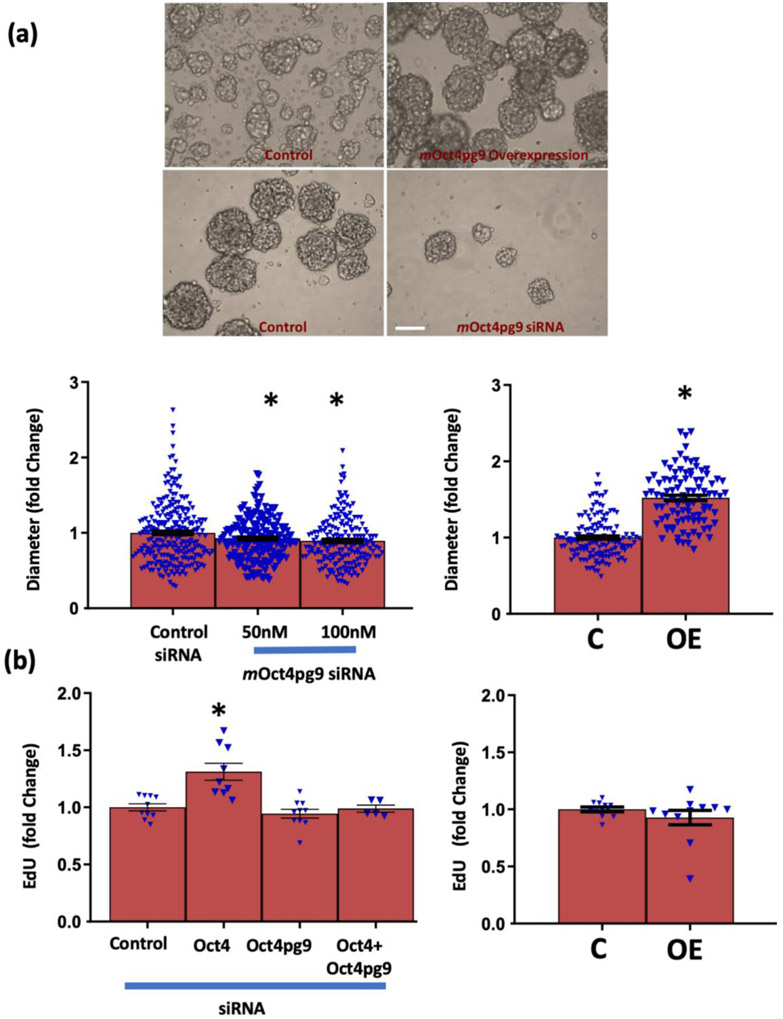
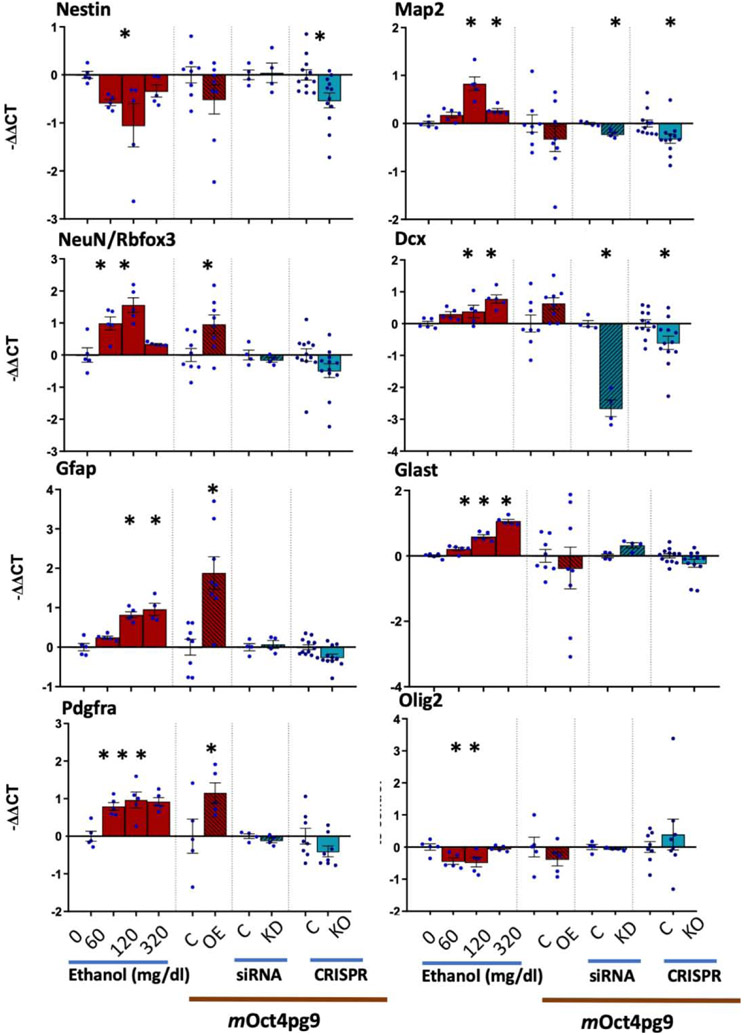
Prenatal ethanol exposure can result in loss of neural stem cells (NSCs) and decreased brain growth. Here, we assessed whether a noncoding RNA (ncRNA) related to the NSC self-renewal factor Oct4/Pou5f1, and transcribed from a processed pseudogene locus on mouse chromosome 9 (mOct4pg9), contributed to the loss of NSCs due to ethanol. Mouse fetal cortical-derived NSCs, cultured ex vivo to mimic the early neurogenic environment of the fetal telencephalon, expressed mOct4pg9 ncRNA at significantly higher levels than the parent Oct4/Pou5f1 mRNA. Ethanol exposure increased expression of mOct4pg9 ncRNA, but decreased expression of Oct4/Pou5f1. Gain- and loss-of-function analyses indicated that mOct4pg9 overexpression generally mimicked effects of ethanol exposure, resulting in increased proliferation and expression of transcripts associated with neural maturation. Moreover, mOct4pg9 associated with Ago2 and with miRNAs, including the anti-proliferative miR-328-3p, whose levels were reduced following mOct4pg9 overexpression. Finally, mOct4pg9 inhibited Oct4/Pou5f1-3'UTR-dependent protein translation. Consistent with these observations, data from single-cell transcriptome analysis showed that mOct4pg9-expressing progenitors lack Oct4/Pou5f1, but instead overexpress transcripts for increased mitosis, suggesting initiation of transit amplification. Collectively, these data suggest that the inhibitory effects of ethanol on brain development are explained, in part, by a novel ncRNA which promotes loss of NSC identity and maturation.
Keywords: FASD; Fetal neural progenitor cells; Neural development; Oct4/Pou5f1; Pseudogene; miRNAs; ncRNA.
Copyright © 2020 The Author(s). Published by Elsevier Inc. All rights reserved.
Conflict of interest statement
DECLARATION OF INTEREST
The Authors declare no conflict of interest.
Figures
Similar articles
-
The BAF (BRG1/BRM-Associated Factor) chromatin-remodeling complex exhibits ethanol sensitivity in fetal neural progenitor cells and regulates transcription at the miR-9-2 encoding gene locus.Alcohol. 2017 May;60:149-158. doi: 10.1016/j.alcohol.2017.01.003. Epub 2017 Apr 7. Alcohol. 2017. PMID: 28438527 Free PMC article.
-
Ethanol Exposure Increases miR-140 in Extracellular Vesicles: Implications for Fetal Neural Stem Cell Proliferation and Maturation.Alcohol Clin Exp Res. 2019 Jul;43(7):1414-1426. doi: 10.1111/acer.14066. Epub 2019 May 14. Alcohol Clin Exp Res. 2019. PMID: 31009095 Free PMC article.
-
Gag-like proteins: Novel mediators of prenatal alcohol exposure in neural development.Alcohol Clin Exp Res. 2022 Apr;46(4):556-569. doi: 10.1111/acer.14796. Epub 2022 Mar 2. Alcohol Clin Exp Res. 2022. PMID: 35187673 Free PMC article.
-
Potential roles of imprinted genes in the teratogenic effects of alcohol on the placenta, somatic growth, and the developing brain.Exp Neurol. 2022 Jan;347:113919. doi: 10.1016/j.expneurol.2021.113919. Epub 2021 Nov 6. Exp Neurol. 2022. PMID: 34752786 Review.
-
An Overview of the Mechanisms of Abnormal GABAergic Interneuronal Cortical Migration Associated with Prenatal Ethanol Exposure.Neurochem Res. 2017 May;42(5):1279-1287. doi: 10.1007/s11064-016-2169-5. Epub 2017 Feb 3. Neurochem Res. 2017. PMID: 28160199 Review.
Cited by
-
Recent Advances in the Role of Non-coding RNAs in Fetal Alcohol Spectrum Disorders.Adv Exp Med Biol. 2025;1473:129-155. doi: 10.1007/978-3-031-81908-7_7. Adv Exp Med Biol. 2025. PMID: 40128478 Review.
-
Microbiota and nutrition as risk and resiliency factors following prenatal alcohol exposure.Front Neurosci. 2023 Jun 15;17:1182635. doi: 10.3389/fnins.2023.1182635. eCollection 2023. Front Neurosci. 2023. PMID: 37397440 Free PMC article. Review.
-
Fetal alcohol spectrum disorders.Nat Rev Dis Primers. 2023 Feb 23;9(1):11. doi: 10.1038/s41572-023-00420-x. Nat Rev Dis Primers. 2023. PMID: 36823161 Review.
-
Ablation of OCT4 function in cattle embryos by double electroporation of CRISPR-Cas for DNA and RNA targeting (CRISPR-DART).PNAS Nexus. 2023 Oct 20;2(11):pgad343. doi: 10.1093/pnasnexus/pgad343. eCollection 2023 Nov. PNAS Nexus. 2023. PMID: 37954164 Free PMC article.
-
Dose-related shifts in proteome and function of extracellular vesicles secreted by fetal neural stem cells following chronic alcohol exposure.Heliyon. 2022 Nov 1;8(11):e11348. doi: 10.1016/j.heliyon.2022.e11348. eCollection 2022 Nov. Heliyon. 2022. PMID: 36387439 Free PMC article.
References
-
- Adachi J, Mizoi Y, Fukunaga T, Ogawa Y, Ueno Y, Imamichi H, 1991. Degrees of alcohol intoxication in 117 hospitalized cases. J Stud Alcohol 52(5), 448–453. - PubMed
-
- Archibald SL, Fennema-Notestine C, Gamst A, Riley EP, Mattson SN, Jernigan TL, 2001. Brain dysmorphology in individuals with severe prenatal alcohol exposure. Developmental medicine and child neurology 43(3), 148–154. - PubMed
Publication types
MeSH terms
Substances
Grants and funding
LinkOut - more resources
Full Text Sources
Other Literature Sources
Molecular Biology Databases
