. 2021 Feb;147(2):545-557.e9.
doi: 10.1016/j.jaci.2020.10.040. Epub 2020 Nov 20.

Systemic and mucosal antibody responses specific to SARS-CoV-2 during mild versus severe COVID-19

Affiliations

Systemic and mucosal antibody responses specific to SARS-CoV-2 during mild versus severe COVID-19

Carlo Cervia et al. J Allergy Clin Immunol. 2021 Feb.

Abstract

Background: Whereas severe acute respiratory syndrome coronavirus 2 (SARS-CoV-2)-specific antibody tests are increasingly being used to estimate the prevalence of SARS-CoV-2 infection, the determinants of these antibody responses remain unclear.

Objectives: Our aim was to evaluate systemic and mucosal antibody responses toward SARS-CoV-2 in mild versus severe coronavirus disease 2019 (COVID-19) cases.

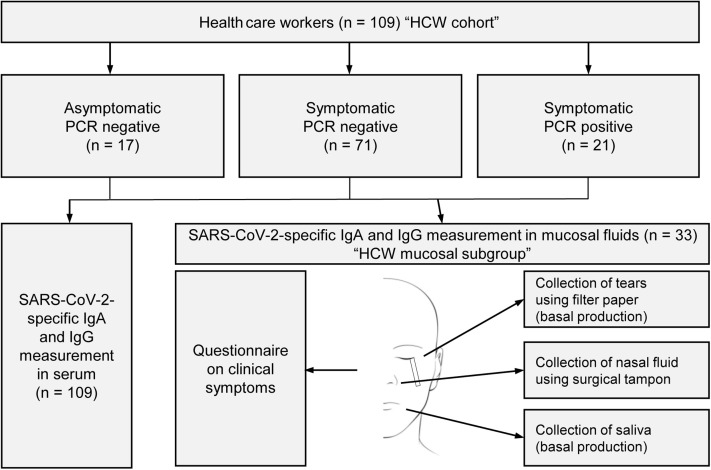
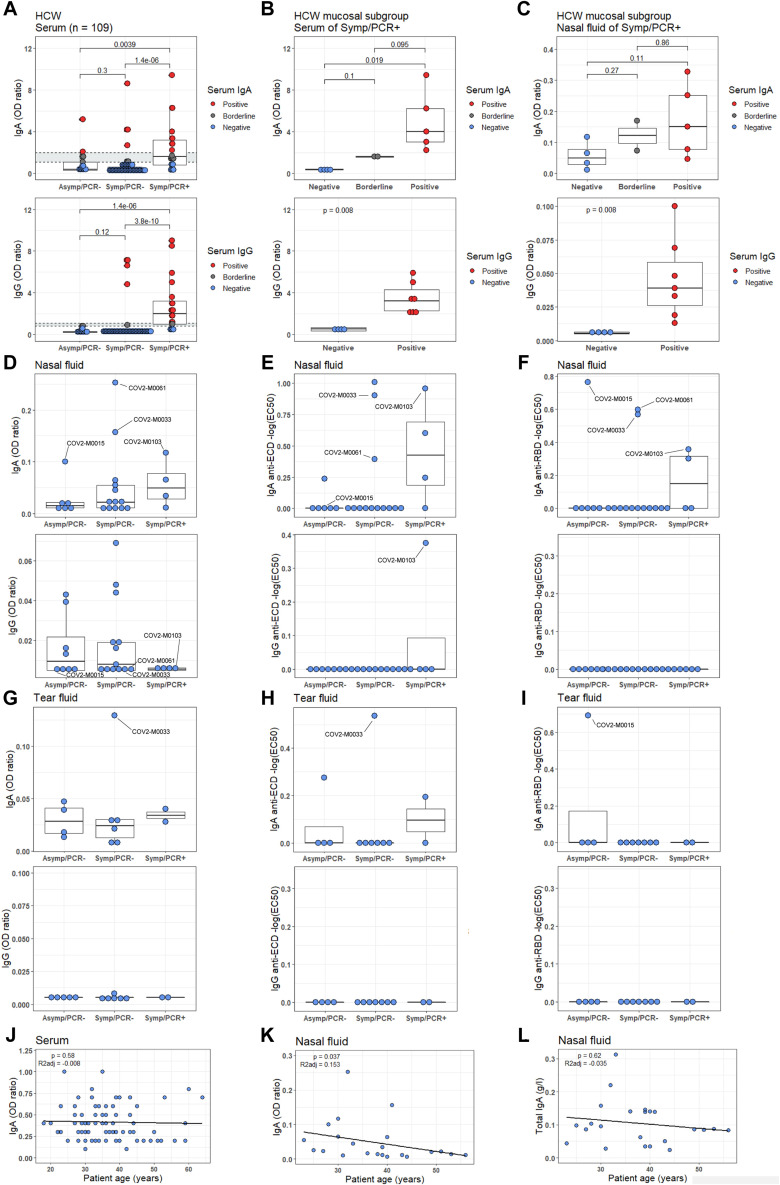
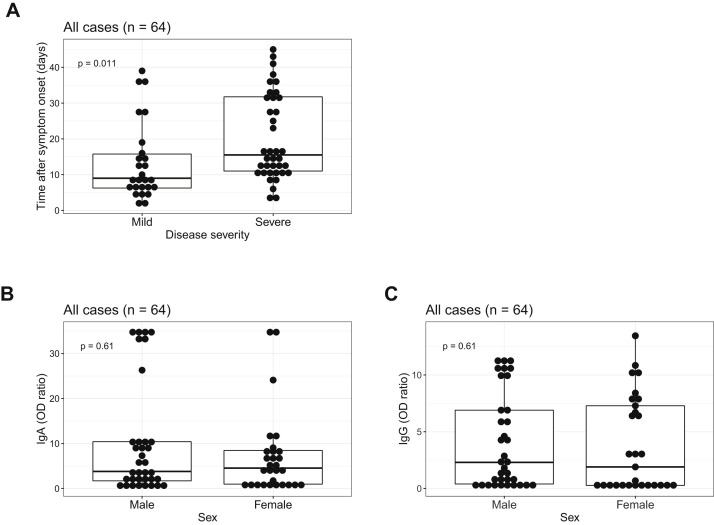
Methods: Using immunoassays specific for SARS-CoV-2 spike proteins, we determined SARS-CoV-2-specific IgA and IgG in sera and mucosal fluids of 2 cohorts, including SARS-CoV-2 PCR-positive patients (n = 64) and PCR-positive and PCR-negtive health care workers (n = 109).

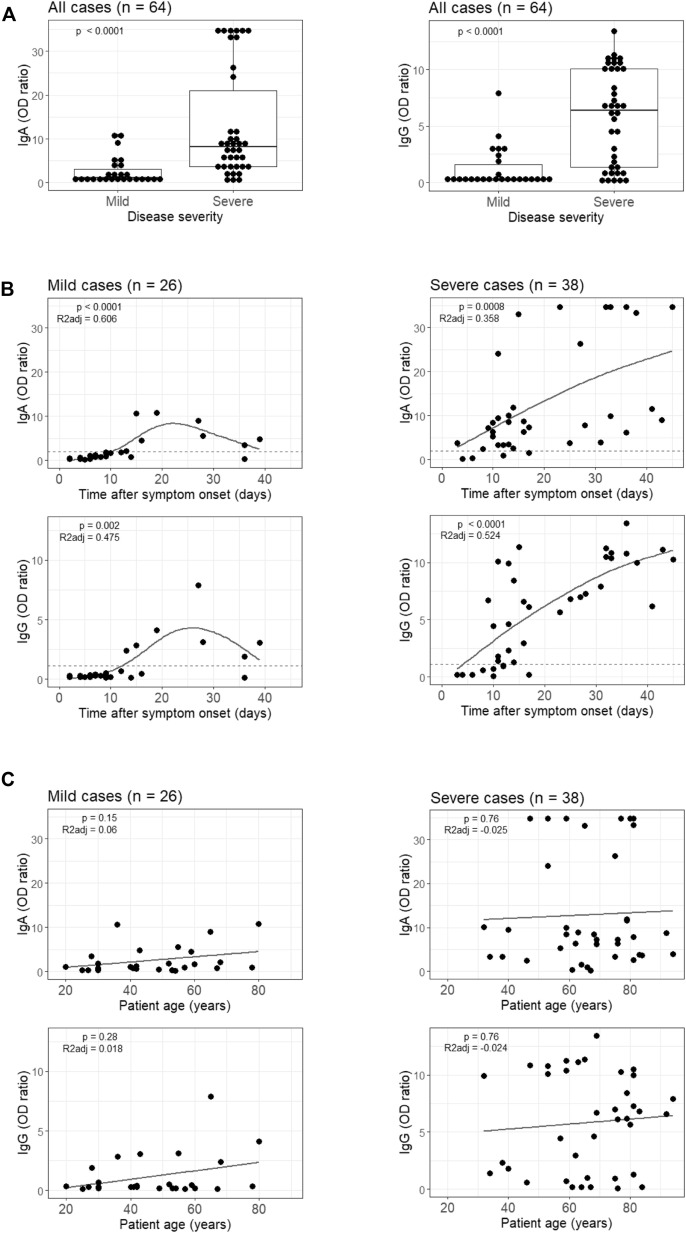
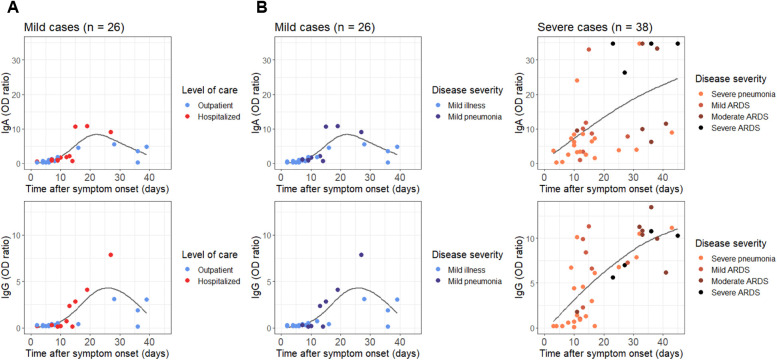
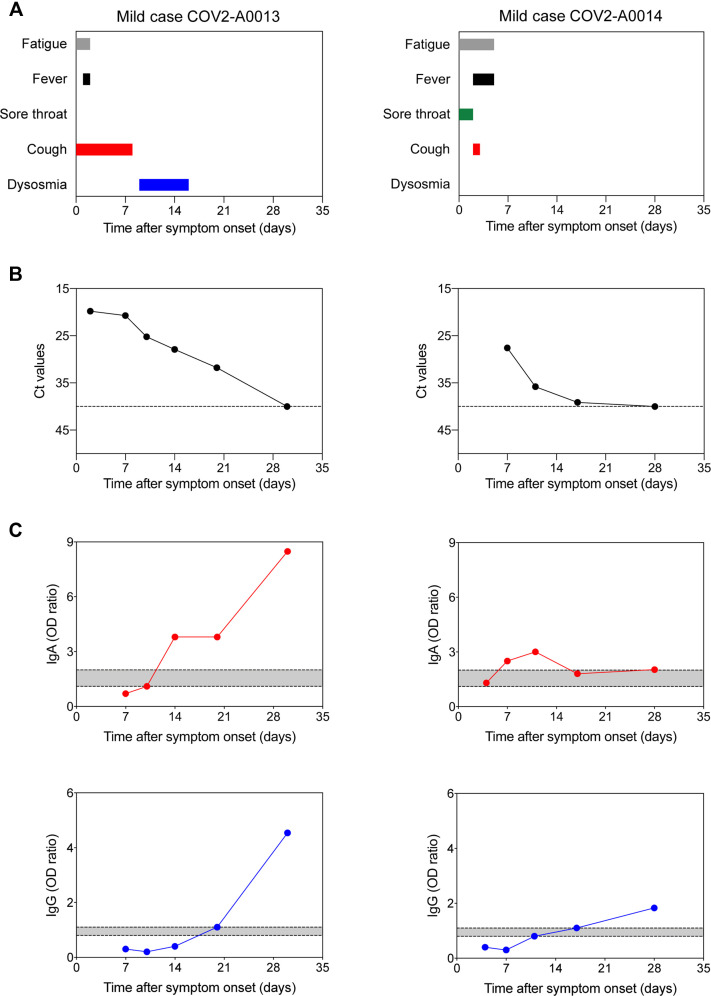
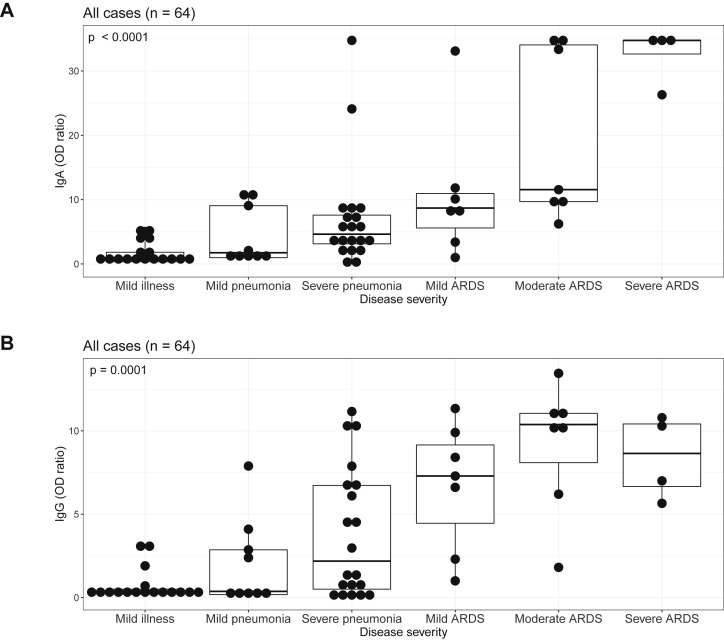
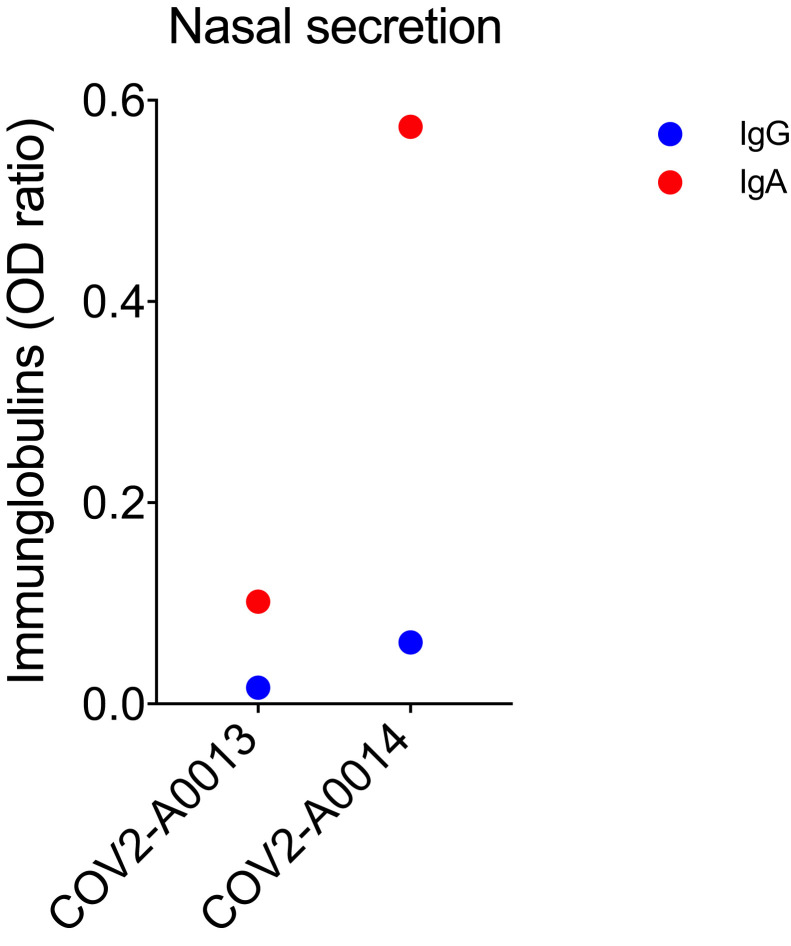
Results: SARS-CoV-2-specific serum IgA titers in patients with mild COVID-19 were often transiently positive, whereas serum IgG titers remained negative or became positive 12 to 14 days after symptom onset. Conversely, patients with severe COVID-19 showed a highly significant increase of SARS-CoV-2-specific serum IgA and IgG titers after symptom onset. Very high titers of SARS-CoV-2-specific serum IgA were correlated with severe acute respiratory distress syndrome. Interestingly, some health care workers with negative SARS-CoV-2-specific serum antibody titers showed SARS-CoV-2-specific IgA in mucosal fluids with virus-neutralizing capacity in some cases. SARS-CoV-2-specific IgA titers in nasal fluids were inversely correlated with age.

Conclusions: Systemic antibody production against SARS-CoV-2 develops mainly in patients with severe COVID-19, with very high IgA titers seen in patients with severe acute respiratory distress syndrome, whereas mild disease may be associated with transient production of SARS-CoV-2-specific antibodies but may stimulate mucosal SARS-CoV-2-specific IgA secretion.

Keywords: COVID-19; COVID-19 seroprevalence; COVID-19 severity; SARS-CoV-2; SARS-CoV-2–specific IgA; SARS-CoV-2–specific IgG; SARS-CoV-2–specific antibodies; humoral immune response; mucosal immune response.


Figures

None
Graphical abstract
Fig 1
Fig 1
Influence of COVID-19 severity, disease duration, and patient age on SARS-CoV-2–specific serum IgA and IgG titers. A, Comparison of SARS-CoV-2 S protein subunit S1-specific serum IgA and IgG titers (OD ratio) in patients with mild (n = 26) versus severe COVID-19 (n = 38). The average times between reported symptom onset and sample collection were 13.5 days (median 9 days) in patients with mild cases and 20.2 days (median 15.5 days) in patients with severe cases. B, Generalized additive modeling of S1-specific IgA and IgG serum titers as a function of days between reported symptom onset and sample collection in patients with mild (n = 26) versus severe COVID-19 (n = 38). Dashed lines indicate borders between positive and borderline or negative serum values of S1-specific IgA (top) and IgG (bottom). C, Linear modeling of S1-specific IgA and IgG serum titers as a function of patient age in patients with mild (n = 26) versus severe cases (n = 38). P values and adjusted R2 (R2adj) of linear and generalized additive models were computed by using logarithmized IgA/IgG titers.
Fig 2
Fig 2
S protein–specific serum antibodies compared with level of care and disease severity. A, Level of patient care at the time of blood sampling, visualized in the generalized additive models of S1-specific IgA and IgG serum titers as a function of days between sampling and reported symptom onset in patients with mild cases of COVID-19 (n = 26). Patients with severe cases were all hospitalized and are thus not depicted. B, Disease severity at the time of blood sampling, visualized in the generalized additive models of S1-specific IgA and IgG serum titers as a function of days between sampling and reported symptom onset. Comparison of patients with mild (n = 26) versus severe cases (n = 38).
Fig 3
Fig 3
Longitudinal study of 2 mild cases of COVID-19. A, Time of reporting of indicated symptoms in 2 patients with mild COVID-19, including a 42-year old male (COV2-A0013 [left panels]) and a 42-year old female (COV2-A0014 [right panels]). B, Ct values of SARS-CoV-2 RT-qPCR assay performed on nasopharyngeal swabs. C, S1-specific IgA and IgG serum titers analyzed on different days after symptom onset. Data are shown on a longitudinal axis. Dashed lines indicate cutoffs for positive, borderline, and negative serum values of S1-specific IgA (top) and IgG (bottom), with the gray shaded area highlighting the borderline values.
Fig 4
Fig 4
Flowchart showing characterization of the HCW cohort. We grouped our HCW cohort (n = 109) as follows: (1) asymptomatic, PCR-negative (n = 17) reporting exposure (see the Methods section) to a patient with COVID-19 11 to 24 days before sampling; (2) symptomatic, PCR-negative (n = 71); and (3) symptomatic, PCR-positive (n = 21). All HCWs were analyzed for SARS-CoV-2 S1–specific serum IgA and IgG values. In a subgroup (the HCW mucosal subgroup), tears, nasal fluid, saliva, and serum were collected simultaneously. Self-reported symptoms of each participant of the HCW mucosal subgroup were recorded. The 33 HCWs in the HCW mucosal subgroup were grouped in the same way as the HCW cohort: (1) asymptomatic, PCR-negative (n = 9); (2) symptomatic, PCR-negative (n = 13), sampled on average 26.5 days after symptom onset; and (3) symptomatic, PCR-positive (n = 11), sampled on average 26.5 days after symptom onset.
Fig 5
Fig 5
Analysis of SARS-CoV-2 S protein–specific IgA and IgG responses in serum and mucosal fluids. A, S protein–specific IgA (top) and IgG (bottom) serum titers in the HCW cohort (n = 109). Dashed lines indicate borders between positive (red), borderline (gray), and negative (blue) values, with the gray-shaded area showing borderline values. B and C, S protein–specific IgA (top) and IgG (bottom) serum (B) and nasal fluid (C) titers of symptomatic, PCR-positive (Symp/PCR+) individuals (n = 11) in the HCW mucosal subgroup. Comparison of HCWs with negative, borderline, and positive values. D-F, S protein–specific IgA (top) and IgG (bottom) titers in nasal fluid, including S1-specific (D), SARS-CoV-2 S protein extracellular domain (ECD)-specific (E), and S1 protein RBD–specific IgA and IgG (F) of S1 protein–seronegative individuals in the HCW mucosal subgroup. Comparison of asymptomatic, PCR-negative (Asymp/PCR), symptomatic, PCR-negative (Symp/PCR), and Symp/PCR+ HCWs. HCWs with negative S protein–specific IgA serum values are labeled individually. G-I, S protein–specific IgA (top) and IgG (bottom) titers in tear fluid, including S1-specific (G), ECD-specific (H), and RBD-specific IgA and IgG (I) of S1 protein–seronegative individuals in the HCW mucosal subgroup. (J-L) Linear modeling of S1 protein–specific IgA titers in serum (J) and nasal fluids (K) and total IgA in nasal fluids (L), as a function of age in S1 protein–seronegative individuals in the HCW mucosal subgroup.
Fig E1
Fig E1
S protein–specific serum IgA and IgG values compared with sampling time point, disease severity, patient age, and sex. A, Comparison of days between reported symptom onset and sample collection in patients with mild (n = 26) versus severe COVID-19 (n = 38). B, Visualization of age distribution in the generalized additive models of S1 protein–specific IgA and IgG serum titers as a function of days between reported symptom onset and sample collection. Comparison of patients with mild (n = 26) versus severe cases (n = 38). C and D, Comparison of S1 protein–specific serum IgA (C) and IgG (D) titers in male (n = 35) versus female (n = 29) patients with COVID-19. The average times between reported symptom onset and sample collection were 17 days (median 13 days) in male patients and 18 days (median 14 days) in female patients.
Fig E2
Fig E2
Distribution of disease severity and age of the patients with COVID-19. Comparison in all patients with COVID-19 (n = 64) of patient age distribution with COVID-19 severity at the time of sample collection, ranging from mild COVID-19 to severe ARDS, as defined by the World Health Organization classification criteria.P value was computed by using the Kruskal-Wallis test.
Fig E3
Fig E3
S protein–specific serum IgA and IgG values compared with severity of symptoms of patients with COVID-19. A and B, Comparison of S1 protein–specific serum IgA (A) and IgG (B) titers with disease severity in our cohort of patients with COVID-19 (n = 64), ranging from mild COVID-19 to severe ARDS, as defined by the World Health Organization classification criteria. Data are shown as boxplots. Each dot represents an independent and unrelated donor. The significance of between-group differencies was explored by using the Kruskal-Wallis test.
Fig E4
Fig E4
Longitudinal measurement of S protein–specific serum IgA and IgG values in asymptomatic controls and severe cases of COVID-19. A and B, S1 protein–specific serum IgA (top) and IgG (bottom) titers in asymptomatic donors (n = 4) (A) and patients with severe cases of COVID-19 (n = 3) (B). The connected dots represent sequential measurements of the same individual.
Fig E5
Fig E5
Titration of nasal fluids to detect S protein–specific IgA and IgG. Measurement of S1 protein–specific IgA (top) and IgG (bottom) by using different dilutions of nasal fluids in a subset of the HCW mucosal subgroup (n = 15).
Fig E6
Fig E6
Comparison of immunoassays to measure S protein–specific IgA and IgG in samples from serum, tears, nasal fluid, and saliva. Comparison of OD ratios of IgA (top) and IgG (bottom) obtained with a commercial ELISA specific for the S1 protein of SARS-CoV-2 (x-axes) and the inflection point of the sigmoidal curve (–log(EC50) (y-axes), the latter determined by measuring IgA (top) and IgG (bottom) against SARS-CoV-2 S ECD and SARS-CoV-2 S1 protein RBD in serial dilutions using an in-house immunoassay (see the Methods section). S protein–specific IgA (top) and IgG (bottom) were measured in serum, tear fluid, nasal fluid, and saliva of members of the HCW mucosal subgroup. Data are shown as scatter plots. Each dot represents an independent and unrelated donor. The Spearman correlation coefficient (ρ) is shown with the corresponding P value.
Fig E7
Fig E7
Analysis of total IgA and IgG serum titers in the HCW mucosal subgroup. Total IgA (top) and IgG (bottom) titers in serum, tear fluid, nasal fluid, and saliva were assessed in individuals in the HCW mucosal subgroup who tested negative for S1 protein–specific serum IgA (top) and IgG (bottom). The results of a comparison of aymptomatic, PCR-negative (Asymp/PCR), symptomatic PCR-negative (Symp/PCR), and symptomatic, PCR-positive (Symp/PCR+) HCWs are shown. Four PCR-negative HCWs with negative S protein–specific IgA values in their serum but increased S protein–specific IgA titers in their nasal fluids are labeled with their corresponding study code. The significance of between-group differences was explored by using the Wilcoxon test.
Fig E8
Fig E8
SARS-CoV-2 neutralization in nasal and tear fluids of individuals testing negative for SARS-CoV-2–specific antibodies in serum. A, Representative photographs of SARS-CoV-2–infected VeroE6 cells, showing either absent, partial, or full neutralization of SARS-CoV-2 in the presence or absence of patient serum. B, Shown are the proportions of full (red), partial (orange), and absent (blue) neutralizing ability of serum (n = 20), nasal fluid (n = 26), and tear fluid samples (n = 7) obtained from the HCW subgroup with either positive to borderline (top row) or negative (bottom row) S1 protein–specific IgA and IgG titers in their serum.
Fig E9
Fig E9
Mucosal S protein–specific IgA and IgG in 2 patients with mild COVID-19. Shown are S1 protein–specific IgA and IgG titers in the nasal fluids of patients COV2-A0013 and COV2-A0014 (see Fig 3) on day 25.

Similar articles

Cited by

References

    1. Coronaviridae Study Group of the International Committee on Taxonomy of Viruses The species severe acute respiratory syndrome-related coronavirus: classifying 2019-nCoV and naming it SARS-CoV-2. Nat Microbiol. 2020;5:536–544. - PMC - PubMed
    1. Wu F., Zhao S., Yu B., Chen Y.-M., Wang W., Song Z.-G., et al. A new coronavirus associated with human respiratory disease in China. Nature. 2020;579:265–269. - PMC - PubMed
    1. Zhou P., Yang X.-L., Wang X.-G., Hu B., Zhang L., Zhang W., et al. A pneumonia outbreak associated with a new coronavirus of probable bat origin. Nature. 2020;579:270–273. - PMC - PubMed
    1. Zhu N., Zhang D., Wang W., Li X., Yang B., Song J., et al. A novel coronavirus from patients with pneumonia in China, 2019. N Engl J Med. 2020;382:727–733. - PMC - PubMed
    1. Dong E., Du H., Gardner L. An interactive web-based dashboard to track COVID-19 in real time. Lancet Infect Dis. 2020;20:533–534. - PMC - PubMed