Review
. 2020 Dec:65:88-99.
doi: 10.1016/j.conb.2020.09.011. Epub 2020 Nov 19.

Whole-brain interactions underlying zebrafish behavior

Affiliations
Review

Whole-brain interactions underlying zebrafish behavior

Matthew D Loring et al. Curr Opin Neurobiol. 2020 Dec.

Abstract

Detailed quantification of neural dynamics across the entire brain will be the key to genuinely understanding perception and behavior. With the recent developments in microscopy and biosensor engineering, the zebrafish has made a grand entrance in neuroscience as its small size and optical transparency enable imaging access to its entire brain at cellular and even subcellular resolution. However, until recently many neurobiological insights were largely correlational or provided little mechanistic insight into the brain-wide population dynamics generated by diverse types of neurons. Now with increasingly sophisticated behavioral, imaging, and causal intervention paradigms, zebrafish are revealing how entire vertebrate brains function. Here we review recent research that fulfills promises made by the early wave of technical advances. These studies reveal new features of brain-wide neural processing and the importance of integrative investigation and computational modelling. Moreover, we outline the future tools necessary for solving broader brain-scale circuit problems.


Conflict of interest statement

Conflict of interest statement

Nothing to declare.

Figures
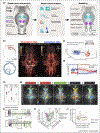
Figure 1.
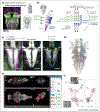
Figure 1.. Brain states encoded in network activity and local circuitry
(a) The common strategy to use whole-brain regression analysis under various conditions and behavioral recordings often reveals widespread sensory (teal) and motor (purple) related signals. After task relevant neurons are located, most studies progress with local circuit analysis to refine response types, connectivity and anatomy, using molecular identity, and through the use of a combination of single cell electroporation, transgenic lines, and causal perturbations, including laser ablations of single neurons or optogenetic activation in concert with behavioral testing. These results are often synthesized into models that range from simple activity maps, suggesting circuit diagrams, to realistic quantitative network simulations using recorded activity dynamics in recurrent neural network replicating biological effective connectivity. Other approaches include probabilistic models linking sensory input to behavioral output and comparison to artificial neural networks. (b) In a recent study ••[24], focus shifted towards dynamic brain state transitions rather than correlational maps. Left, example behavior trajectories of zebrafish in exploitation (red) and exploration (blue) states. Right, locations of all neurons encoding these brain states, projected across 17 registered fish recorded with a tracking microscope, revealing brain state switches triggered by serotonergic neurons (dashed box). Ro, rostral; C, caudal; L, left; R, right. (c) PCA trajectory of whole-brain activity (104,142 neurons) from a representative animal, color-coded by the activity of exploitation-state-encoding neurons. (d) Average activity (mean ± s.d.) of exploitation-state-encoding (red) and exploration-state-encoding (blue) neurons across the transition from exploration to exploitation (top). These dynamics are likely key to understand brain wide states that modulating other processes. (e) Lin et al. ••[25]. used an operant conditioning assay combined with whole-brain calcium imaging to investigate how decision brain states develop over time. Head-fixed larval zebrafish receive a mildly aversive heat stimulus by an infrared laser (red trapezoid) at the beginning of a trial. The laser is turned off if the fish makes a tail movement in the reward direction and remains on otherwise. In the second training block the reward direction is switched, with each block consisting of 20–25 trials (f) The learning progress of an example learner fish. Black traces indicate tail positions over time, magenta and green rectangles indicate the duration of the heat stimulus for each incorrect and correct trial, respectively. (g) Temporal evolution of brain states reveals distributed brain activity and bihemispheric preparatory activity. ARTR, anterior rhombencephalic turning region; Cb, cerebellum; HB, habenula; Te, telencephalon. (h) Performance-dependent bifurcation of brain states before turn initiation. Left, after heat onset, brain states exhibit similarity along the “Heat ON” dimension (vertical axis), followed by a pre-turn bifurcation toward the correct or incorrect state. Similarity is measured by partial correlation between a given brain state and the average correct, incorrect, or “Heat ON” state. Right, representation of single-trial bifurcation process. Individual correct and incorrect trials are highlighted during the pre-motor period (black diamonds: heat onset, green and magenta dots: turn initiations for correct and incorrect turns, respectively). (i) 2D representation of single-trial bifurcation process. Individual correct and incorrect trials are highlighted during the pre-motor period (black diamonds: heat onset, green and magenta dots: turn initiations for correct and incorrect turns, respectively).
Figure 2
Figure 2. The importance of diverse cell types across the brain
(a) Mu et al. ••[23] studied brain wide responses of radial astrocytes (green) and neurons (magenta) while either providing or withholding visual feedback. Dual color whole-brain neuronal and astrocyte Ca2+ imaging (GCaMP6f and jRGECO1b), concurrent with fictive behavior monitoring and visual stimulus delivery, showed dynamic increases in specific cell populations during epochs of futility-induced passivity. While neuronal brain-wide activity was higher during active behavior than passivity, brain-wide glial Ca2+ signals increased before passivity onset and remained elevated during passivity. (b) In an experimental tour de force combining optogenetics, specific ablations and pharmacology, radial astrocytes are demonstrated to be necessary and sufficient for induction of passivity. Mismatch signals from norepinephrinergic neurons are integrated over time and using an unknown signaling mechanism behaviors are shut down through local GABAergic inhibition. (c) Barron-Lovett et al. •[46] investigated how fish respond to aversive stimuli, such as high salinity. By using their potent MultiMAP [75] approach, live neural activity volumes are registered with post-fixation and staining volumes. Here, this approach aligns neuropeptidergic identities with functional properties in the preoptic hypothalamus. (d) Schematic illustrating the remarkable searchable online repository of over 2000 single neurons registered and aligned by Kunst et al. [31]. This represents a strategy to leverage the single-neuron atlas (also used by Kramer et al.) to determine long range projections that are difficult to trace with current photoactivatable fluorescent proteins. (e) Graphical user interface of Zbrowser [47] with multiview options of Cre and Gal4 transgenic lines. Similar atlases such as the Z-brain, maintained by Engert and colleagues, and important cellular atlases [31] are invaluable tools elevating zebrafish scientific community by enabling fast comparisons of task relevant brain regions and visual exploration of expression profiles. (f) Serial electron microscopy to reconstruct neurons identified via functional calcium imaging [55], will allow to determine circuit specific connectivity. Here, three views of synaptically connected integrator neurons encoding eye positions. Synapses from the ipsi-only group onto another neuron from the ipsi-only group (top left) (black circles) and from the ipsi-only group onto contra-only neurons (right). Black arrows indicate the location of the synapses, with insets showing the electron micrographs at two representative locations; colors in the insets are representative of the cells to which the synapses belong.
Figure 3
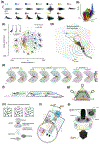
Figure 3. Large scale behavioral analysis brings the entire ethogram into view
(a) Zebrafish swim in discrete swim bouts. These elementary movements can be clustered into 13 distinct swim types [14], as shown here as angle of tail segment (°) versus time (ms), with one hundred randomly picked bouts of each type (black). Cyan lines are the average of all bouts in each category. Colored dots next to bout abbreviation correspond to (b). Such careful assessment of behavior is critical to understand how the brain transforms any signals into distinct types of behavioral outputs. These 13 distinct swim types include: approach swims (AS), two distinct slow swims (Slow 1, Slow 2), capture swims (Short CS, Long CS), burst swims (BS), large turns for prey capture (J-turns), high angle turns (HAT), routine turns (RT), spot avoidance turns (SAT), abrupt high angle turns (O-bend), and two remaining escape responses (c-starts) of long-latency (LLC) or short-latency (SLC). (b) Bout density versus the first two principal components of the movement space used to categorize all bouts. Colors represent bout categories from (a). (c) Similar bout-type analysis [61] measures the kinematic difference between every pair of bouts with dynamic time warping (DTW) to conclude that behavior structure is largely continuous. Non-linear isomap embedding shows bouts in single behavioral space, with some local densities representing more stereotyped types of forward swimming. Inset: Dimensionality reduction of the first three ‘Eigenfish’. (d) Bolton et al. [63] used a novel 3D assay for continuous tracking of eye angle, yaw, pitch, and tail angles mapping prey trajectories to fish movement choices. Cartoon shows a fish hunting live prey, paramecia. Prey features are mapped to a spherical coordinate system originating at the fish’s mouth. Angular prey position and velocity construct a future estimate of prey position to guide hunting behavior. (e) Johnson et al. [62] used large scale behavioral tracking that allowed them to use probabilistic modeling to characterize the likelihood of visual stimuli preceding for each rightward hunting bout type. (f) Larsch et al. [72] recently showed that motion cues induce social, shoaling-like behavior in juvenile fish (21 days post fertilization), though imaging of associated brain function remains under way. Schematic of a virtual social assay used in the study, whereby each animal sees black dots underneath at the location of the other three animal(s), virtually pairing them. (g) Huang et al. [57] recently demonstrated how virtual reality rigs can be used to present visual stimulation to zebrafish in realistic 3-D environments, enabling adult virtual reality. (h) Dragomir et al. [33] (and Bahl et al) have recently employed classic random dot motion paradigms to flexibly investigate evidence integration. Zebrafish offer a strong behavioral model to investigate sensory integration tasks traditionally reserved for primate research. (i) Schematic of the rotating light-sheet microscope demonstrated by Migault et al. [8], used to monitor the activity of the vestibular system. This microscope includes separate illumination (LU, light-sheet unit) and detection (DU, detection unit) pathways that rotate with the fish. (j) Delivery of acoustic stimuli delivered via waterproof speakers [39] allows brain-wide imaging of auditory responses.

References

    1. Stirman JN, Smith IT, Kudenov MW, Smith SL: Wide field-of-view, multi-region two-photon imaging of neuronal activity in the mammalian brain. Nat Biotechnol 2016, 34:857–862. - PMC - PubMed
    1. Jun JJ, Steinmetz NA, Siegle JH, Denman DJ, Bauza M, Barbarits B, Lee AK, Anastassiou CA, Andrei A, Aydın Ç, et al.: Fully integrated silicon probes for high-density recording of neural activity. Nature 2017, 551:232–236. - PMC - PubMed
    1. Stringer C, Pachitariu M, Steinmetz N, Reddy CB, Carandini M, Harris KD: Spontaneous behaviors drive multidimensional, brainwide activity. Science 2019, 364. - PMC - PubMed
    1. Chen X, Mu Y, Hu Y, Kuan AT, Nikitchenko M, Randlett O, Chen AB, Gavornik JP, Sompolinsky H, Engert F, et al.: Brain-wide Organization of Neuronal Activity and Convergent Sensorimotor Transformations in Larval Zebrafish. Neuron 2018, 100:876–890.e5. - PMC - PubMed
    1. Aimon S, Katsuki T, Jia T, Grosenick L, Broxton M, Deisseroth K, Sejnowski TJ, Greenspan RJ: Fast near-whole–brain imaging in adult Drosophila during responses to stimuli and behavior. PLOS Biol 2019, 17:e2006732. - PMC - PubMed

Publication types