. 2021 Jul 9;50(3):768-782.
doi: 10.1093/ije/dyaa188.

Metabolic profiles of socio-economic position: a multi-cohort analysis

Affiliations

Metabolic profiles of socio-economic position: a multi-cohort analysis

Oliver Robinson et al. Int J Epidemiol. .

Abstract

Background: Low socio-economic position (SEP) is a risk factor for multiple health outcomes, but its molecular imprints in the body remain unclear.

Methods: We examined SEP as a determinant of serum nuclear magnetic resonance metabolic profiles in ∼30 000 adults and 4000 children across 10 UK and Finnish cohort studies.

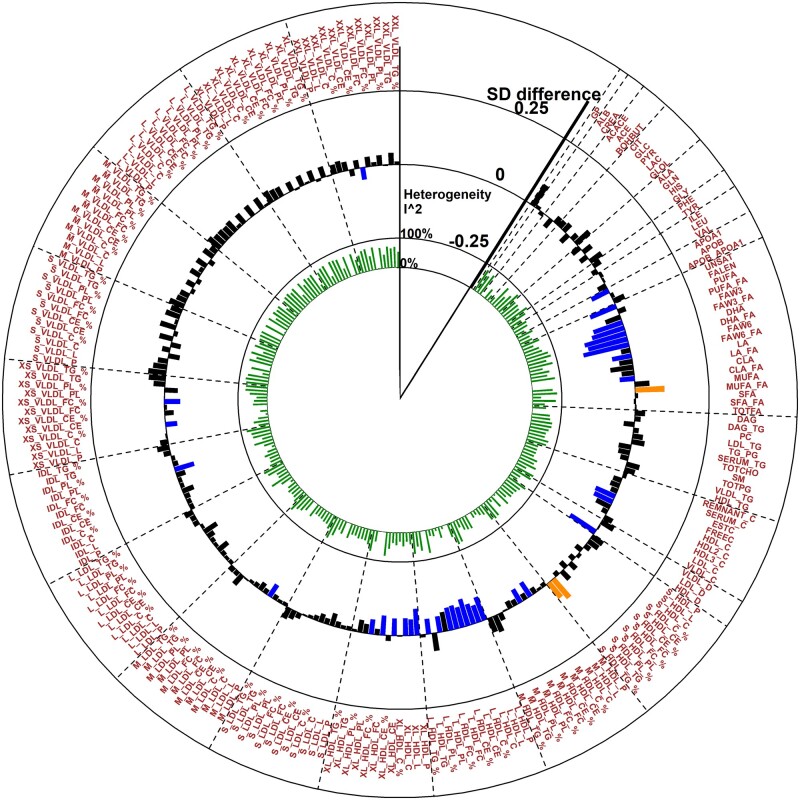
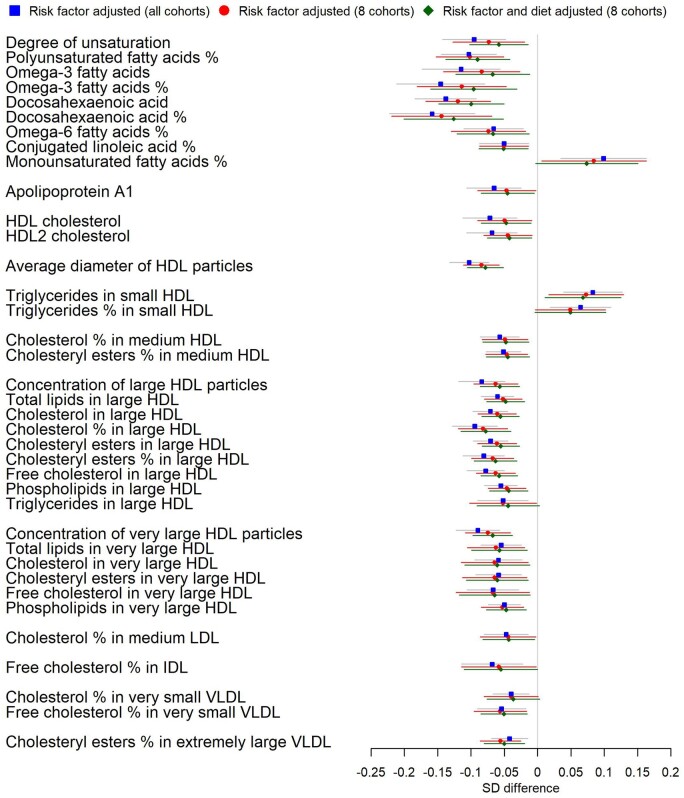
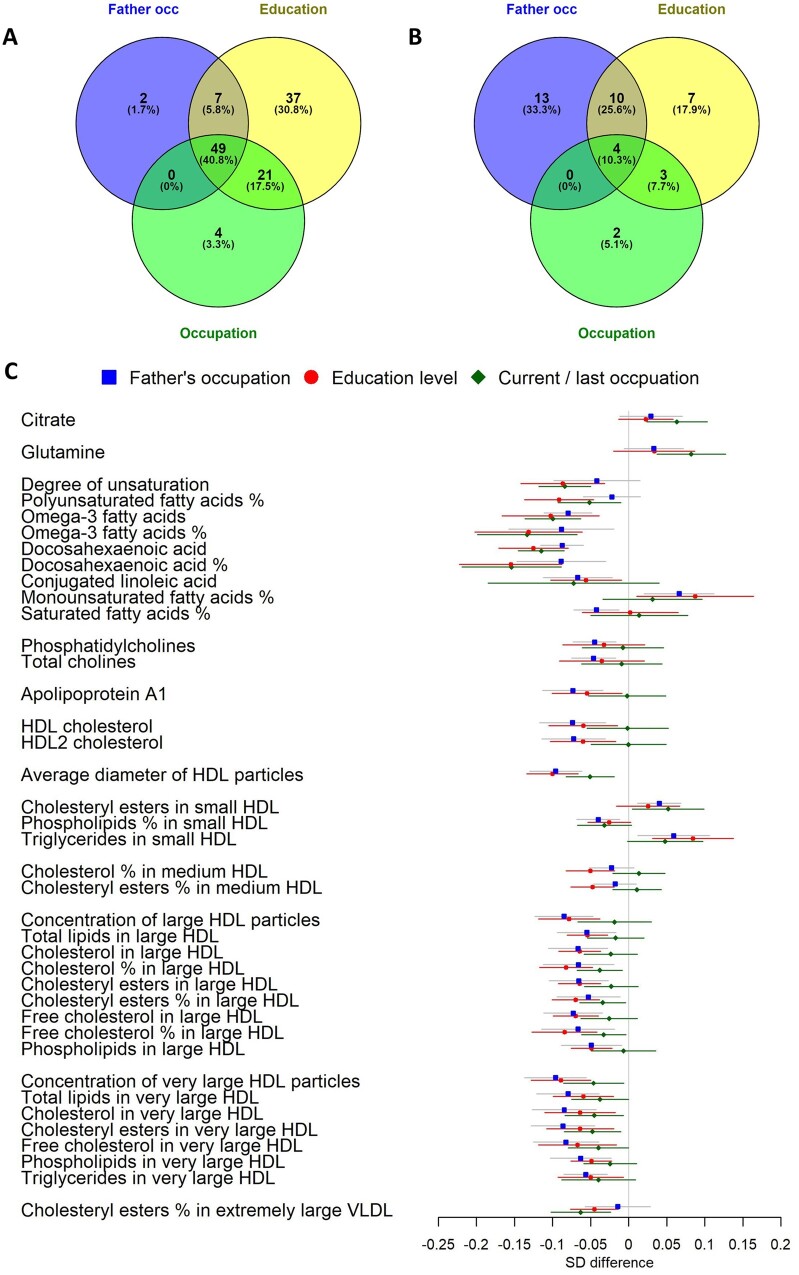
Results: In risk-factor-adjusted analysis of 233 metabolic measures, low educational attainment was associated with 37 measures including higher levels of triglycerides in small high-density lipoproteins (HDL) and lower levels of docosahexaenoic acid (DHA), omega-3 fatty acids, apolipoprotein A1, large and very large HDL particles (including levels of their respective lipid constituents) and cholesterol measures across different density lipoproteins. Among adults whose father worked in manual occupations, associations with apolipoprotein A1, large and very large HDL particles and HDL-2 cholesterol remained after adjustment for SEP in later life. Among manual workers, levels of glutamine were higher compared with non-manual workers. All three indicators of low SEP were associated with lower DHA, omega-3 fatty acids and HDL diameter. At all ages, children of manual workers had lower levels of DHA as a proportion of total fatty acids.

Conclusions: Our work indicates that social and economic factors have a measurable impact on human physiology. Lower SEP was independently associated with a generally unfavourable metabolic profile, consistent across ages and cohorts. The metabolites we found to be associated with SEP, including DHA, are known to predict cardiovascular disease and cognitive decline in later life and may contribute to health inequalities.

Keywords: Socio-economic status; education; life course; lipoproteins; metabolomics; metabonomic; occupation.


Figures

Figure 1
Figure 1
Association of low educational attainment with metabolites in basic-adjustment analysis. Meta-analysis of the Northern Finland Birth Cohort 1966, Young Finns Study, Avon Longitudinal Study of Parents and Children (mother and father studies only), National Survey of Health and Development, Southall And Brent REvisited Study, Whitehall-II Study, Caerphilly Prospective Study, UK Collaborative Trial of Ovarian Cancer Screening Longitudinal Women’s Cohort and British Women’s Heart and Health Study cohorts. Abbreviations of metabolic measures are shown in Supplementary Table 3, available as Supplementary data at IJE online. Analyses compared those with up to secondary schooling only with those with further/higher education (referent category). Orange- and blue-coloured bars show direct and inverse associations, respectively, that pass FDR correction.
Figure 2
Figure 2
Association of low educational attainment with metabolites in risk-factor-adjusted analysis. Meta-analysis of the Northern Finland Birth Cohort 1966, Young Finns Study, Avon Longitudinal Study of Parents and Children (mother and father studies only), National Survey of Health and Development, Southall And Brent REvisited Study, Whitehall-II Study, Caerphilly Prospective Study, UK Collaborative Trial of Ovarian Cancer Screening Longitudinal Women’s Cohort and British Women’s Heart and Health Study cohorts. Abbreviations of metabolic measures are shown in Supplementary Table 3, available as Supplementary data at IJE online. Analyses compared those with up to secondary schooling only with those with further/higher education (referent category). Orange- and blue-coloured bars show direct and inverse associations, respectively, that pass FDR correction.
Figure 3
Figure 3
Risk-factor-adjusted associations of low educational attainment with selected metabolites by cohort and in overall meta-analysis. Analyses compared those with up to secondary schooling only with those with further/higher education (referent category). NFBC66, Northern Finland Birth Cohort 1966; YFS, Young Finns Study; ALSPACMUMS and ALSPACDADS, Avon Longitudinal Study of Parents and Children (mother and father studies, respectively); NSHD, National Survey of Health and Development; SABRE, Southall And Brent REvisited Study; WHII, Whitehall-II Study; CaPS, Caerphilly Prospective Study; UKCTOCS, UK Collaborative Trial of Ovarian Cancer Screening Longitudinal Women’s Cohort; BWHHS, British Women’s Heart and Health Study.
Figure 4
Figure 4
Associations of low educational attainment with metabolites in risk-factor-adjusted analyses. Figure shows all associations that pass correction for a 5% false-discovery rate in risk-factor-adjusted analyses in all 10 adult cohorts. Blue squares show estimates from the meta-analysis of all 10 adult cohorts. Red circles show estimates from meta-analysis in eight cohorts only (excluding UK Collaborative Trial of Ovarian Cancer Screening Longitudinal Women’s Cohort and British Women’s Heart and Health Study). Green diamonds show risk-factor-adjusted estimates additionally adjusted for diet, in the same eight cohorts (which had dietary data available). Analyses compared those with up to secondary schooling only to those with further/higher education (referent category).
Figure 5
Figure 5
Associations of father’s occupation, educational level and current/last occupation with metabolites in meta-analyses. Note that the meta-analysis was limited to eight cohorts [Northern Finland Birth Cohort 1966, Young Finns Study, Avon Longitudinal Study of Parents and Children (mothers and fathers only), National Survey of Health and Development, Southall And Brent REvisited Study, Whitehall-II Study, and British Women’s Heart and Health Study cohorts] with all SEP indicators available. N for father’s occupation analysis = 21 805, N for education analysis = 24 252, N for current/last occupation analysis = 25 112. Analyses compared disadvantaged (up to secondary schooling only or manual work) to advantaged SEP (referent category). (A) Venn diagrams showing overlap in metabolic measures associated after false-discovery-rate correction with the three socio-economic position (SEP) indicators after basic adjustment. (B) As for (A) but for risk-factor adjustments. (C) Estimates and 95% confidence intervals for each SEP indicator in risk-factor-adjusted analyses.
Figure 6
Figure 6
Associations of father’s occupation and current/last occupation with selected metabolites by cohort and in overall meta-analysis in risk-factor-adjusted analyses. Note that measurements of conjugated linoleic acid were available for four cohorts only. Analyses compared manual to non-manual workers (referent category). NFBC66, Northern Finland Birth Cohort 1966; YFS, Young Finns Study; ALSPACMUMS and ALSPACDADS, Avon Longitudinal Study of Parents and Children (mother and father studies, respectively); NSHD, National Survey of Health and Development; SABRE, Southall And Brent REvisited Study; WHII, Whitehall-II Study; CaPS, Caerphilly Prospective Study; UKCTOCS, UK Collaborative Trial of Ovarian Cancer Screening Longitudinal Women’s Cohort; BWHHS, British Women’s Heart and Health Study.
Figure 7
Figure 7
Risk-factor- and diet-adjusted associations between father’s occupation and metabolites measured at three time points (7, 15 and 17 years) in the children from the Avon Longitudinal Study of Parents and Children. Bars show 95% confidence intervals. Metabolites displayed are associated with father’s occupation after false-discovery-rate correction of at least one time point. Analyses compared father being a manual worker to non-manual worker (referent category).

References

    1. Stringhini S, Carmeli C, Jokela M. et al. Socioeconomic status and the 25 x 25 risk factors as determinants of premature mortality: a multicohort study and meta-analysis of 1.7 million men and women. Lancet 2017;389:1229–37. - PMC - PubMed
    1. Petrovic D, de Mestral C, Bochud M. et al. The contribution of health behaviors to socioeconomic inequalities in health: a systematic review. Prev Med 2018;113:15–31. - PubMed
    1. Karimi M, Castagné R, Delpierre C. et al. Early-life inequalities and biological ageing: a multisystem Biological Health Score approach in Understanding Society. J Epidemiol Community Health 2019;73:693–702. - PMC - PubMed
    1. Layte R, McCrory C, Cheallaigh CN. et al. A comparative analysis of the status anxiety hypothesis of socio-economic inequalities in health based on 18,349 individuals in four countries and five cohort studies. Sci Rep 2019;9:796. - PMC - PubMed
    1. Kivimaki M, Vahtera J, Tabak AG. et al. Neighbourhood socioeconomic disadvantage, risk factors, and diabetes from childhood to middle age in the Young Finns Study: a cohort study. Lancet Public Health 2018;3:e365–e73. - PMC - PubMed

Publication types

Grants and funding