. 2021 Jan 8;49(D1):D1046-D1057.
doi: 10.1093/nar/gkaa1070.

The UCSC Genome Browser database: 2021 update

Affiliations

The UCSC Genome Browser database: 2021 update

Jairo Navarro Gonzalez et al. Nucleic Acids Res. .

Abstract

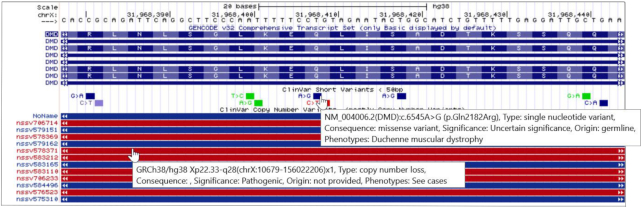
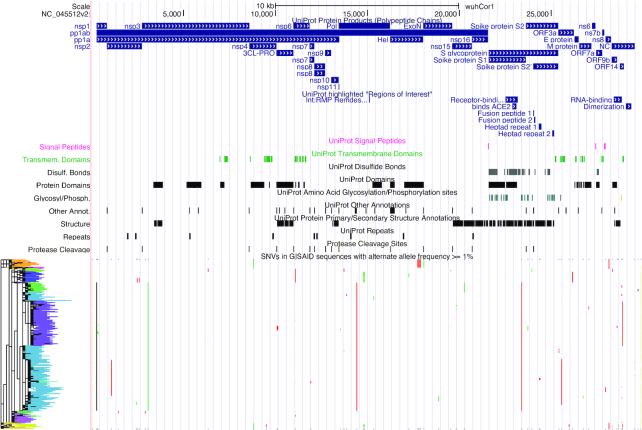
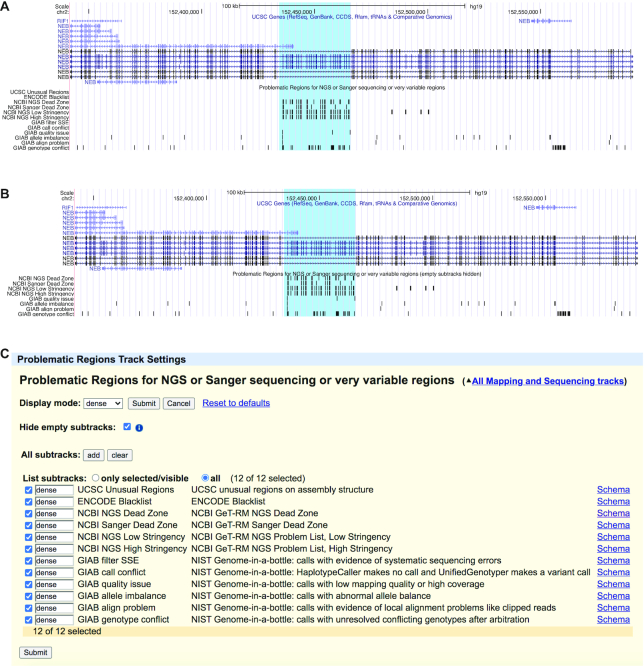
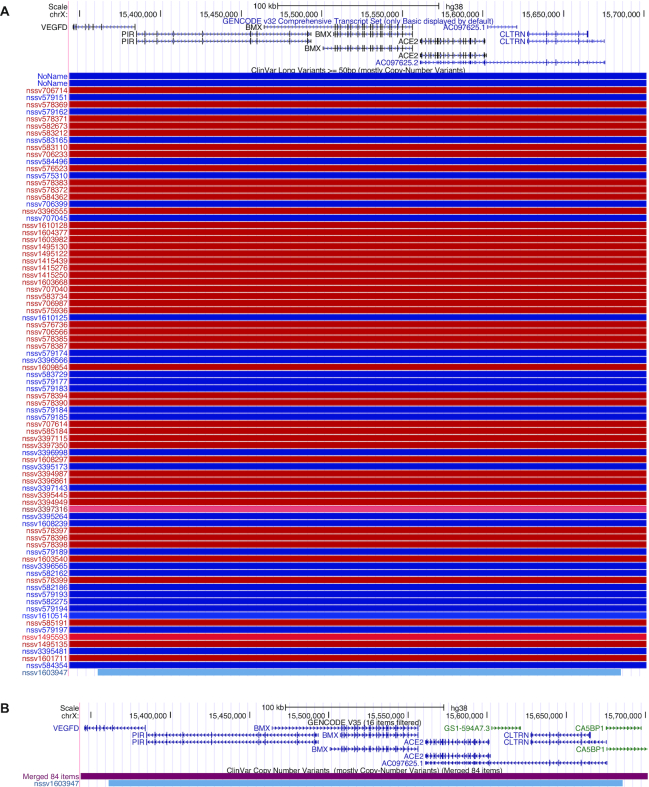
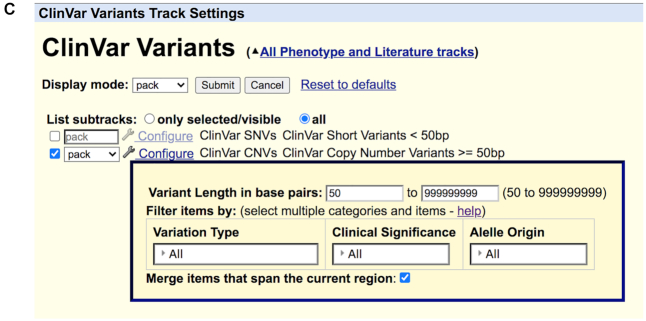
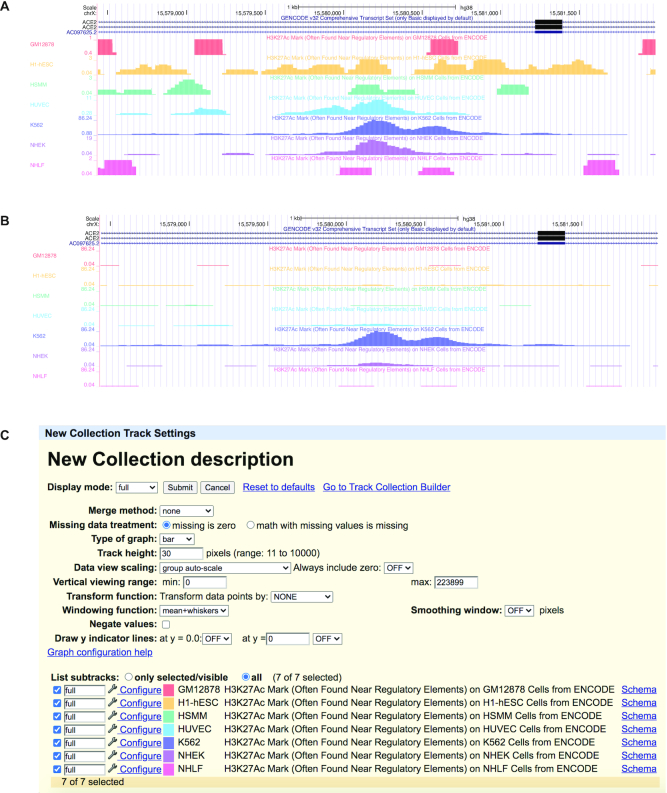
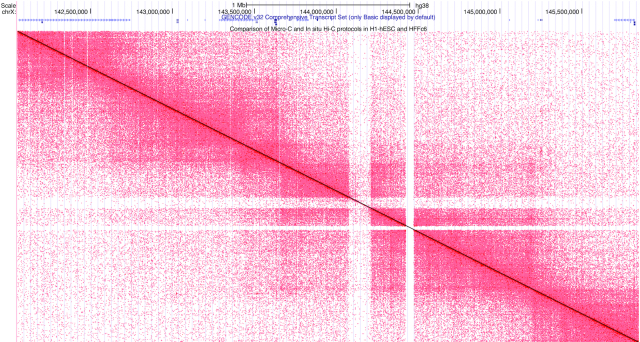
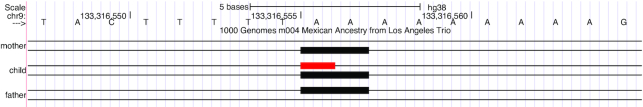
For more than two decades, the UCSC Genome Browser database (https://genome.ucsc.edu) has provided high-quality genomics data visualization and genome annotations to the research community. As the field of genomics grows and more data become available, new modes of display are required to accommodate new technologies. New features released this past year include a Hi-C heatmap display, a phased family trio display for VCF files, and various track visualization improvements. Striving to keep data up-to-date, new updates to gene annotations include GENCODE Genes, NCBI RefSeq Genes, and Ensembl Genes. New data tracks added for human and mouse genomes include the ENCODE registry of candidate cis-regulatory elements, promoters from the Eukaryotic Promoter Database, and NCBI RefSeq Select and Matched Annotation from NCBI and EMBL-EBI (MANE). Within weeks of learning about the outbreak of coronavirus, UCSC released a genome browser, with detailed annotation tracks, for the SARS-CoV-2 RNA reference assembly.


Figures

Figure 1.
Figure 1.
Mouse-over information is shown for the ClinVar SNVs and CNVs track. Information such as variant type, molecular consequence, clinical significance, variant origin and phenotypes are displayed.
Figure 2.
Figure 2.
The entire viral genome in the SARS-CoV-2 browser. The default tracks shown are from the UniProt and GISAID databases. UniProt tracks shown are protein products, signal peptides, transmembrane domains, disulfide bonds, protein domains, glycosylation and phosphorylation sites, protein primary and secondary structure, cleavage sites and repeats. From GISAID, only common SNVs are displayed (alternate allele is found in at least 1% of samples), along with the phylogenetic tree showing inferred relationships between the variants.
Figure 3.
Figure 3.
The Problematic Regions track is shown in both images. In (A), the original Browser display is shown for the NEB gene, a gene that has an internal duplication of some exons and short read sequencing mapping algorithms do not work well in this region. In (B), the ‘hide empty subtracks’ feature is used and is hiding four subtracks from the Browser display. (C) shows the track configuration settings used in (B).
Figure 4.
Figure 4.
The ClinVar CNVs track is shown in both images. (A) The default view for the 358 090 bp region, and 85 items in the current window. (B) The effect of the ‘collapse track items’ feature – 84 items are no longer displayed. (C) The track configuration settings used in (B).
Figure 4.
Figure 4.
The ClinVar CNVs track is shown in both images. (A) The default view for the 358 090 bp region, and 85 items in the current window. (B) The effect of the ‘collapse track items’ feature – 84 items are no longer displayed. (C) The track configuration settings used in (B).
Figure 5.
Figure 5.
The Genome Browser figures show two auto-scale views for the same data. In (A), the original ‘auto-scale to data view’ setting is shown, where each track is auto-scaled to display the track's highest value. In (B), the new ‘group auto-scale’ setting is shown, where each track is scaled against the track with the highest value in the composite. (C) The track settings for the track collection in (B).
Figure 6.
Figure 6.
The heatmap for hg38 shows a traditional Hi-C display in ‘square’ mode (other viewing modes are ‘triangle’ and ‘arc’). Scores for this type of display correspond to how close two genomic regions are in 3-D space, with color intensity showing a high scoring interaction. The upper-left corner of the square corresponds to the left-most position of the current window, while the bottom-right corner corresponds to the right-most position of the window.
Figure 7.
Figure 7.
The haplotypes for the mother and father are displayed above and below the child's haplotypes. Variants predicted to be de-novo mutations in the child are shown in red.
Figure 8.
Figure 8.
This image shows a variant in the new dbSNP b153 track inside a repetitive region. There is a deletion of one base in a range of nine identical bases, so a thin rectangle is drawn over the first eight bases to show that there is uncertain placement, and a thick rectangle is placed over the last base to show that one base is deleted from the range.

References

    1. Kent W.J., Sugnet C.W., Furey T.S., Roskin K.M., Pringle T.H., Zahler A.M., Haussler D.. The Human Genome Browser at UCSC. Genome Res. 2002; 12:996–1006. - PMC - PubMed
    1. Lee C.M., Barber G.P., Casper J., Clawson H., Diekhans M., Gonzalez J.N., Hinrichs A.S., Lee B.T., Nassar L.R., Powell C.C. et al. .. UCSC Genome Browser enters 20th year. Nucleic Acids Res. 2020; 48:D756–D761. - PMC - PubMed
    1. Karolchik D., Hinrichs A.S., Furey T.S., Roskin K.M., Sugnet C.W., Haussler D., Kent W.J.. The UCSC Table Browser data retrieval tool. Nucleic Acids Res. 2004; 32:D493–D496. - PMC - PubMed
    1. Fernandes J.D., Hinrichs A.S., Clawson H., Gonzalez J.N., Lee B.T., Nassar L.R., Raney B.J., Rosenbloom K.R., Nerli S., Rao A.A. et al. .. The UCSC SARS-CoV-2 Genome Browser. Nat. Genet. 2020; 52:991–998. - PMC - PubMed
    1. Landrum M.J., Chitipiralla S., Brown G.R., Chen C., Gu B., Hart J., Hoffman D., Jang W., Kaur K., Liu C. et al. .. ClinVar: improvements to accessing data. Nucleic Acids Res. 2020; 48:D835–D844. - PMC - PubMed

Publication types