. 2020 Dec;19(12):e13275.
doi: 10.1111/acel.13275. Epub 2020 Nov 22.

G6PD overexpression protects from oxidative stress and age-related hearing loss

Affiliations

G6PD overexpression protects from oxidative stress and age-related hearing loss

Jose M Bermúdez-Muñoz et al. Aging Cell. 2020 Dec.

Abstract

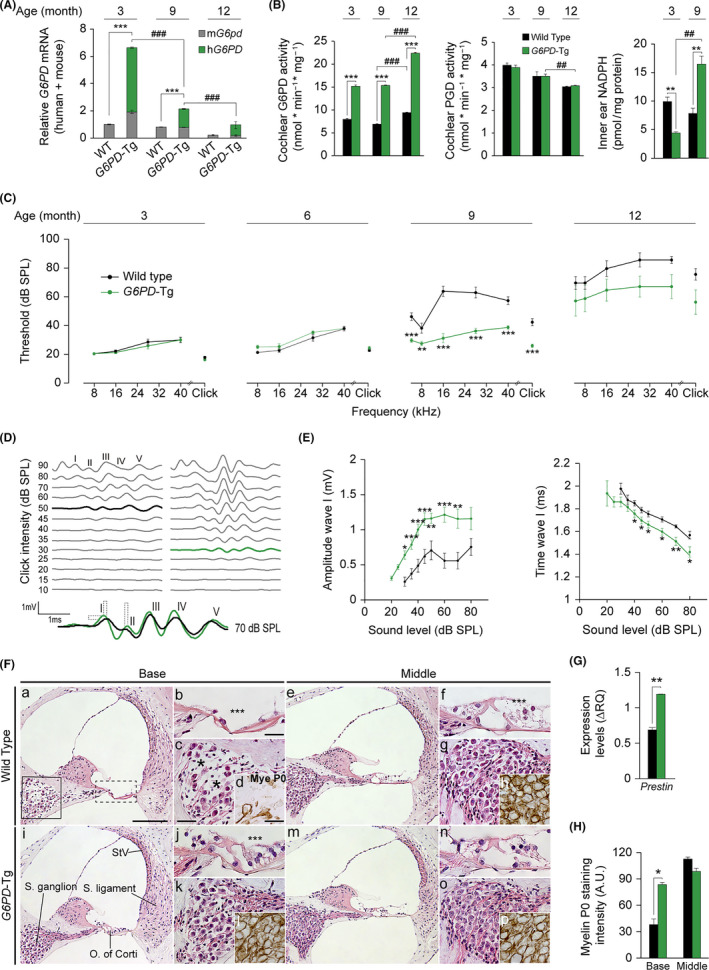
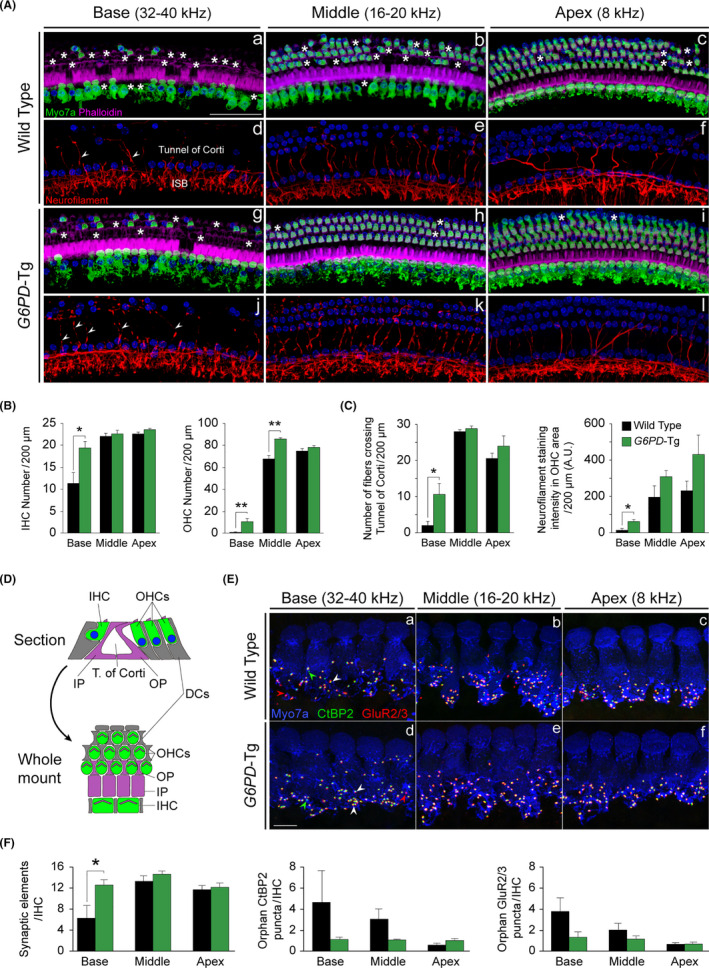
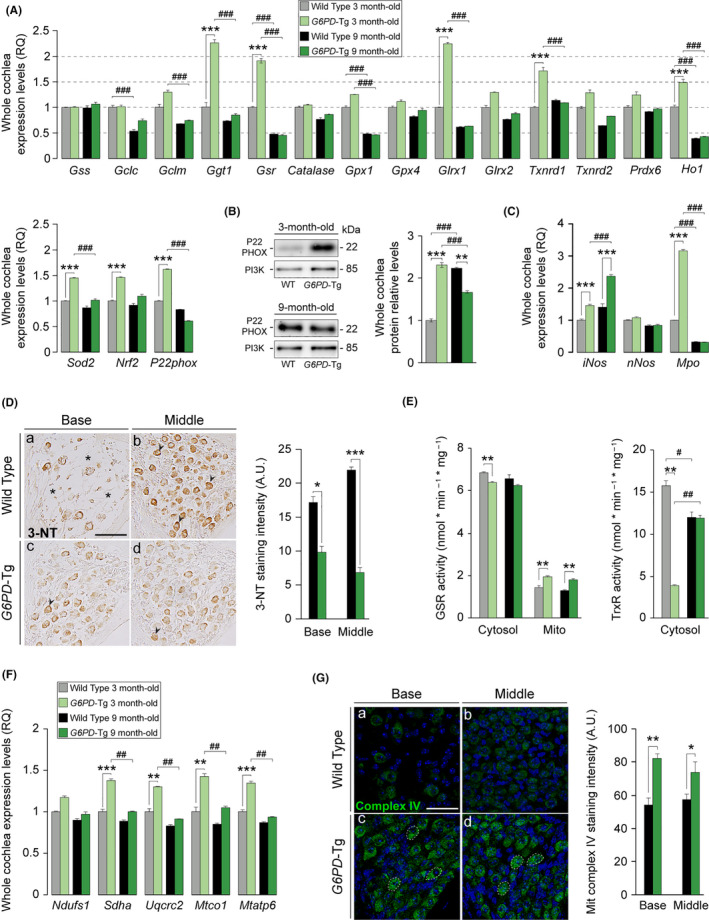
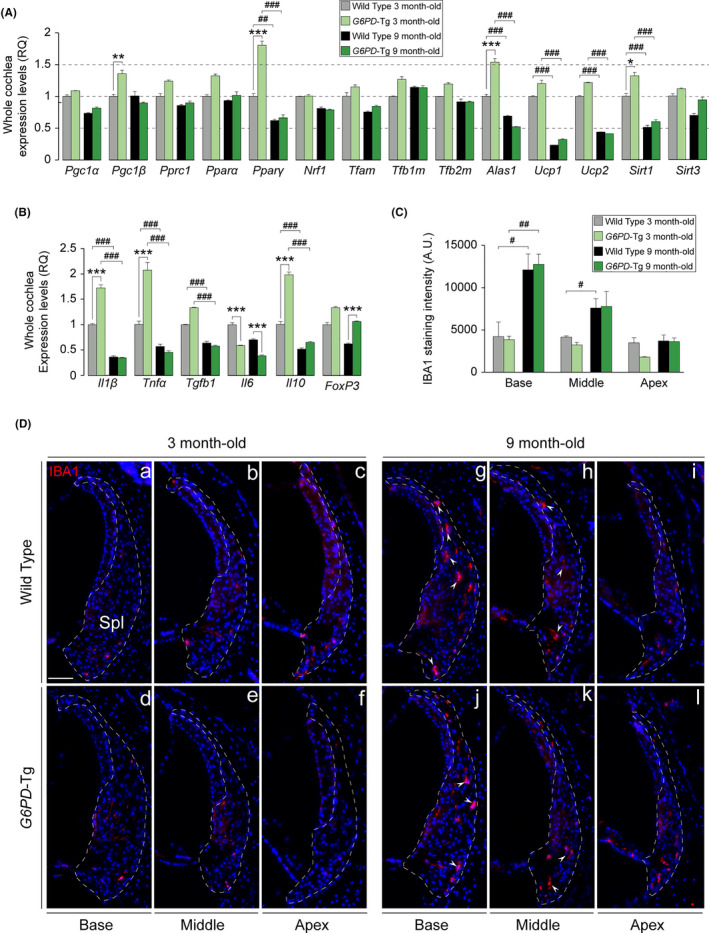
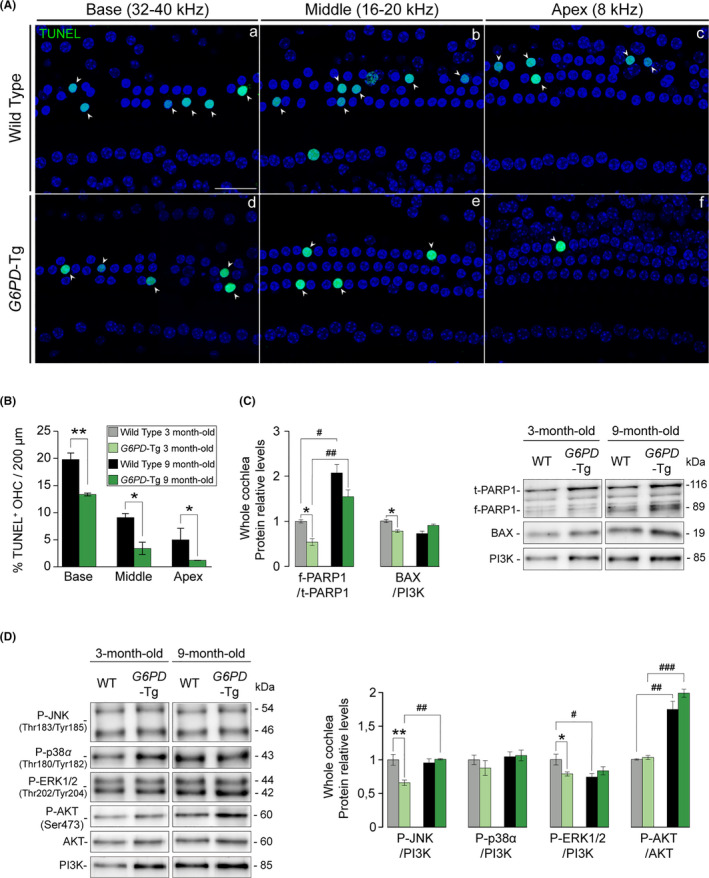
Aging of the auditory system is associated with the incremental production of reactive oxygen species (ROS) and the accumulation of oxidative damage in macromolecules, which contributes to cellular malfunction, compromises cell viability, and, ultimately, leads to functional decline. Cellular detoxification relies in part on the production of NADPH, which is an important cofactor for major cellular antioxidant systems. NADPH is produced principally by the housekeeping enzyme glucose-6-phosphate dehydrogenase (G6PD), which catalyzes the rate-limiting step in the pentose phosphate pathway. We show here that G6PD transgenic mice (G6PD-Tg), which show enhanced constitutive G6PD activity and NADPH production along life, have lower auditory thresholds than wild-type mice during aging, together with preserved inner hair cell (IHC) and outer hair cell (OHC), OHC innervation, and a conserved number of synapses per IHC. Gene expression of antioxidant enzymes was higher in 3-month-old G6PD-Tg mice than in wild-type counterparts, whereas the levels of pro-apoptotic proteins were lower. Consequently, nitration of proteins, mitochondrial damage, and TUNEL+ apoptotic cells were all lower in 9-month-old G6PD-Tg than in wild-type counterparts. Unexpectedly, G6PD overexpression triggered low-grade inflammation that was effectively resolved in young mice, as shown by the absence of cochlear cellular damage and macrophage infiltration. Our results lead us to propose that NADPH overproduction from an early stage is an efficient mechanism to maintain the balance between the production of ROS and cellular detoxification power along aging and thus prevents hearing loss progression.

Keywords: ARHL; NADPH; TrxR; aging; glutathione.


Conflict of interest statement

The authors declare no conflict of interest.

Figures

Figure 1
Figure 1
G6PD‐Tg mice show better hearing and preserved cochlear cytoarchitecture. (A) Relative levels of total cochlear G6PD mRNA in G6PD‐Tg and WT mice. Expression levels were calculated as the addition of the 2−ΔCt for the murine and human G6PD primers using 18s as a reference gene and normalization to levels in 3‐month‐old WT mice. RT‐qPCR data are presented as mean ± SEM of triplicate measurements from pooled samples of three 3‐ and 9‐month‐old mice per condition, and mean ± SEM of 3 individual samples of 12‐month‐old mice. (B) G6PD and PGD activities measured from pooled samples of three cochleae in 3‐ and 9‐month‐old mice per condition. NADPH levels measured from pooled inner ears of three 3‐ and 9‐month‐old mice per condition. Data are presented relative to milligram of protein in samples. Data presented as mean ± SEM of at least duplicate measurements. Statistical significance was analyzed by Student's t test: *G6PD‐Tg vs WT, # 9‐ and 12‐month‐old mice vs 3‐ and 9‐month‐old mice, respectively (*, #p < 0.05; **, ##p < 0.01; ***, ###p < 0.001). (C) ABR thresholds in response to click and tone burst stimuli (4, 8, 16, 28, 40 kHz) in 3‐, 6‐, 9‐, and 12‐month‐old WT and G6PD‐Tg mice. (D) Representative ABR recordings in response to click stimulus of WT (left) and G6PD‐Tg (right) mice at 9 months of age; thresholds are highlighted. Overlapped ABR waves recorded in response to 70 dB SPL stimuli in WT (black) and G6PD‐Tg (green) mice. (E) Input–output ABR wave I amplitude and latency plotted against intensity (dB SPL) for 9‐month‐old mice. Statistical significance was analyzed by Student's t test: *G6PD‐Tg vs WT in C and E (*p < 0.05; **p < 0.01; ***p < 0.001). (F) Representative basal and middle turns hematoxylin–eosin staining and MyeP0 immunolabeling of paraffin‐embedded cochlear midmodiolar sections of 9‐month‐old G6PD‐Tg and WT mice (n = 4 each group). Scale bars: 125 µm in a, 50 µm in b, and c and 25 µm in d. (G) Cochlear gene expression of Prestin in 9‐month‐old mice. Expression levels were calculated as ΔRQ normalized to expression data for 3‐month‐old mice for each condition and using 18s as a reference gene. Values are presented as mean ± SEM of triplicate measurements from pooled samples of 3 mice per condition. (H) MyeP0 intensity of spiral ganglion neurons in 9‐month‐old mice; at least 3 different measurements per turn of each mouse were taken (n = 4 mice per group). Values are presented as mean ± SEM. Statistical significance between genotypes was analyzed by Student's t test (*p < 0.05; **p < 0.01; ***p < 0.001)
Figure 2
Figure 2
G6PD‐Tg mice show preserved hair sensory cells and innervation. (A) Representative confocal images of the organ of Corti basal (32–40 kHz), middle (16–20 kHz), and apical (8 kHz) turns of 9‐month‐old mice of both genotypes immunolabeled for MyoVIIa (green), neurofilament (red), and phalloidin (purple). Asterisks and arrowheads indicate the absence or presence, respectively, of hair cells and fibers. Inner spiral bundle (ISB). Scale bar: 50 µm. (B) Inner hair cell (IHC) and outer hair cell (OHC)counts in basal (32–40 kHz), middle (16–20 kHz), and apical (8 kHz) regions of the organ of Corti (n = 3 per condition). (C) Number of fibers that reach the OHC region and neurofilament staining intensity in OHC region (n = 3 per condition). (D) Scheme comparing the orientation of the organ of Corti in the midmodiolar section and the whole mount. Hair cells, Deiters’ cells (DCs), and pillar cells (IP & OP) are represented in green, gray, and purple, respectively. (E) Representative confocal images of the organ of Corti basal (32–40 kHz), middle (16–20 kHz), and apical (8 kHz) turns of 9‐month‐old mice of both genotypes immunolabeled for MyoVIIa (blue), CtBP2 (green), and GluR2/3 (red). White arrowheads indicate co‐localized CtBP2‐GluR2/3 puncta, red arrowheads indicate individual postsynaptic marker staining, and green arrowheads indicate individual presynaptic marker staining. Scale bar: 10 µm. (F) Number of synaptic elements (co‐localized CtBP2‐GluR2/3 puncta), orphan CtBP2, and GluR273 puncta per IHC (WT n = 3, G6PD‐Tg n = 4). Data presented as mean ± SEM. Statistical significance between genotypes was analyzed by Student's t test (*p < 0.05; **p < 0.01; ***p < 0.001)
Figure 3
Figure 3
Nine‐month‐old G6PD‐Tg mice have reduced oxidative stress, cochlear oxidative damage, and mitochondrial dysfunction. (A) RT‐qPCR gene expression levels of redox enzymes from whole cochleae pooled samples from three 3‐ and 9‐month‐old mice per condition. Expression levels were calculated as 2−ΔΔCt (RQ), using 18s as a reference gene and normalized to data from 3‐month‐old WT mice. (B) Western blotting of whole cochlear protein extracts, P22PHOX levels were referred to those of PI3K and normalized to data from 3‐month‐old WT mice. Data presented as mean ± SEM of duplicate samples of pooled samples of three 3‐ and 9‐month‐old mice per condition. (C) RT‐qPCR gene expression levels of nitric oxide synthase isoforms and myeloperoxidase from whole cochleae pooled samples from three 3‐ and 9‐month‐old mice per condition. Expression levels were calculated as 2−ΔΔCt (RQ), using 18s as a reference gene and normalized to data from 3‐month‐old WT mice. Data presented as mean ± SEM of triplicate measurements. Statistical significance between genotypes and stages was analyzed by Student's t test: *G6PD‐Tg vs WT, # 9‐month‐old mice vs 3‐month‐old mice (*, #p < 0.05; **, ##p < 0.01; ***, ###p < 0.001). (D) Representative microphotographs of 3‐nitrotyrosine labeling of basal and middle turns of 9‐month‐old G6PD‐Tg and WT mice. Asterisks indicate absence of neurons, and arrowheads indicate presence of positive staining. Scale bar: 50 µm. Staining intensity in spiral ganglion (SG) neurons from mice; at least 3 different microphotographs per turn were evaluated (n = 3 mice per experimental group). Values presented as mean ± SEM. (E) GSR and TrxR activity in cytosolic and mitochondrial (only GSR) fractions measured from pooled samples of three cochleae from three 3‐ and 9‐month‐old mice per condition. Values presented relative to milligram of protein. Data presented as mean ± SEM of at least duplicate measurements. Statistical significance between genotypes and stages was analyzed by Student's t test: *G6PD‐Tg vs WT, # 9‐month‐old mice vs 3‐month‐old mice (*, #p < 0.05; **, ##p < 0.01; ***, ###p < 0.001). (F) RT‐qPCR gene expression levels of mitochondrial complexes components from whole cochleae pooled samples from three 3‐ and 9‐month‐old mice per condition. Expression levels were calculated as 2−ΔΔCt (RQ), using 18s as a reference gene and normalized to data from 3‐month‐old WT mice. Data presented as mean ± SEM of triplicate measurements. Statistical significance between genotypes and stages was analyzed by Student's t test: *G6PD‐Tg vs WT, # 9‐month‐old mice vs 3‐month‐old mice (*, #p < 0.05; **, ##p < 0.01; ***, ###p < 0.001). (G) Mitochondrial complex IV staining intensity of positive stained area of the SG of 9‐month‐old mice. At least 3 different measurements per turn were taken (n = 4 WT, n = 3 G6PD‐Tg). Scale bar: 50 µm. Values are presented as mean ± SEM. Statistical significance between genotypes was analyzed by Student's t test (*p < 0.05; **p < 0.01; ***p < 0.001)
Figure 4
Figure 4
Inflammatory response and macrophage infiltration in the cochlea. (a and b) RT‐qPCR gene expression levels of mitochondrial biogenesis program genes and pro‐ and anti‐inflammatory cytokines from 3 cochleae pools per condition of 3‐ and 9‐month‐old mice, respectively. Expression levels were calculated as 2−ΔΔCt (RQ), using 18s as a reference gene and normalized to WT data. Data presented as mean ± SEM of triplicate samples. (C) IBA1 staining intensity of the spiral ligament (n = 3 WT, n = 3 G6PD‐Tg). Values are presented as mean ± SEM. Statistical significance was analyzed by Student's t test: *G6PD‐Tg vs WT, # 9‐month‐old mice vs 3‐month‐old mice (*, #p < 0.05; **, ##p < 0.01; ***, ###p < 0.001). (D) Representative cochlear cross‐cryosections immunolabeled for IBA1 showing the spiral ligament (Spl) of the basal, middle, and apical turns (outlined) of both genotypes of 3 (a–f) and 9‐month‐old (g–l) mice. Arrowheads highlight positive staining of macrophages. Scale bar: 25 µm
Figure 5
Figure 5
Diminished apoptotic cell death in 9‐month‐old G6PD‐Tg mice. (A) TUNEL assay of organ of Corti whole mounts of 9‐month‐old mice. Representative confocal images of basal (32–40 kHz), middle (16–20 kHz), and apical (8 kHz) regions of the organ of Corti are shown. Arrowheads indicate TUNEL+ staining. Scale bar: 25 µm. (B) Percentage of TUNEL+ outer hair cells (OHC) in 200‐µm sections of basal (32–40 kHz), middle (16–20 kHz), and apical (8 kHz) regions of the organ of Corti (n = 3 per condition). Statistical significance between genotypes was analyzed by Student's t test (*p < 0.05; **p < 0.01; ***p < 0.001). (c and d) Cochlear protein levels were analyzed by Western blotting of pooled samples from three 3‐ and 9‐month‐old mice per condition. Representative blots and quantifications are shown for pro‐apoptotic and pro‐survival proteins. Protein levels were calculated as a ratio f‐PARP1/t‐PARP1, P‐AKT/AKT, or using PI3K as loading controls, and then normalized to data from 3‐month‐old WT mice. Values presented as mean ± SEM. Statistical significance between genotypes was analyzed Student's t test: *G6PD‐Tg vs WT, # 9‐month‐old mice vs 3‐month‐old mice (*, #p < 0.05; **, ##p < 0.01; ***, ###p < 0.001)

References

    1. Balaban, R. S. , Nemoto, S. , & Finkel, T. (2005). Mitochondria, oxidants, and aging. Cell, 120(4), 483–495. 10.1016/j.cell.2005.02.001 - DOI - PubMed
    1. Benkafadar, N. , François, F. , Affortit, C. , Casas, F. , Ceccato, J.‐C. , Menardo, J. , Venail, F. , Malfroy‐Camine, B. , Puel, J.‐L. , & Wang, J. (2019). ROS‐induced activation of DNA damage responses drives senescence‐like state in postmitotic cochlear cells: Implication for hearing preservation. Molecular Neurobiology, 56(8), 5950–5969. 10.1007/s12035-019-1493-6 - DOI - PMC - PubMed
    1. Cediel, R. , Riquelme, R. , Contreras, J. , Diaz, A. , & Varela‐Nieto, I. (2006). Sensorineural hearing loss in insulin‐like growth factor I‐null mice: a new model of human deafness. European Journal of Neuroscience, 23(2), 587–590. 10.1111/j.1460-9568.2005.04584.x - DOI - PubMed
    1. Celaya, A. M. , Sánchez‐Pérez, I. , Bermúdez‐Muñoz, J. M. , Rodríguez‐de la Rosa, L. , Pintado‐Berninches, L. , Perona, R. , Murillo‐Cuesta, S. , & Varela‐Nieto, I. (2019). Deficit of mitogen‐activated protein kinase phosphatase 1 (DUSP1) accelerates progressive hearing loss. Elife, 8 10.7554/eLife.39159 - DOI - PMC - PubMed
    1. Ferrucci, L. , Gonzalez‐Freire, M. , Fabbri, E. , Simonsick, E. , Tanaka, T. , Moore, Z. , Salimi, S. , Sierra, F. , & Cabo, R. (2019). Measuring biological aging in humans: A quest. Aging Cell, 19, e13080, 10.1111/acel.13080 - DOI - PMC - PubMed

Publication types

MeSH terms