. 2021 Mar;14(3):541-555.
doi: 10.1016/j.jcmg.2020.10.023. Epub 2020 Nov 4.

High Prevalence of Pericardial Involvement in College Student Athletes Recovering From COVID-19

Affiliations

High Prevalence of Pericardial Involvement in College Student Athletes Recovering From COVID-19

Daniel Brito et al. JACC Cardiovasc Imaging. 2021 Mar.

Abstract

Objectives: This study sought to explore the spectrum of cardiac abnormalities in student athletes who returned to university campus in July 2020 with uncomplicated coronavirus disease 2019 (COVID-19).

Background: There is limited information on cardiovascular involvement in young individuals with mild or asymptomatic COVID-19.

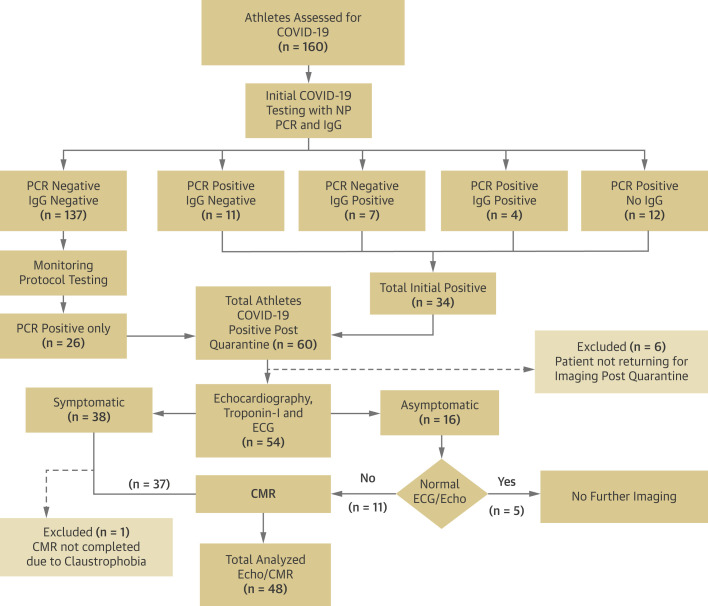
Methods: Screening echocardiograms were performed in 54 consecutive student athletes (mean age 19 years; 85% male) who had positive results of reverse transcription polymerase chain reaction nasal swab testing of the upper respiratory tract or immunoglobulin G antibodies against severe acute respiratory syndrome coronavirus type 2. Sequential cardiac magnetic resonance imaging was performed in 48 (89%) subjects.

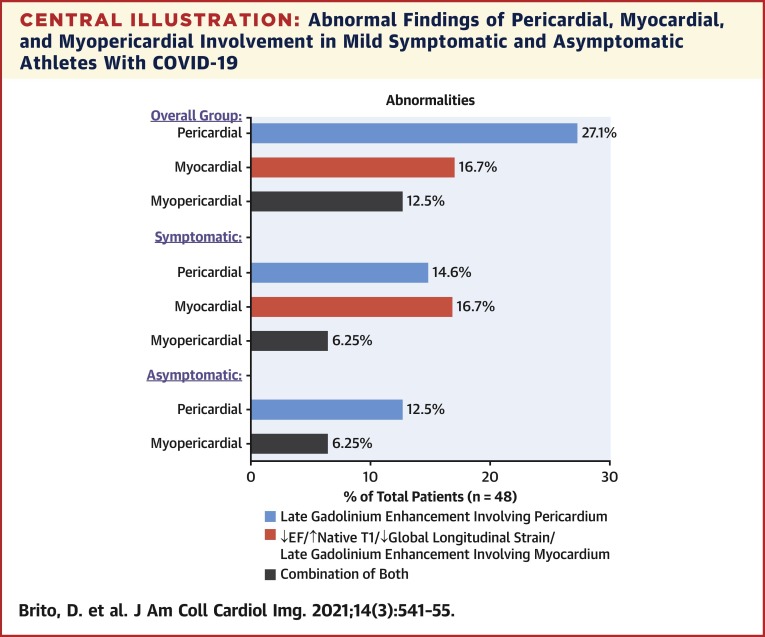
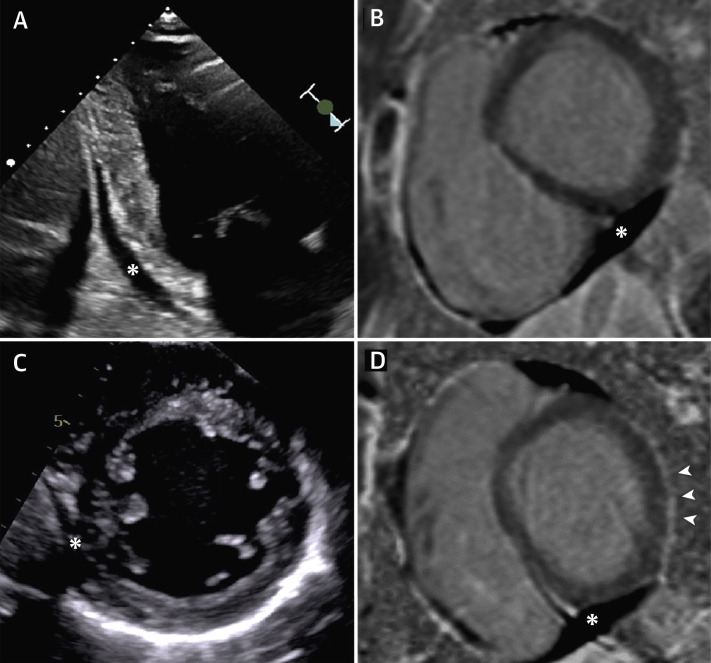
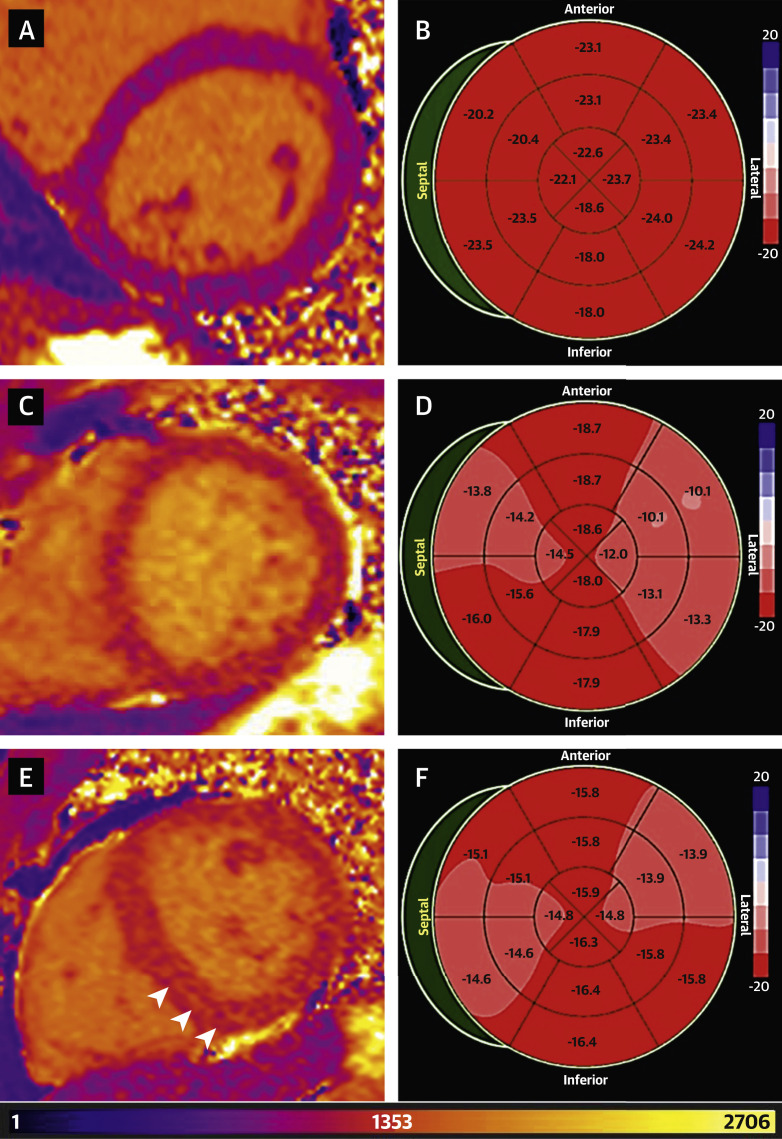
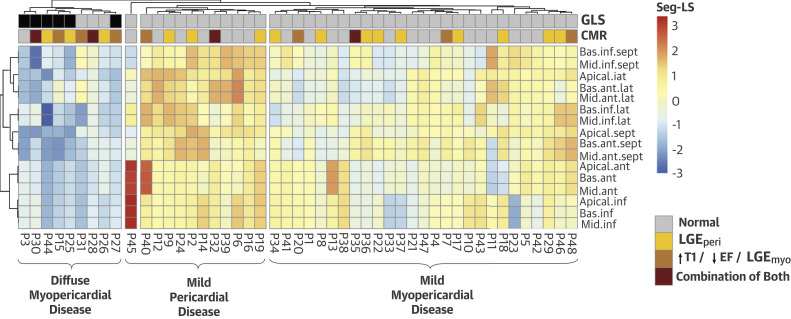
Results: A total of 16 (30%) athletes were asymptomatic, whereas 36 (66%) and 2 (4%) athletes reported mild and moderate COVID-19 related symptoms, respectively. For the 48 athletes completing both imaging studies, abnormal findings were identified in 27 (56.3%) individuals. This included 19 (39.5%) athletes with pericardial late enhancements with associated pericardial effusion. Of the individuals with pericardial enhancements, 6 (12.5%) had reduced global longitudinal strain and/or an increased native T1. One patient showed myocardial enhancement, and reduced left ventricular ejection fraction or reduced global longitudinal strain with or without increased native T1 values was also identified in an additional 7 (14.6%) individuals. Native T2 findings were normal in all subjects, and no specific imaging features of myocardial inflammation were identified. Hierarchical clustering of left ventricular regional strain identified 3 unique myopericardial phenotypes that showed significant association with the cardiac magnetic resonance findings (p = 0.03).

Conclusions: More than 1 in 3 previously healthy college athletes recovering from COVID-19 infection showed imaging features of a resolving pericardial inflammation. Although subtle changes in myocardial structure and function were identified, no athlete showed specific imaging features to suggest an ongoing myocarditis. Further studies are needed to understand the clinical implications and long-term evolution of these abnormalities in uncomplicated COVID-19.

Keywords: CMR; COVID-19; athletes; echocardiography; strain.


Conflict of interest statement

Funding Support and Author Disclosures This work is supported in part by funds from the National Science Foundation (NSF: # 1920920) National Institute of General Medical Sciences of the National Institutes of Health (NIH: #5U54GM104942-04). The content is solely the responsibility of the authors and does not necessarily represent the official views of the National Institutes of Health or the National Science Foundation. Dr. Sengupta has received consulting for HeartSciences, Kencor Health, and Ultromics. All other authors have reported that they have no relationships relevant to the contents of this paper to disclose.

Figures

None
Graphical abstract
Figure 1
Figure 1
COVID-19 Student Athlete Study Outline Flowchart showing the flow and disposition of participants at each stage of the study. CMR = cardiac magnetic resonance; COVID-19 = coronavirus disease-2019; ECG = electrocardiogram; Echo = echocardiogram; IgG = immunoglobulin G; NP = nasopharyngeal; PCR = polymerase chain reaction.
Figure 2
Figure 2
Symptomatic COVID-19 Athlete With Cardiac Involvement (A) Steady-state free precession cardiac magnetic resonance cine still frame in the midventricular short-axis view showing an absence of fat tissue (arrowheads) along the pericardial lining (Video 1). (B) Cardiac magnetic resonance phase-segmented inversion recovery sequence in the midventricular short-axis view demonstrates pericardial enhancement in the inferolateral wall (arrowheads), as well as a pericardial effusion (10.3 mm), localized inferiorly (asterisk). (C and D) Steady-state free precession and phase-segmented inversion recovery sequence in 3-chamber view again confirmed the presence of pericardial enhancement (arrowheads in D) and the lack of fat signal (arrowheads in C) (Video 2). (E) A 2-dimensional echocardiogram in the parasternal short-axis view was concordant with a small pericardial effusion localized inferiorly (asterisk). (F) A significant reduction in global longitudinal strain (14.5%) was recorded. Native T1 relaxation time of the myocardium was increased at 997 ms. ASR = anterior right superior; COVID-19 = coronavirus disease-2019; RI = right inferior.
Figure 3
Figure 3
Two Asymptomatic COVID-19 Athletes With Cardiac Involvement (A to D) Patient #1: cardiac magnetic resonance phase-segmented inversion recovery sequences demonstrated pericardial enhancement in the basal to middle anterolateral wall of the left ventricle (arrowheads). (A) 4-chamber view. (B) Short-axis view. (C) Steady-state free precession cardiac magnetic resonance cine still frame in the midventricular short-axis view demonstrating a lack of fat tissue signal (Video 3). (D) Despite a normal left ventricular ejection fraction (57%) and the absence of any myocardial involvement on cardiac magnetic resonance (native T1 relaxation time assessed from left ventricular midseptal segments was normal at 950 ms), speckle tracking imaging–derived left ventricular global longitudinal strain was reduced (12.2%). (E to H) Patient #2: phase-segmented inversion recovery sequences on cardiac magnetic resonance demonstrating pericardial enhancement (arrowheads) in the anterolateral wall of the left ventricle and pockets of pericardial effusion (10.3 mm, F) localized inferiorly and anteriorly (asterisk). (G) Native. Despite a normal left ventricular ejection fraction (60%) and the absence of any myocardial involvement on cardiac magnetic resonance (native T1 relaxation time assessed from left ventricular midseptal segments was normal at 963 ms), speckle tracking imaging–derived left ventricular global longitudinal strain was reduced (14.2%). ARS = anterior right superior; COVID-19 = coronavirus disease-2019; PLI = posterior left inferior.
Figure 4
Figure 4
Pericardial Effusions in 2 Asymptomatic Athletes (A and B) Echocardiography in the apical 2-chamber view and the cardiac magnetic resonance phase-segmented inversion recovery sequence short-axis view showing pericardial effusion located inferiorly and anteriorly, respectively (2-dimensional echocardiography: 6.5 mm; cardiac magnetic resonance: 10.6 mm; asterisk). (C and D) A second athlete with pericardial effusion seen on echocardiography and cardiac magnetic resonance (asterisk). The inferior pocket measured 12.7 mm. In addition, note the pericardial enhancement (arrowheads).
Figure 5
Figure 5
CMR End-Diastolic Frame From Cine, ShMOLLI Noncontrast T1 Map (A and B) Patient #1: A young asymptomatic athlete with evidence of normal findings on a cardiac magnetic resonance (CMR) native T1 myocardial parametric map (midseptum, 927 ms) in (A) the mid–short-axis view, as well as (B) a normal 2-dimensional speckle tracking echocardiography–derived segmental strain pattern of the left ventricle (global longitudinal strain: 22.1%). (C and D) Patient #2: myocardial involvement in a symptomatic young athlete with a coronavirus disease 2019 diagnosis shows increased native T1 (note the diffuse increase in T1 appreciated as a red-orange color change in the T1 map and measured in the midseptum as 1,001 ms). (D) The left ventricle also showed a significantly reduced global longitudinal strain (15%). (E and F) Patient #3: Myocardial involvement in a symptomatic young athlete. Cardiac magnetic resonance native T1 map with evidence of midmyocardial enhancement (arrowheads; this is also appreciated in the 4-chamber view) (Supplemental Figure 1) in the inferoseptal wall of the left ventricle With diffuse increased native T1 (measured in the midseptum as 992 ms) and (F) the left ventricle showing reduced global longitudinal strain (15.3%). ShMOLLI = Shortened Modified Look Lockers Inversion.
Central Illustration
Abnormal Findings of Pericardial, Myocardial, and Myopericardial Involvement in Mild Symptomatic and Asymptomatic Athletes With COVID-19 Data are presented as percentage of the total symptomatic/asymptomatic patients with coronavirus disease-2019 (COVID-19) who underwent both echocardiography and cardiac magnetic resonance, (n = 48). The definition of different cardiac involvements is as follows: 1) pericardial: presence of late enhancement with pericardial effusion; 2) myocardial: presence of any of the following: a) left ventricular ejection fraction (EF) <50%, b) global longitudinal strain <16%, (c) late enhancement involving myocardium, and c) native T1 increase ≥990 ms; and 3) myopericardial: combination of both myocardial and pericardial involvement.
Figure 6
Figure 6
Comparison of CMR and Echocardiographic Findings In the heatmap, the rows represent the different segmental strains, and the columns correspond to the patients. Euclidean measure for distance matrix and complete agglomeration method were applied to generate the cluster dendrograms on the top and the left of the heatmap. A red-blue color representation is used in presenting the relative intensity decrease in segmental strains across patients. The top row identifies the presence of abnormal global longitudinal strain (GLS) (<16, black boxes) from echocardiography. The second row identifies the category of cardiac magnetic resonance (CMR) abnormalities as shown in legend. ant = anterior; bas = basal; EF = ejection fraction; inf = inferior; LGEmyo = late gadolinium enhancement involving myocardium; LGEperi = late gadolinium enhancement involving pericardium; seg-LS = segmental longitudinal strain; sept = septal; T1 = native T1.

Comment in

References

    1. Huang L., Zhao P., Tang D. Cardiac involvement in patients recovered from COVID-2019 identified using magnetic resonance imaging. J Am Coll Cardiol Img. 2020;13:2330–2339. - PMC - PubMed
    1. Wang Y., Wang Y., Chen Y., Qin Q. Unique epidemiological and clinical features of the emerging 2019 novel coronavirus pneumonia (COVID-19) implicate special control measures. J Med Virol. 2020;92:568–576. - PMC - PubMed
    1. Zhou F., Yu T., Du R. Clinical course and risk factors for mortality of adult inpatients with COVID-19 in Wuhan, China: a retrospective cohort study. Lancet. 2020;395:1054–1062. - PMC - PubMed
    1. Puntmann V.O., Carerj M.L., Wieters I. Outcomes of cardiovascular magnetic resonance imaging in patients recently recovered from coronavirus disease 2019 (COVID-19) JAMA Cardiol. 2020;5:1265–1273. - PMC - PubMed
    1. Rajpal S., Tong M.S., Borchers J. Cardiovascular magnetic resonance findings in competitive athletes recovering from COVID-19 infection. JAMA Cardiol. 2021;6:116–118. - PMC - PubMed

Publication types