

Bioinformatics Analysis Reveals Diagnostic Markers and Vital Pathways Involved in Acute Coronary Syndrome
- PMID: 33224526
- PMCID: PMC7670299
- DOI: 10.1155/2020/3162581
Bioinformatics Analysis Reveals Diagnostic Markers and Vital Pathways Involved in Acute Coronary Syndrome
Abstract
Background: Acute coronary syndrome (ACS) has a high incidence and mortality rate. Early detection and intervention would provide clinical benefits. This study aimed to reveal hub genes, transcription factors (TFs), and microRNAs (miRNAs) that affect plaque stability and provide the possibility for the early diagnosis and treatment of ACS.
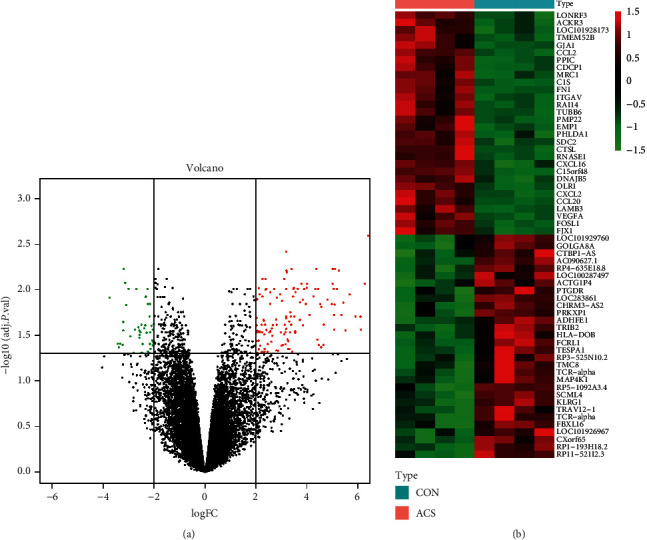
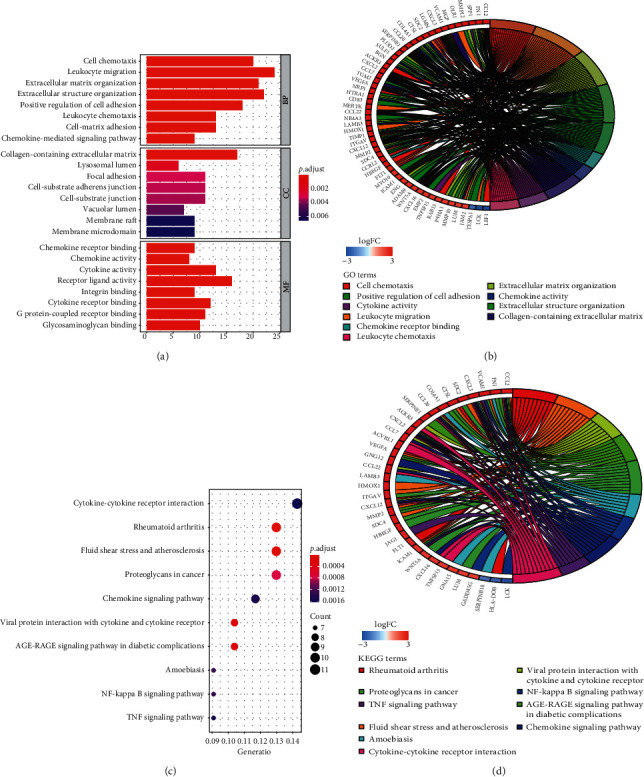
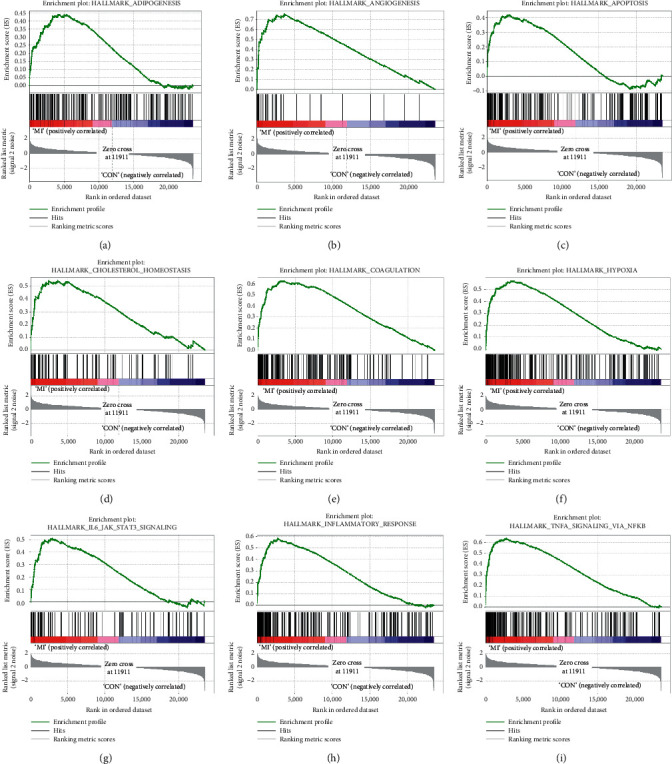
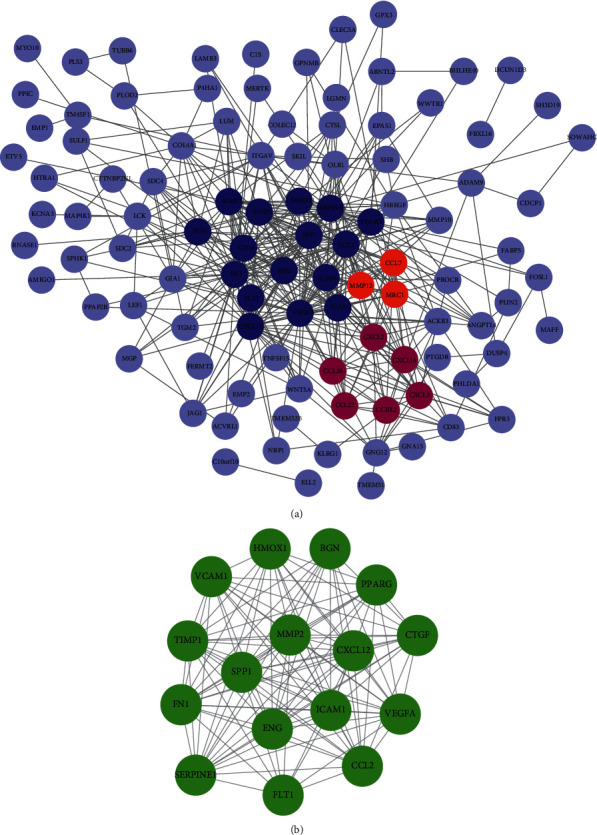
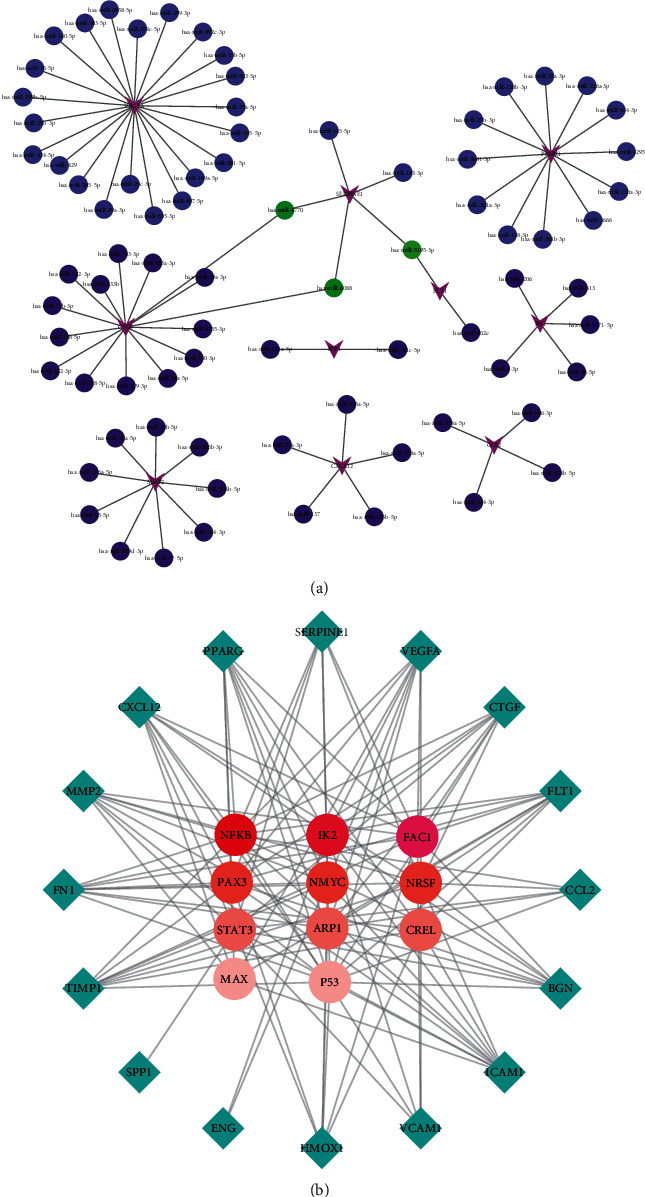
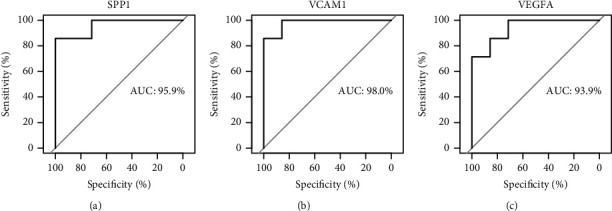
Methods: We obtained gene expression matrix GSE19339 for ACS patients and healthy subjects from public database. The differentially expressed genes (DEGs) were screened using Limma package in R software. The biological functions of DEGs were shown by Gene Ontology (GO), Kyoto Encyclopedia of Genes and Genomes (KEGG), and Gene Set Enrichment Analysis (GSEA). Protein-protein interaction (PPI) network was mapped in Cytoscape, followed by screening of hub genes based on the Molecular Complex Detection (MCODE) plug-in. Functional Enrichment analysis tool (FunRich) and Database for Annotation, Visualization and Integrated Discovery (DAVID) were used to predict miRNAs and TFs, respectively. Finally, GSE60993 expression matrix was chosen to plot receiver operating characteristic (ROC) curves with the aim of further assessing the reliability of our findings.
Results: We obtained 176 DEGs and further identified 16 hub genes by MCODE. The results of functional enrichment analysis showed that DEGs mediated inflammatory response and immune-related pathways. Among the predicted miRNAs, hsa-miR-4770, hsa-miR-5195, and hsa-miR-6088 all possessed two target genes, which might be closely related to the development of ACS. Moreover, we identified 11 TFs regulating hub gene transcriptional processes. Finally, ROC curves confirmed three genes with high confidence (area under the curve > 0.9), including VEGFA, SPP1, and VCAM1.
Conclusion: This study suggests that three genes (VEGFA, SPP1, and VCAM1) were involved in the molecular mechanisms of ACS pathogenesis and could serve as biomarkers of disease progression.
Copyright © 2020 Mingshuang Li et al.
Conflict of interest statement
The authors declare that they have no conflicts of interest.
Figures
Similar articles
-
VWF, CXCL8 and IL6 might be potential druggable genes for acute coronary syndrome (ACS).Comput Biol Chem. 2019 Dec;83:107125. doi: 10.1016/j.compbiolchem.2019.107125. Epub 2019 Sep 13. Comput Biol Chem. 2019. PMID: 31550669
-
Study on potential differentially expressed genes in stroke by bioinformatics analysis.Neurol Sci. 2022 Feb;43(2):1155-1166. doi: 10.1007/s10072-021-05470-1. Epub 2021 Jul 27. Neurol Sci. 2022. PMID: 34313877 Free PMC article.
-
Integrative analysis of potential biomarkers and immune cell infiltration in Parkinson's disease.Brain Res Bull. 2021 Dec;177:53-63. doi: 10.1016/j.brainresbull.2021.09.010. Epub 2021 Sep 16. Brain Res Bull. 2021. PMID: 34536521
-
Genes associated with inflammation may serve as biomarkers for the diagnosis of coronary artery disease and ischaemic stroke.Lipids Health Dis. 2020 Mar 12;19(1):37. doi: 10.1186/s12944-020-01217-7. Lipids Health Dis. 2020. PMID: 32164735 Free PMC article.
-
Integrative bioinformatics approaches for identifying potential biomarkers and pathways involved in non-obstructive azoospermia.Transl Androl Urol. 2021 Jan;10(1):243-257. doi: 10.21037/tau-20-1029. Transl Androl Urol. 2021. PMID: 33532314 Free PMC article.
Cited by
-
Stability of exosomes in the postmortem serum and preliminary study on exosomal miRNA expression profiling in serum from myocardial infarction cadavers.Int J Legal Med. 2023 May;137(3):825-834. doi: 10.1007/s00414-022-02913-y. Epub 2022 Nov 23. Int J Legal Med. 2023. PMID: 36416963
-
Low Levels of MicroRNA-10a in Cardiovascular Endothelium and Blood Serum Are Related to Human Atherosclerotic Disease.Cardiol Res Pract. 2021 Jul 15;2021:1452917. doi: 10.1155/2021/1452917. eCollection 2021. Cardiol Res Pract. 2021. PMID: 34336268 Free PMC article.
-
An Overview of Two Old Friends Associated with Platelet Redox Signaling, the Protein Disulfide Isomerase and NADPH Oxidase.Biomolecules. 2023 May 17;13(5):848. doi: 10.3390/biom13050848. Biomolecules. 2023. PMID: 37238717 Free PMC article.
References
LinkOut - more resources
Full Text Sources
Research Materials
Miscellaneous
