Review
. 2020 Oct;10(5):1389-1414.
doi: 10.21037/cdt-20-253.

Optical coherence tomography: fundamentals and clinical utility

Affiliations
Review

Optical coherence tomography: fundamentals and clinical utility

Vijayakumar Subban et al. Cardiovasc Diagn Ther. 2020 Oct.

Abstract

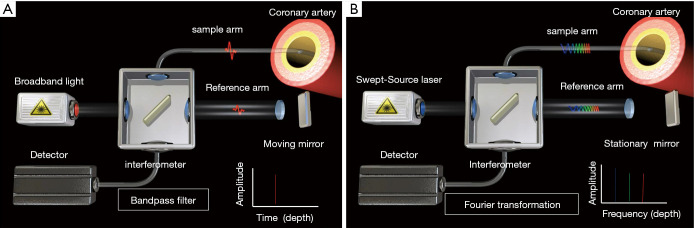
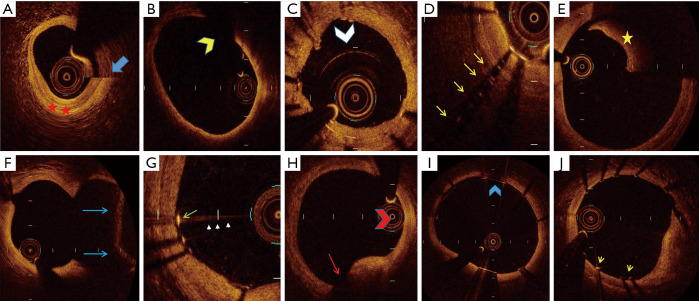
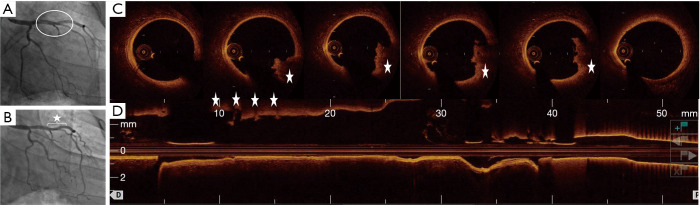
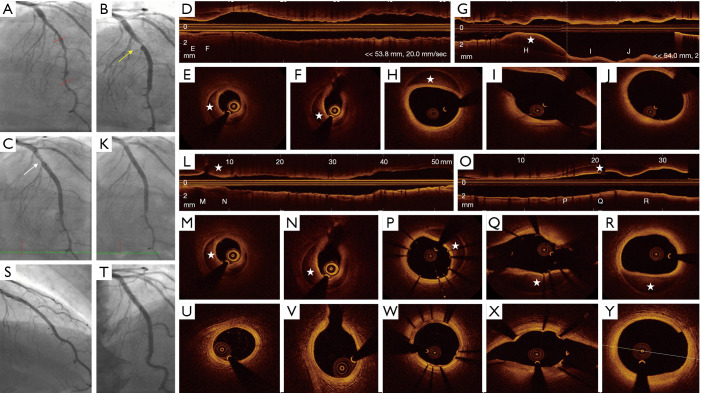
Although coronary angiography is the standard method employed to assess the severity of coronary artery disease and to guide treatment strategies, it provides only 2D image of the intravascular lesions. In contrast, intravascular imaging modalities such as optical coherence tomography (OCT) produce cross-sectional images of the coronary arteries at a far greater spatial resolution, capable of accurately determining vessel size as well as plaque morphology, eliminating many of the disadvantages inherent to angiography. This review will discuss the role of OCT in the catherization laboratory for the assessment and management of coronary disease.

Keywords: Acute coronary syndromes (ACS); coronary artery disease (CAD); tomography, optical coherence.


Conflict of interest statement

Conflicts of Interest: Both authors have completed the ICMJE uniform disclosure forms (available at http://dx.doi.org/10.21037/cdt-20-253). The series “Intracoronary Imaging” was commissioned by the editorial office without any funding or sponsorship. The authors have no other conflicts of interest to declare.

Figures

Figure 1
Figure 1
Types of OCT systems. (A) Time domain OCT system uses a broadband light source and a moving reference mirror. The interference signals with different time delays are captured sequentially that limits the rate of image acquisition and pull back speed (2–3 mm/s). (B) Frequency domain OCT system uses swept-source laser (wavelengths from 1,250 to 1,350 nm) and a fixed reference mirror. Fourier transformation is used to process the interference patterns at different wave lengths simultaneously to provide the amplitude and frequency profiles of the light signals reflected from different depths. This allows FD detector to measure all the signals that forms an A-line at the same time and rapid image acquisition (figures courtesy: Abbott Vascular). OCT, optical coherence tomography.
Figure 2
Figure 2
OCT appearance of normal coronary artery and color map of different tissue components. (A) Normal coronary artery on OCT imaging has 4 components. (I) Imaging catheter (C); (II) guide wire (GW); (III) echolucent lumen (L) and (IV) three-layered vessel wall (I: intima, M: media, A: adventitia). (B) Colormap combining backscattering and attenuation coefficients for calcific (C), fibrous (F) and lipid (L) tissue. OCT, optical coherence tomography. B modified from Xu et al. (5).
Figure 3
Figure 3
Types of atherosclerotic lesions. (A,B) Non-atherosclerotic intimal lesions: (A) intimal thickening (fibrous/fibro-fatty appearing tissue with thickness 300–600 µ, arrows); (B) intimal xanthoma [signal-rich lumen border with deep signal attenuation and sharp lateral borders suggestive of superficial macrophage foam cells (star)]. (C,D,E) Progressive atherosclerotic lesions: (C) pathological intimal thickening (intimal thickness >600 µ, lipid/necrotic core less than one quadrant). OCT imaging does not differentiate between pathological intimal thickening and fibrous plaque; (D) fibroatheroma (lipid/necrotic core more than one quadrant); (E) thin-cap fibroatheroma [Fibrous cap thickness <65 µ, arrow heads]. (F,G,H) Features of vulnerability for rupture: (F) macrophage accumulation (signal rich spots with shadowing, arrows) and spotty calcification (yellow circle); (G) cholesterol crystals [signal-rich streaks with low attenuation, white circle]; (H) microvessels [signal voids within the plaque, white arrow heads]. (I,J,K,L,M,N) Lesions with thrombus: (I) plaque rupture (fibrous cap rupture with underlying cavity at 3-o’clock position); (J) definitive erosion (intact fibrous cap with attached red thrombus, yellow star); (K) probable erosion [large red thrombus (intraluminal mass with high backscatter and high attenuation, yellow star) with no adjacent necrotic core/lipid or superficial calcium (not shown in the figure)]; (L) calcified nodule (eruptive calcification with thrombus, 2- to 5-o’clock position); (M) white thrombus (intraluminal mass with high backscatter and low attenuation, white circle); (N) recanalized thrombus (intraluminal mass with channels, white stars). (O,P,Q,R) Advanced lesions: (O) healed plaque erosion (layered pattern with no evidence of underlying rupture, arrow head); (P) fibrous plaque (intimal thickness >600 µ, homogeneous, high backscatter, low attenuation); (Q) circumferential calcium plate (heterogeneous, low backscatter, low attenuation, clear borders, blue stars); (R) nodular calcification (red star). OCT, optical coherence tomography.
Figure 4
Figure 4
OCT monitor screen display. (A) Angiogram marked with references [blue markers] and minimal lumen area (yellow marker); (B) cross sectional image; (C) lumen profile with automatic measurement and display of proximal and distal references (blue boxes), minimal lumen area (yellow box), and lesion length (blue line); (D) long view. OCT, optical coherence tomography.
Figure 5
Figure 5
OCT artifacts. (A) Non-uniform rotational deformity (red stars) and sew up artifact (blue arrow); (B) obliquity artifact, yellow arrow head indicates shadowing artifact from guide wire; (C) multiple reflection artifact (white arrow head); (D) stent reverberations (yellow arrows); (E) residual blood artifact (yellow star); (F) fold over artifact (blue arrows); (G) saturation artifact (white arrow heads) & blooming artifact (green arrow); (H) proximity artifact (red arrow head) and tangential signal drop-out (red arrow); (I) merry go round artifact (blue arrow head); (J) sunflower artifact (yellow arrow heads).
Figure 6
Figure 6
Definite plaque erosion. A 40-year-old gentleman presented to a peripheral hospital with acute anterior wall myocardial infarction and thrombolysed with tenecteplase. He underwent coronary angiogram (CAG) as part of pharmacoinvasive percutaneous coronary intervention (PCI). CAG showed proximal left anterior descending coronary artery lesion with large thrombus burden (white circle) and thrombolysis in myocardial infarction (TIMI) III flow (A). PCI was deferred and he was treated with low molecular weight heparin for 5 days. His repeat CAG showed good thrombus resolution (B, star). Optical coherence tomography (OCT) imaging showed small mixed thrombus attached to the intimal surface without lumen compromise (C,D, white stars). He was treated with dual antiplatelet therapy.
Figure 7
Figure 7
Treatment algorithm to guide the use of intravascular imaging in patients presenting with acute coronary syndromes. CAD, coronary artery disease; ECG, electrocardiogram; LV, left ventricle; TTE, transthoracic echocardiogram; SCAD, spontaneous coronary artery dissection; PCI, percutaneous coronary intervention; RWMA, regional wall motion abnormality; MRI, magnetic resonance imaging; MINOCA, myocardial infarction with non-obstructed coronary arteries. Johnson et al. (32). Reprinted by permission of Oxford University Press on behalf of the European Society of Cardiology.
Figure 8
Figure 8
Spontaneous coronary dissection. A 52-year-old female presented with non-ST-segment elevation myocardial infarction. Her coronary angiogram (A) showed atherosclerosis like lesion in the distal left anterior descending coronary artery (LAD, lesion is marked with red lines). She underwent drug-eluting stent (DES) implantation for the same. Post-stenting CAG showed hazy lesion suggestive of dissection/hematoma at the proximal edge (B, yellow arrow). Additional DES was implanted proximally. A similar looking lesion appeared at the proximal edge (C, white arrow). At this stage, OCT imaging was performed which showed intramural hematoma at both distal [(D) long view; (E,F) cross sectional views showing distal edge hematoma, stars)] and proximal edges [(G) long view; (H) cross sectional view showing distal edge hematoma, star; (I) LAD/diagonal/septal trifurcation and proximal vessel free of hematoma; (J) proximal LAD]. The proximal hematoma was covered with a third DES (K). Final OCT showed distal edge hematoma (stars) which was non-progressive [(L) long view; (M,N) cross sectional views] and hematoma extension proximally beyond the diagonal branch (stars) [(O) long view; (P,Q,R) cross sectional views]. (S,T) Follow-up CAG at 6 months showing normal appearing stent edges. (U,V,W,X,Y) Corresponding OCT cross-sectional views showing complete healing of the hematoma. Stars indicate intramural hematoma. CAG, coronary angiography; OCT, optical coherence tomography.
Figure 9
Figure 9
OCT-guided provisional stenting to distal RCA bifurcation. (A) Coronary angiogram showing distal RCA bifurcation post provisional stenting into postero-lateral branch (yellow circle). (B) 3D bifurcation view showing link free type side branch ostial strut morphology and distal cell wire crossing (blue arrow). (C) 3D bifurcation view post kissing balloon dilatation showing the side branch ostium free of stent struts (yellow arrow). OCT, optical coherence tomography; RCA, right coronary artery.
Figure 10
Figure 10
OCT-guided bioresorbable scaffold implantation in a severely calcified lesion (stars). (A) Baseline angiographic and OCT images. OCT image showing 180° lesion calcification. (B) Post cutting balloon dilatation OCT image showing crack (arrow) at 11 o’clock position. (C) Final images showing optimally expanded scaffold.
Figure 11
Figure 11
Transplant vasculopathy in a patient 3 years post-transplantation. (A) CAG showing three focal stenoses in left anterior descending coronary artery (arrows). (B,C,D,E,F,G) OCT cross-sectional images of mid- to ostio-proximal segment. OCT frames (B,C,D) and (F) show layered fibrous plaque (the dark appearance of the plaque results from immature fibrous tissue). (E) and (G) show intimal thickening. Balloon dilatation induced dissection is shown at 6 o’clock position in (C) and 3 o’clock position in (F). Longitudinal OCT view is shown in (H). Red lines on CAG indicate the proximal and distal limits of OCT imaging. OCT, optical coherence tomography; CAG, coronary angiography.
Figure 12
Figure 12
OCT images of strut coverage (A,B) and stent failure (C,D,E,F,G,H,I,J,K,L). (A) Struts coverage with thin homogenous neointima; (B) uncovered stent struts (white arrows); (C,D,E) abnormal neointimal growth with homogeneous pattern (C), layered pattern (D), heterogeneous pattern (E); (F,G,H,I) neoatherosclerosis with lipid rich plaque (yellow star) and white thrombus (blue arrows) (F), plaque rupture (orange arrows) (G), macrophages (red arrows) (H) and calcification (green star) (I); (J,K,L) stent thrombosis with malapposed stent struts (J), late acquired malapposition (K) and persistently uncovered stent struts (yellow arrows indicate white thrombus) (L).
Figure 13
Figure 13
OCT-guided treatment of in-stent restenosis. OCT, optical coherence tomography; NIH, neointimal hyperplasia; POBA, plain ordinary balloon angioplasty; BMS, bare metal stent; DES, drug-eluting stent; DEB, drug-eluting balloon.
Figure 14
Figure 14
OCT-guided treatment of stent thrombosis. OCT, optical coherence tomography; IRA, infarct related artery; ST, stent thrombosis; LST, late stent thrombosis; VLST, very late stent thrombosis; DAPT, dual antiplatelet therapy.

References

    1. DeRouen TA, Murray JA, Owen W. Variability in the analysis of coronary arteriograms. Circulation 1977;55:324-8. 10.1161/01.CIR.55.2.324 - DOI - PubMed
    1. Tearney GJ, Regar E, Akasaka T, et al. Consensus standards for acquisition, measurement, and reporting of intravascular optical coherence tomography studies: a report from the International Working Group for Intravascular Optical Coherence Tomography Standardization and Validation. J Am Coll Cardiol 2012;59:1058-72. 10.1016/j.jacc.2011.09.079 - DOI - PubMed
    1. Jang IK. Cardiovascular OCT Imaging. 2nd edition. Springer, 2020.
    1. van der Sijde JN, Guagliumi G, Sirbu V, et al. The OPTIS Integrated System: real-time, co-registration of angiography and optical coherence tomography. EuroIntervention 2016;12:855-60. 10.4244/EIJV12I7A140 - DOI - PubMed
    1. Xu C, Schmitt JM, Carlier SG, et al. Characterization of atherosclerosis plaques by measuring both backscattering and attenuation coefficients in optical coherence tomography. J Biomed Opt 2008;13:034003. 10.1117/1.2927464 - DOI - PubMed