Efficient Methods for Parameter Estimation of Ordinary and Partial Differential Equation Models of Viral Hepatitis Kinetics
- PMID: 33224865
- PMCID: PMC7676746
- DOI: 10.3390/math8091483
Efficient Methods for Parameter Estimation of Ordinary and Partial Differential Equation Models of Viral Hepatitis Kinetics
Abstract
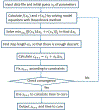
Parameter estimation in mathematical models that are based on differential equations is known to be of fundamental importance. For sophisticated models such as age-structured models that simulate biological agents, parameter estimation that addresses all cases of data points available presents a formidable challenge and efficiency considerations need to be employed in order for the method to become practical. In the case of age-structured models of viral hepatitis dynamics under antiviral treatment that deal with partial differential equations, a fully numerical parameter estimation method was developed that does not require an analytical approximation of the solution to the multiscale model equations, avoiding the necessity to derive the long-term approximation for each model. However, the method is considerably slow because of precision problems in estimating derivatives with respect to the parameters near their boundary values, making it almost impractical for general use. In order to overcome this limitation, two steps have been taken that significantly reduce the running time by orders of magnitude and thereby lead to a practical method. First, constrained optimization is used, letting the user add constraints relating to the boundary values of each parameter before the method is executed. Second, optimization is performed by derivative-free methods, eliminating the need to evaluate expensive numerical derivative approximations. The newly efficient methods that were developed as a result of the above approach are described for hepatitis C virus kinetic models during antiviral therapy. Illustrations are provided using a user-friendly simulator that incorporates the efficient methods for both the ordinary and partial differential equation models.
Keywords: constrained optimization; derivative free optimization; differential equations; multiscale models; parameter estimation; viral hepatitis.
Conflict of interest statement
Conflicts of Interest: The authors declare no conflict of interest. The funders had no role in the design of the study; in the collection, analyses, or interpretation of data; in the writing of the manuscript, or in the decision to publish the results.
Figures


Similar articles
-
HCVMultiscaleFit: A Simulator For Parameter Estimation in Multiscale Models Of Hepatitis C Virus Dynamics.AIP Conf Proc. 2020;2293:420028. doi: 10.1063/5.0026600. Epub 2020 Nov 25. AIP Conf Proc. 2020. PMID: 33349734 Free PMC article.
-
A Parameter Estimation Method for Multiscale Models of Hepatitis C Virus Dynamics.Bull Math Biol. 2019 Oct;81(10):3675-3721. doi: 10.1007/s11538-019-00644-7. Epub 2019 Jul 23. Bull Math Biol. 2019. PMID: 31338739 Free PMC article.
-
Advances in Parameter Estimation and Learning from Data for Mathematical Models of Hepatitis C Viral Kinetics.Mathematics (Basel). 2022 Jun 2;10(12):2136. doi: 10.3390/math10122136. Epub 2022 Jun 19. Mathematics (Basel). 2022. PMID: 36245949 Free PMC article.
-
Analyzing and constraining signaling networks: parameter estimation for the user.Methods Mol Biol. 2012;880:23-39. doi: 10.1007/978-1-61779-833-7_2. Methods Mol Biol. 2012. PMID: 23361979 Review.
-
Analytical solution of linear multi-compartment models with non-zero initial condition and its implementation with R.Transl Clin Pharmacol. 2019 Jun;27(2):43-51. doi: 10.12793/tcp.2019.27.2.43. Epub 2019 Jun 28. Transl Clin Pharmacol. 2019. PMID: 32055580 Free PMC article. Review.
Cited by
-
Understanding the antiviral effects of RNAi-based therapy in HBeAg-positive chronic hepatitis B infection.Sci Rep. 2021 Jan 8;11(1):200. doi: 10.1038/s41598-020-80594-6. Sci Rep. 2021. PMID: 33420293 Free PMC article.
-
Intracellular "In Silico Microscopes"-Comprehensive 3D Spatio-Temporal Virus Replication Model Simulations.Viruses. 2024 May 24;16(6):840. doi: 10.3390/v16060840. Viruses. 2024. PMID: 38932132 Free PMC article.
-
Machine learning for mathematical models of HCV kinetics during antiviral therapy.Math Biosci. 2022 Jan;343:108756. doi: 10.1016/j.mbs.2021.108756. Epub 2021 Dec 6. Math Biosci. 2022. PMID: 34883104 Free PMC article.
References
-
- World Health Organization. Global Hepatitis Report 2017: Web Annex A: Estimations of Worldwide Prevalence of Chronic Hepatitis B Virus Infection: A Systematic Review of Data Published between 1965 and 2017; Technical Report; World Health Organization: Geneva, Switzerland, 2018.
-
- Blach S; Zeuzem S; Manns M; Altraif I; Duberg AS; Muljono DH; Waked I; Alavian SM; Lee MH; Negro F; et al. Global prevalence and genotype distribution of hepatitis C virus infection in 2015: A modelling study. Lancet Gastroenterol. Hepatol 2017, 2, 161–176. - PubMed
-
- Foreman KJ; Marquez N; Dolgert A; Fukutaki K; Fullman N; McGaughey M; Pletcher MA; Smith AE; Tang K; Yuan CW; et al. Forecasting life expectancy, years of life lost, and all-cause and cause-specific mortality for 250 causes of death: Reference and alternative scenarios for 2016–2040 for 195 countries and territories. Lancet 2018, 392, 2052–2090. - PMC - PubMed
Grants and funding
LinkOut - more resources
Full Text Sources
