Identification of Spindle and Kinetochore-Associated Family Genes as Therapeutic Targets and Prognostic Biomarkers in Pancreas Ductal Adenocarcinoma Microenvironment
- PMID: 33224872
- PMCID: PMC7667267
- DOI: 10.3389/fonc.2020.553536
Identification of Spindle and Kinetochore-Associated Family Genes as Therapeutic Targets and Prognostic Biomarkers in Pancreas Ductal Adenocarcinoma Microenvironment
Abstract
Aim: The role of spindle and kinetochore-associated (SKA) genes in tumorigenesis and cancer progression has been widely studied. However, so far, the oncogenic involvement of SKA family genes in pancreatic cancer and their prognostic potential remain unknown.
Methods: Here, we carried out a meta-analysis of the differential expression of SKA genes in normal and tumor tissue. Univariate and multivariate survival analyses were done to evaluate the correlation between SKA family gene expression and pancreas ductal adenocarcinoma (PDAC) prognosis. Joint-effect and stratified survival analysis as well as nomogram analysis were used to estimate the prognostic value of genes. The underlying regulatory and biological mechanisms were identified by Gene set enrichment analysis. Interaction between SKA prognosis-related genes and immune cell infiltration was assessed using the Tumor Immune Estimation Resource tool.
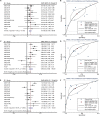
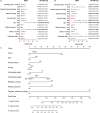
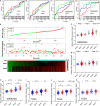
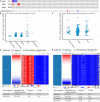
Results: We find that SKA1-3 are highly expressed in PDAC tissues relative to non-cancer tissues. Survival analysis revealed that high expression of SKA1 and SKA3 independently indicate poor prognosis but they are not associated with relapse-free survival. The prognostic value of SKA1 and SKA3 was further confirmed by the nomogram, joint-effect, and stratified survival analysis. Analysis of underlying mechanisms reveals that these genes influence cancer-related signaling pathways, kinases, miRNA, and E2F family genes. Notably, prognosis-related genes are inversely correlated with several immune cells infiltrating levels.
Conclusion: We find that SKA1 and SKA3 expression correlates with prognosis and immune cell infiltration in PDAC, highlighting their potential as pancreatic cancer prognostic biomarkers.
Keywords: bioinformatics analysis; biomarker; immune infiltration; pancreatic cancer; prognosis; spindle and kinetochore associated.
Copyright © 2020 Liu, Jin, Huang, Che and Liu.
Figures


Similar articles
-
Spindle and Kinetochore-associated Family Genes are Prognostic and Predictive Biomarkers in Hepatocellular Carcinoma.J Clin Transl Hepatol. 2022 Aug 28;10(4):627-641. doi: 10.14218/JCTH.2021.00216. Epub 2022 Jan 4. J Clin Transl Hepatol. 2022. PMID: 36062274 Free PMC article.
-
Integrative analysis of prognostic value and immune infiltration of spindle and kinetochore-associated family members in breast cancer.Bioengineered. 2021 Dec;12(2):10905-10923. doi: 10.1080/21655979.2021.1995576. Bioengineered. 2021. PMID: 34845974 Free PMC article.
-
Transcript levels of spindle and kinetochore-associated complex 1/3 as prognostic biomarkers correlated with immune infiltrates in hepatocellular carcinoma.Sci Rep. 2021 May 27;11(1):11165. doi: 10.1038/s41598-021-89628-z. Sci Rep. 2021. PMID: 34045512 Free PMC article.
-
Immune cell infiltrates as prognostic biomarkers in pancreatic ductal adenocarcinoma: a systematic review and meta-analysis.J Pathol Clin Res. 2021 Mar;7(2):99-112. doi: 10.1002/cjp2.192. Epub 2021 Jan 22. J Pathol Clin Res. 2021. PMID: 33481339 Free PMC article.
-
The prognostic value of tumour-infiltrating lymphocytes in pancreatic cancer: a systematic review and meta-analysis.Eur J Cancer. 2020 Jun;132:71-84. doi: 10.1016/j.ejca.2020.03.013. Epub 2020 Apr 22. Eur J Cancer. 2020. PMID: 32334338
Cited by
-
Challenges for Better Diagnosis and Management of Pancreatic and Biliary Tract Cancers Focusing on Blood Biomarkers: A Systematic Review.Cancers (Basel). 2021 Aug 23;13(16):4220. doi: 10.3390/cancers13164220. Cancers (Basel). 2021. PMID: 34439378 Free PMC article. Review.
-
Integrative Transcriptome Profiling Reveals SKA3 as a Novel Prognostic Marker in Non-Muscle Invasive Bladder Cancer.Cancers (Basel). 2021 Sep 17;13(18):4673. doi: 10.3390/cancers13184673. Cancers (Basel). 2021. PMID: 34572901 Free PMC article.
-
Spindle and Kinetochore-associated Family Genes are Prognostic and Predictive Biomarkers in Hepatocellular Carcinoma.J Clin Transl Hepatol. 2022 Aug 28;10(4):627-641. doi: 10.14218/JCTH.2021.00216. Epub 2022 Jan 4. J Clin Transl Hepatol. 2022. PMID: 36062274 Free PMC article.
-
SKA3 Expression as a Prognostic Factor for Patients with Pancreatic Adenocarcinoma.Int J Mol Sci. 2024 May 9;25(10):5134. doi: 10.3390/ijms25105134. Int J Mol Sci. 2024. PMID: 38791174 Free PMC article.
-
Spindle and kinetochore-associated complex subunit 3 (SKA3) promotes stem cell-like properties of hepatocellular carcinoma cells through activating Notch signaling pathway.Ann Transl Med. 2021 Sep;9(17):1361. doi: 10.21037/atm-21-1572. Ann Transl Med. 2021. PMID: 34733913 Free PMC article.
References
LinkOut - more resources
Full Text Sources

