

Global Gene Expression Profiling Reveals Isorhamnetin Induces Hepatic-Lineage Specific Differentiation in Human Amniotic Epithelial Cells
- PMID: 33224947
- PMCID: PMC7674172
- DOI: 10.3389/fcell.2020.578036
Global Gene Expression Profiling Reveals Isorhamnetin Induces Hepatic-Lineage Specific Differentiation in Human Amniotic Epithelial Cells
Abstract
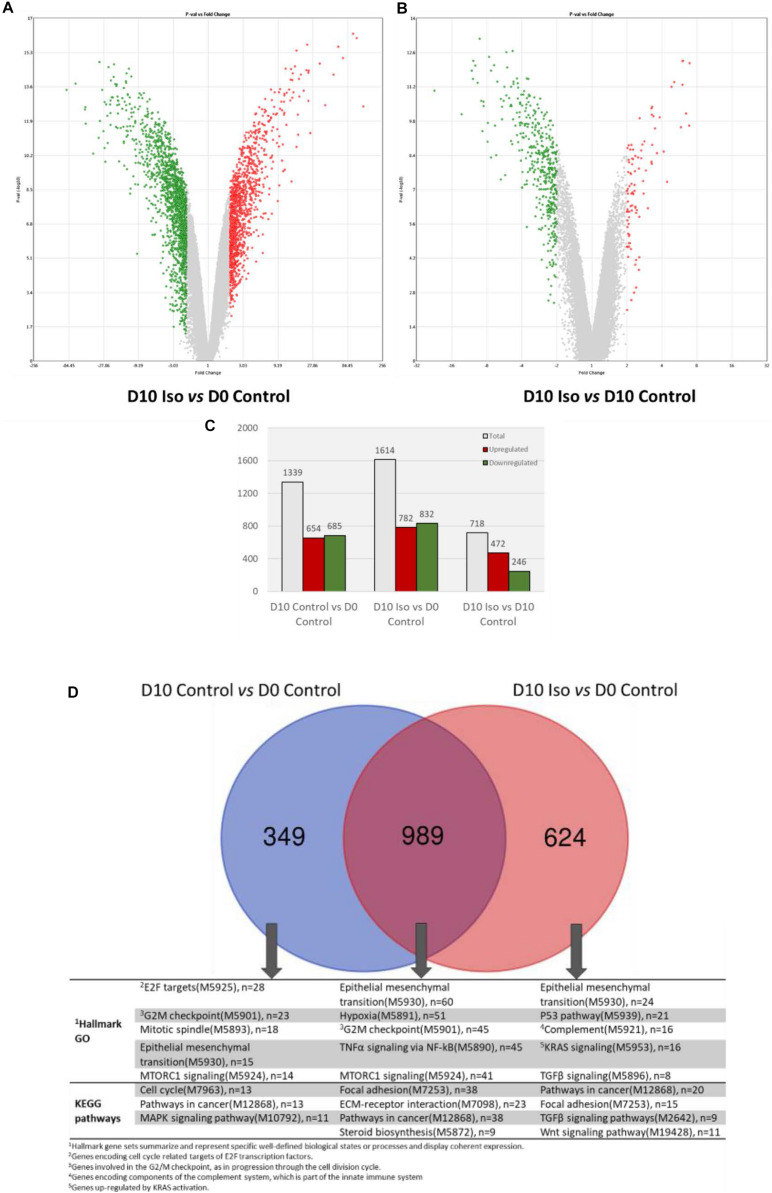
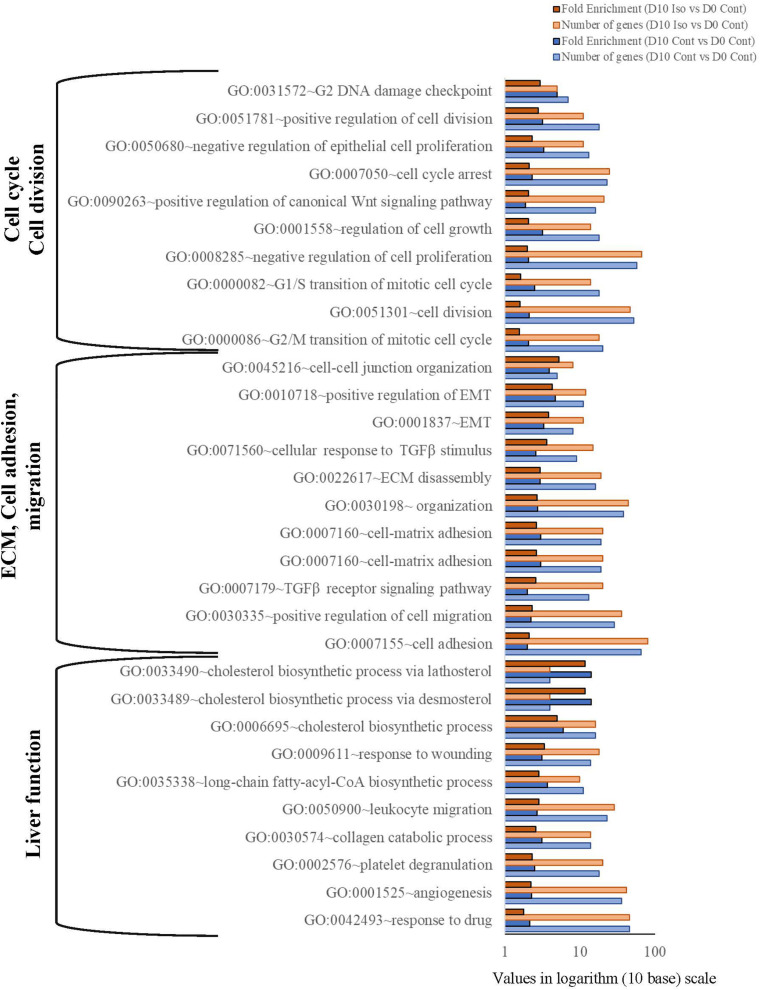
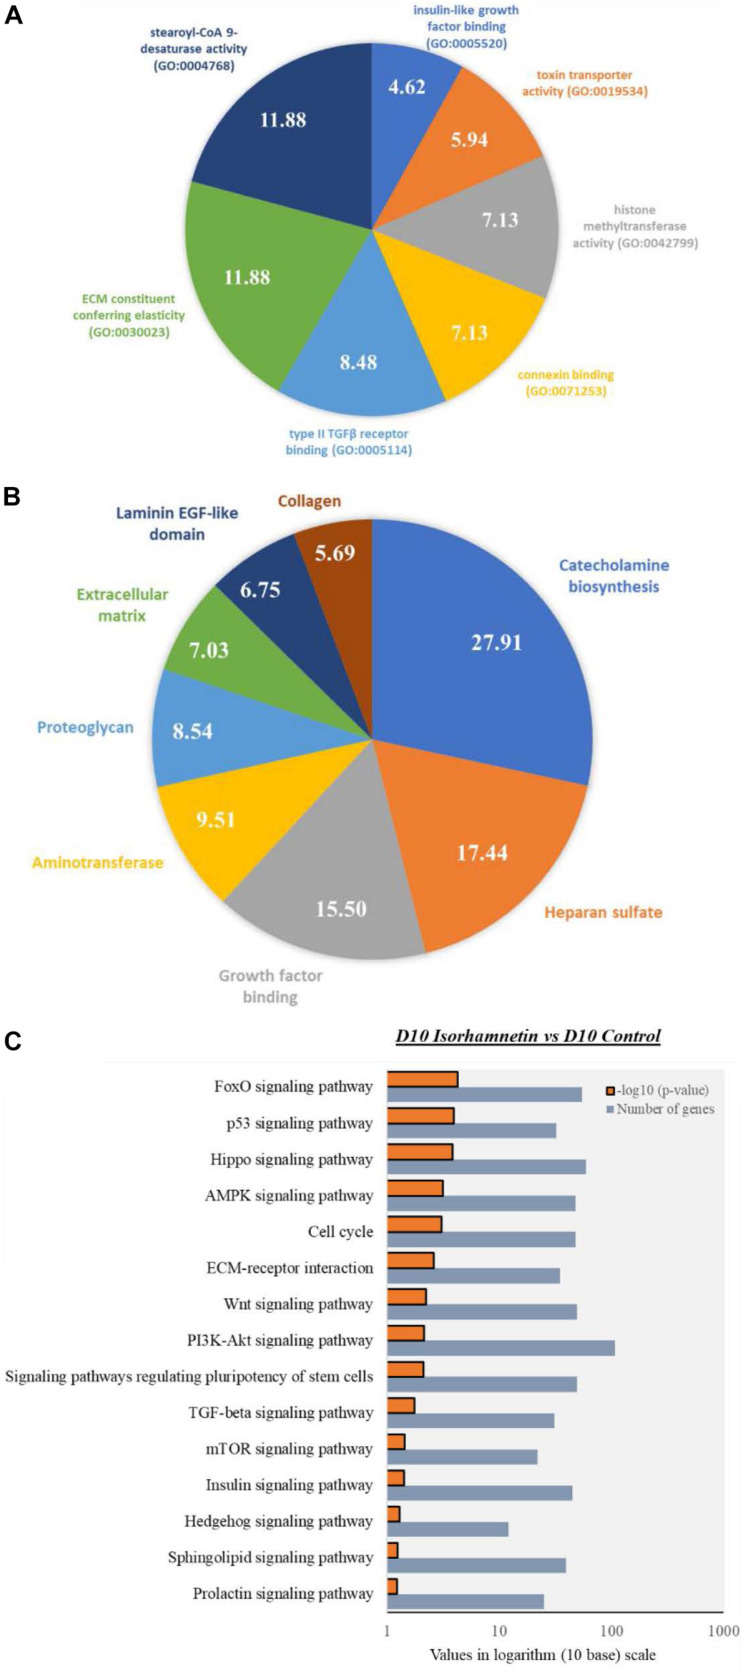
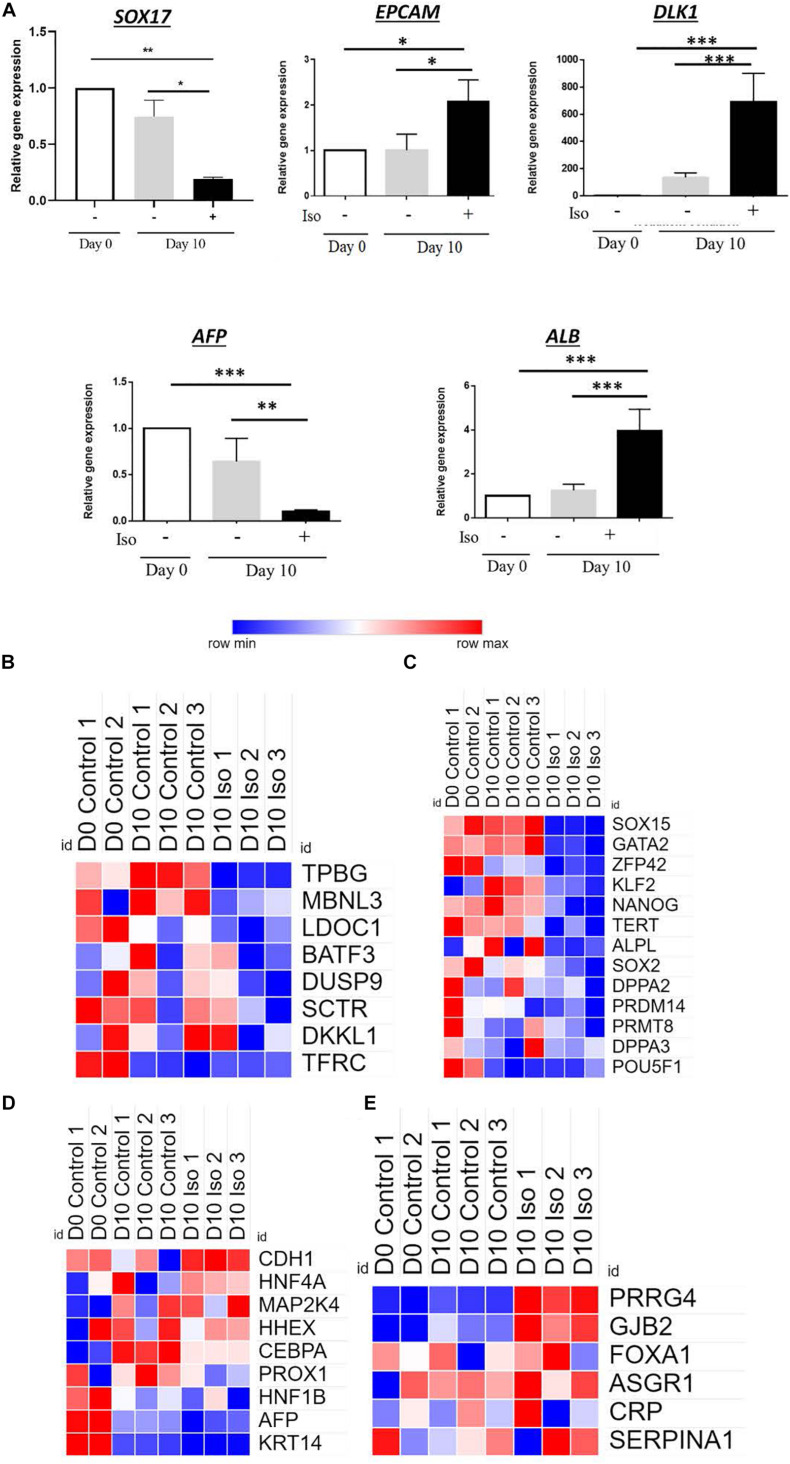
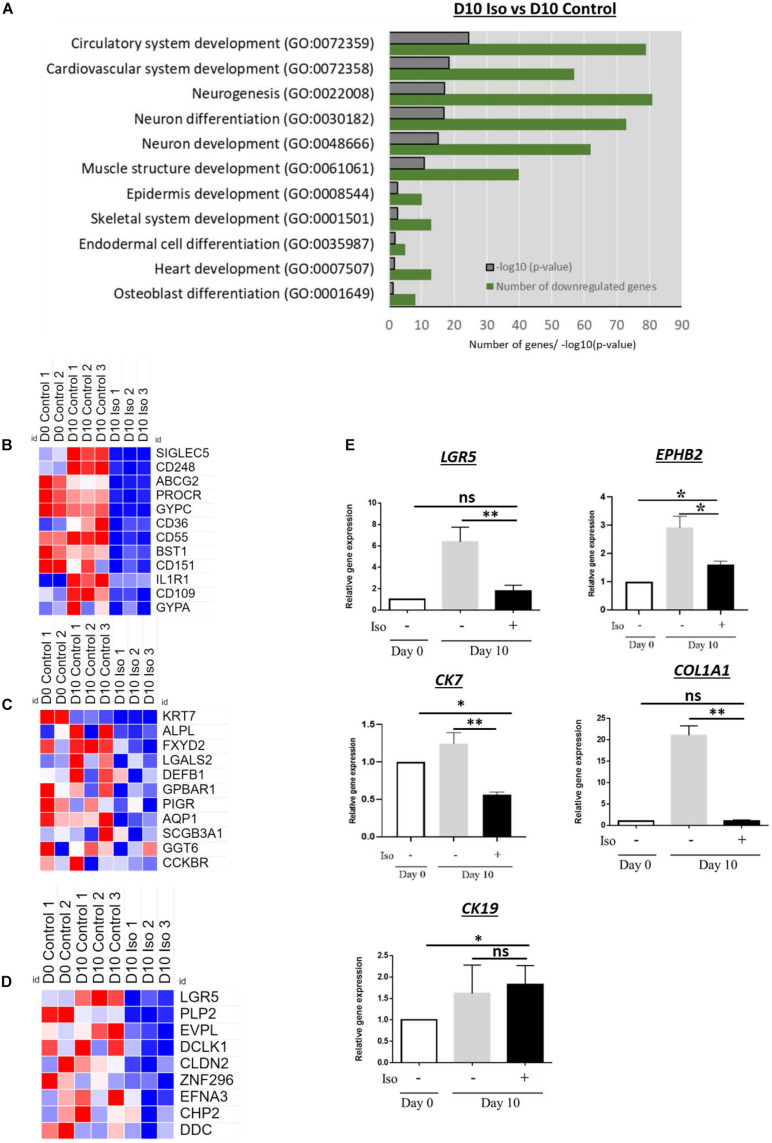
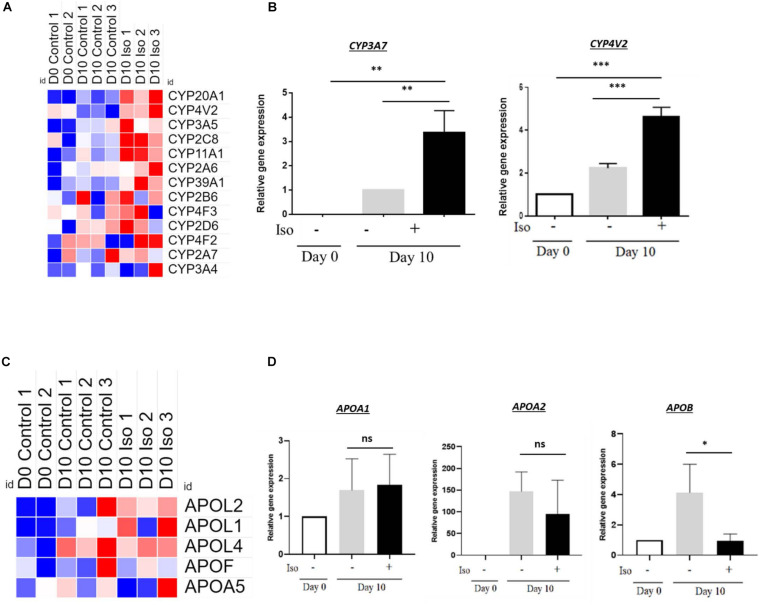
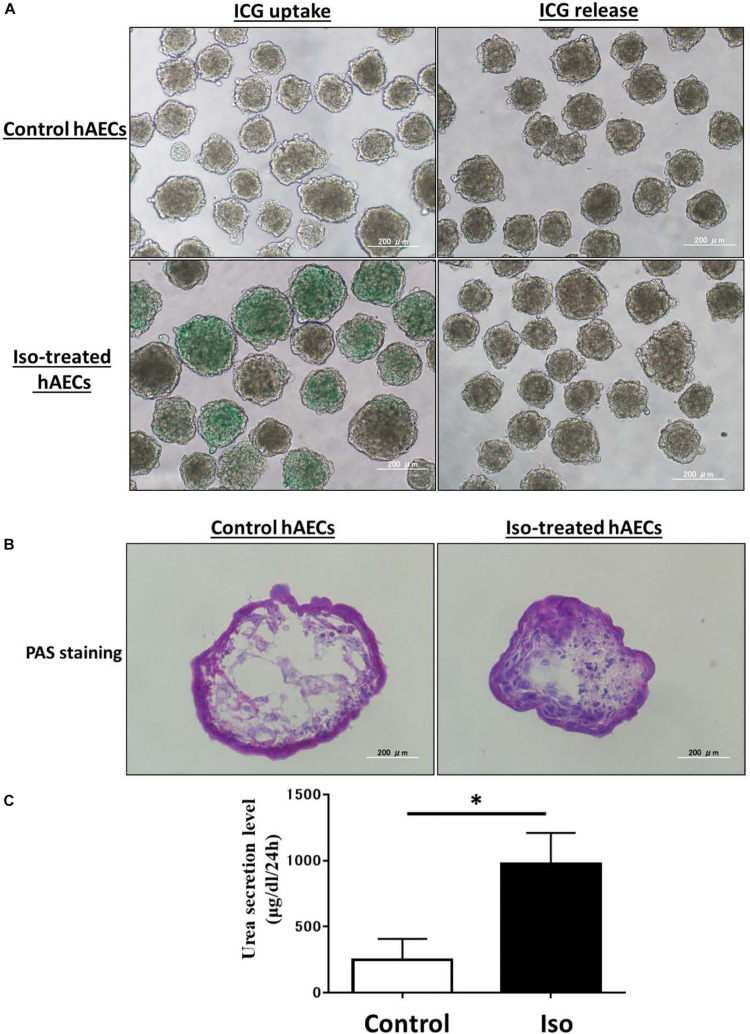
Human amnion epithelial cells (hAECs), derived from discarded term placenta, is anticipated as a new stem cell resource because of their advantages over embryonic stem cells (ESCs) and induced pluripotent stem cells (iPSCs), such as no risk of tumorigenicity and minimal ethical issue. hAECs have been reported to differentiate into hepatic-like cells (HLCs) with variable functionalities suitable for cell-based therapy of end-stage liver diseases, drug screening, and drug toxicity tests. On the other hand, a new research stream has been evolving to use natural compounds as stimulants of stem cell differentiation because of their high availability and minimum side effects. Isorhamnetin is a naturally occurring flavonoid commonly found in fruits and vegetables and has been reported to improve hepatic fibrosis and steatosis. In this present study, we have screened the differentiation potential of isorhamnetin in hAECs. The cells were grown on 3D cell culture and were treated with 20 μM of synthesized isorhamnetin for 10 days without adding any additional growth factors. DNA microarray global gene expression analysis was conducted for differentially expressed genes between isorhamnetin-treated and untreated control cells, gene expression validation was carried out using RT-qPCR method, and finally, several hepatic functions were assessed. Microarray analysis showed that isorhamnetin could activate essential biological processes, molecular functions, and signaling pathways for hepatic differentiation. Hepatic progenitor markers, EPCAM and DLK1, were upregulated in the isorhamnetin-treated hAECs. AFP was downregulated, while ALB was upregulated on Day 10. Furthermore, isorhamnetin-treated cells could show increased CYP enzyme mRNA levels, ICG uptake and release, glycogen storage activity, and urea secretion. Additionally, isorhamnetin-treated cells did not show any trace of transdifferentiation evident by significant downregulation of several colon- and cholangiocyte-specific markers. However, longer treatment with isorhamnetin did not promote hepatic maturation. Altogether, our findings indicate that isorhamnetin has a promising effect on directing the hepatic-lineage specific differentiation in hAECs.
Keywords: hepatic-lineage-specific differentiation; human amnion epithelial cell; isorhamnetin; microarray and bioinformatics; natural compound.
Copyright © 2020 Uchida, Ferdousi, Zheng, Oda and Isoda.
Figures
Similar articles
-
Exploring the Potential Role of Rosmarinic Acid in Neuronal Differentiation of Human Amnion Epithelial Cells by Microarray Gene Expression Profiling.Front Neurosci. 2019 Jul 24;13:779. doi: 10.3389/fnins.2019.00779. eCollection 2019. Front Neurosci. 2019. PMID: 31396047 Free PMC article.
-
Therapeutic efficiency of human amniotic epithelial stem cell-derived functional hepatocyte-like cells in mice with acute hepatic failure.Stem Cell Res Ther. 2018 Nov 21;9(1):321. doi: 10.1186/s13287-018-1063-2. Stem Cell Res Ther. 2018. PMID: 30463600 Free PMC article.
-
Enhanced hepatic differentiation in the subpopulation of human amniotic stem cells under 3D multicellular microenvironment.World J Stem Cells. 2019 Sep 26;11(9):705-721. doi: 10.4252/wjsc.v11.i9.705. World J Stem Cells. 2019. PMID: 31616545 Free PMC article.
-
Human amniotic epithelial stem cells: Hepatic differentiation and regenerative properties in liver disease treatment.Placenta. 2023 Mar 24;134:39-47. doi: 10.1016/j.placenta.2023.02.013. Epub 2023 Feb 28. Placenta. 2023. PMID: 36870301 Review.
-
Development and molecular composition of the hepatic progenitor cell niche.Dan Med J. 2013 May;60(5):B4640. Dan Med J. 2013. PMID: 23673270 Review.
Cited by
-
Human Amniotic Epithelial Cells as a Tool to Investigate the Effects of Cyanidin 3-O-Glucoside on Cell Differentiation.Int J Mol Sci. 2021 Apr 5;22(7):3768. doi: 10.3390/ijms22073768. Int J Mol Sci. 2021. PMID: 33916494 Free PMC article.
-
Regulating cell fate of human amnion epithelial cells using natural compounds: an example of enhanced neural and pigment differentiation by 3,4,5-tri-O-caffeoylquinic acid.Cell Commun Signal. 2021 Feb 24;19(1):26. doi: 10.1186/s12964-020-00697-5. Cell Commun Signal. 2021. PMID: 33627134 Free PMC article.
-
The Efficiency of Stem Cells (SCs) Differentiation into Functional Hepatocytes for Treating Liver Disorders: A Systematic Review.Biomed Res Int. 2023 Jan 12;2023:4868048. doi: 10.1155/2023/4868048. eCollection 2023. Biomed Res Int. 2023. PMID: 36685673 Free PMC article.
-
In Vitro Differentiation of Human Amniotic Epithelial Cells into Hepatocyte-like Cells.Cells. 2022 Jul 7;11(14):2138. doi: 10.3390/cells11142138. Cells. 2022. PMID: 35883581 Free PMC article.
-
Use of cucurbitacins for lung cancer research and therapy.Cancer Chemother Pharmacol. 2021 Jul;88(1):1-14. doi: 10.1007/s00280-021-04265-7. Epub 2021 Apr 6. Cancer Chemother Pharmacol. 2021. PMID: 33825035 Review.
References
LinkOut - more resources
Full Text Sources
Molecular Biology Databases
Miscellaneous