. 2020 Nov 5:8:590008.
doi: 10.3389/fcell.2020.590008. eCollection 2020.

In vivo Neuroregeneration to Treat Ischemic Stroke Through NeuroD1 AAV-Based Gene Therapy in Adult Non-human Primates

Affiliations

In vivo Neuroregeneration to Treat Ischemic Stroke Through NeuroD1 AAV-Based Gene Therapy in Adult Non-human Primates

Long-Jiao Ge et al. Front Cell Dev Biol. .

Abstract

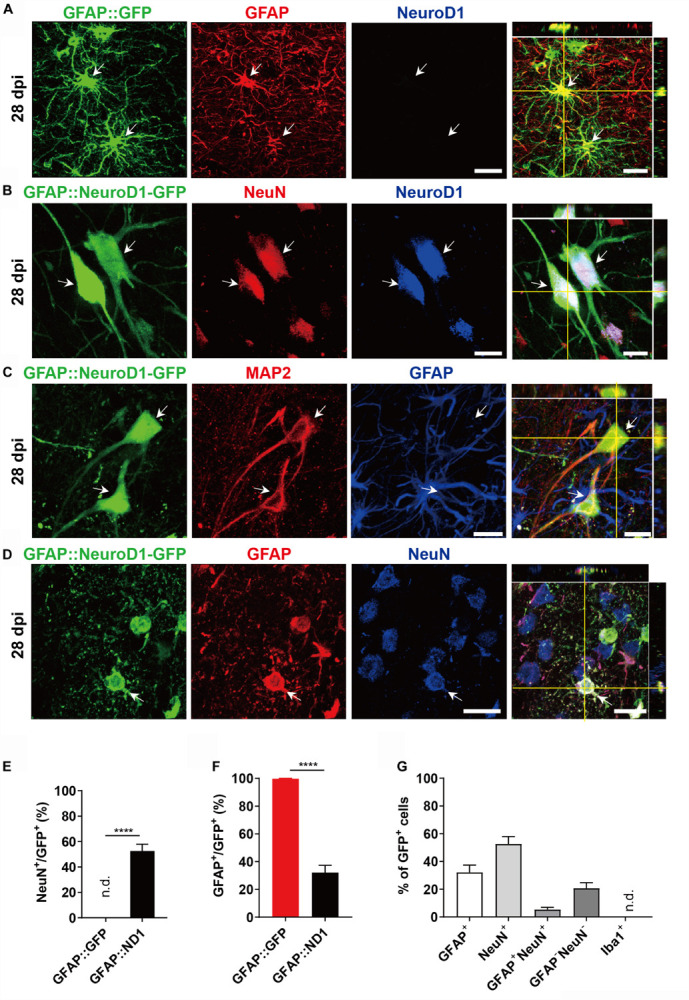
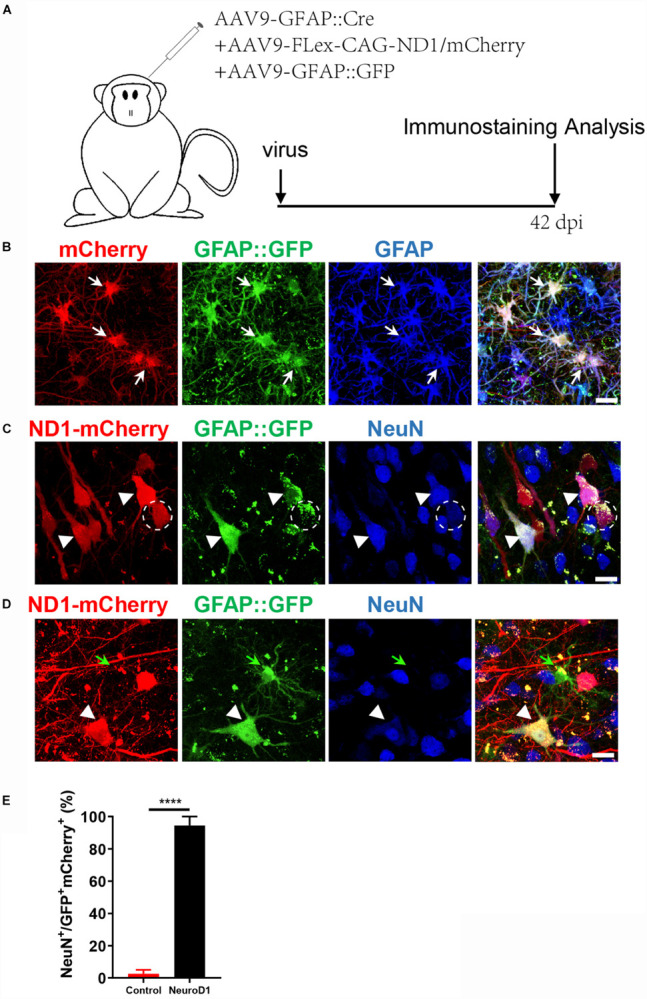
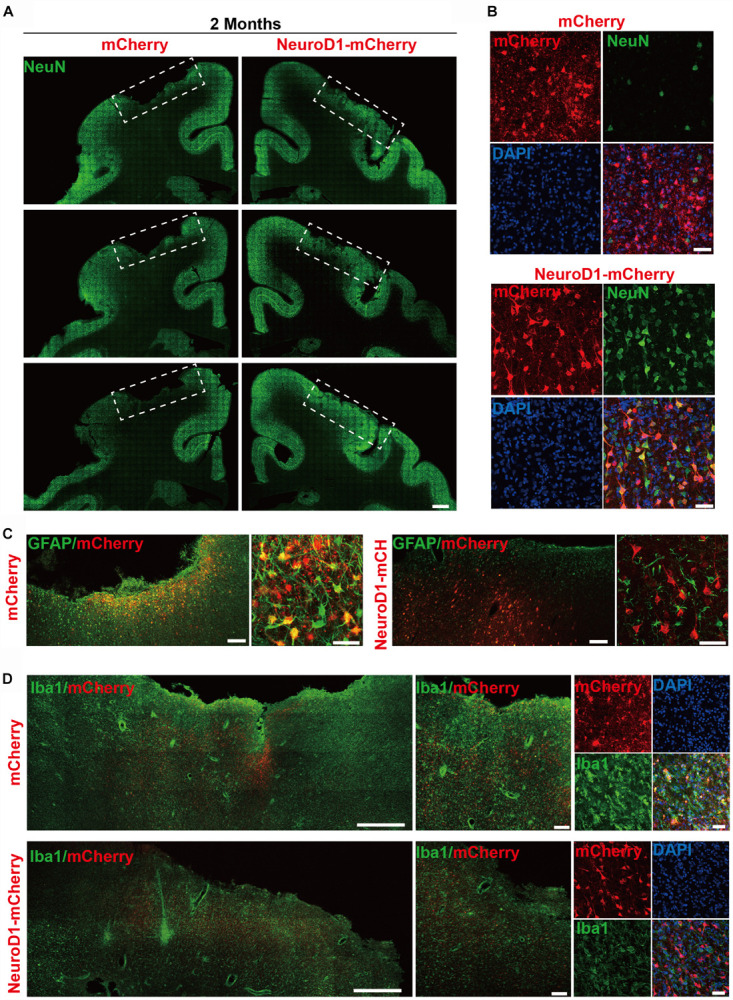
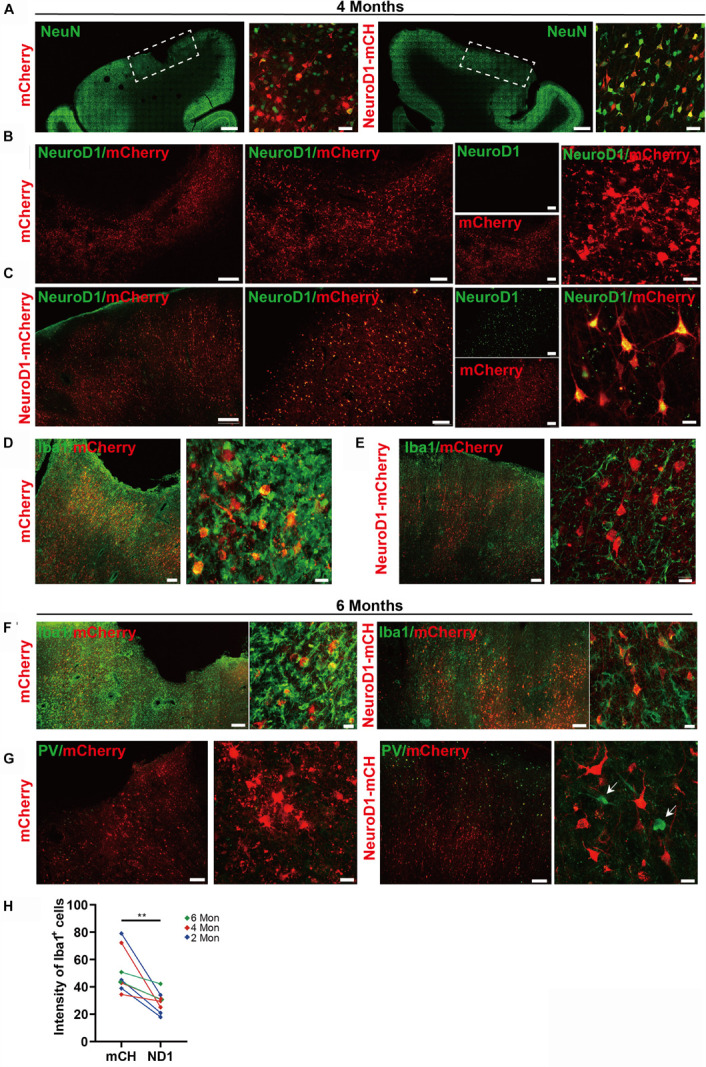
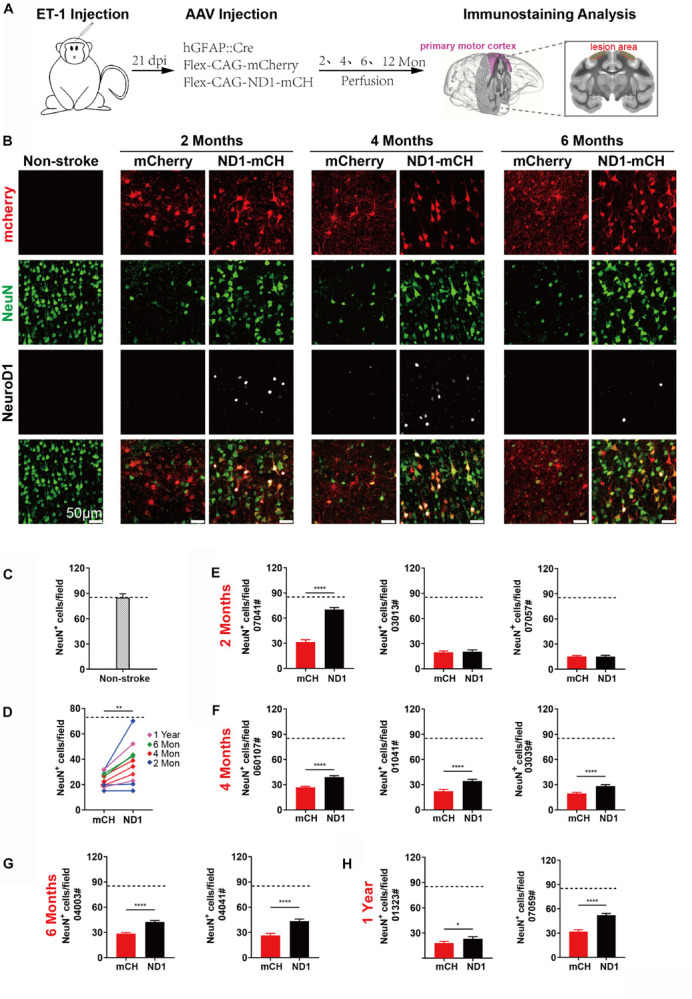
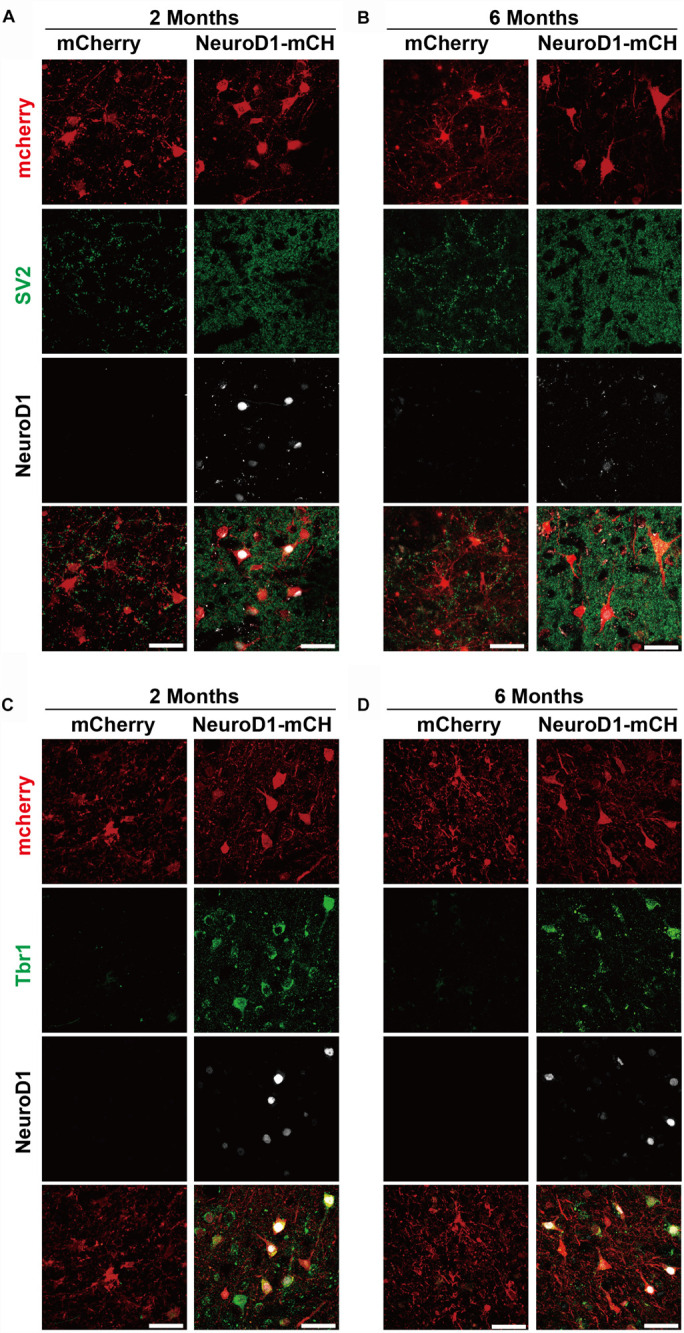
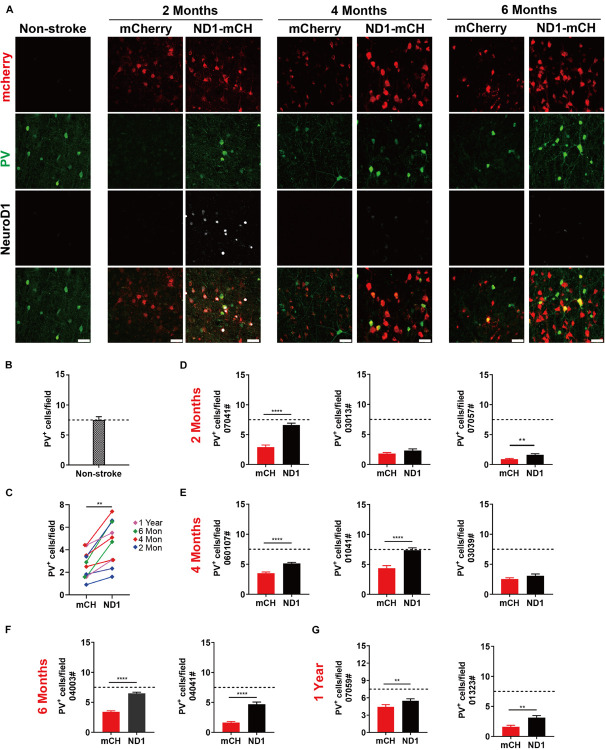
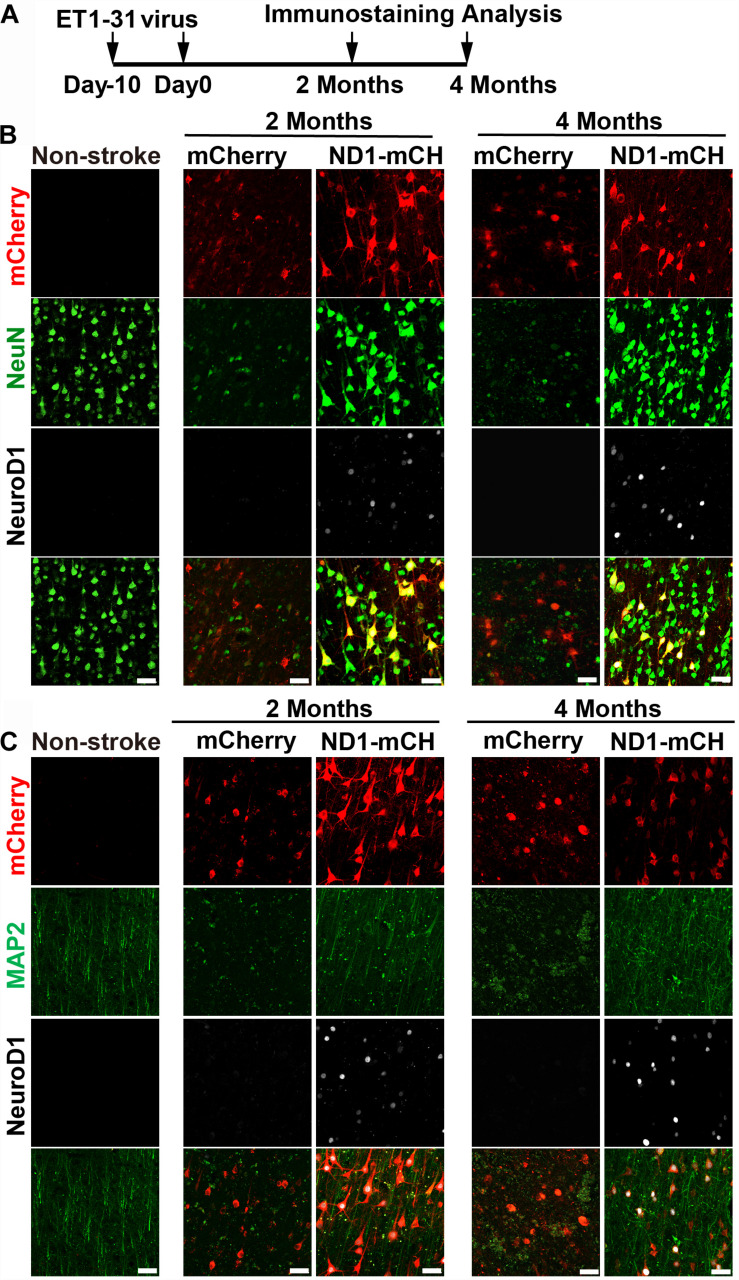
Stroke may cause severe death and disability but many clinical trials have failed in the past, partially because the lack of an effective method to regenerate new neurons after stroke. In this study, we report an in vivo neural regeneration approach through AAV NeuroD1-based gene therapy to repair damaged brains after ischemic stroke in adult non-human primates (NHPs). We demonstrate that ectopic expression of a neural transcription factor NeuroD1 in the reactive astrocytes after monkey cortical stroke can convert 90% of the infected astrocytes into neurons. Interestingly, astrocytes are not depleted in the NeuroD1-converted areas, consistent with the proliferative capability of astrocytes. Following ischemic stroke in monkey cortex, the NeuroD1-mediated astrocyte-to-neuron (AtN) conversion significantly increased local neuronal density, reduced microglia and macrophage, and surprisingly protected parvalbumin interneurons in the converted areas. Furthermore, the NeuroD1 gene therapy showed a broad time window in AtN conversion, from 10 to 30 days following ischemic stroke. The cortical astrocyte-converted neurons showed Tbr1+ cortical neuron identity, similar to our earlier findings in rodent animal models. Unexpectedly, NeuroD1 expression in converted neurons showed a significant decrease after 6 months of viral infection, indicating a downregulation of NeuroD1 after neuronal maturation in adult NHPs. These results suggest that in vivo cell conversion through NeuroD1-based gene therapy may be an effective approach to regenerate new neurons for tissue repair in adult primate brains.

Keywords: astrocyte; brain repair; cell conversion; in vivo reprogramming; ischemic stroke; neuron; neuroregeneration; non-human primate.


Figures

FIGURE 1
FIGURE 1
NeuroD1-mediated astrocytes-to-neuron conversion in the monkey cortex. (A) Injection of AAV9 viruses expressing GFP alone under human GFAP promoter (hGFAP::GFP) into monkey cerebral cortex infected astrocytes only with colocalization of astroglial marker GFAP (red) at 28 days post viral injection (dpi). These cells were negative for NeuroD1 staining. Scale bar, 20 μm. (B,C) Injection of AAV9 viruses expressing NeuroD1-GFP under human GFAP promoter (hGFAP::NeuroD1-P2A-GFP) converted astrocytes into neurons with colocalization of neuronal marker NeuN (B) and dendritic marker MAP2 (C). The converted neurons (28 dpi) were confirmed to express NeuroD1 (B) but lost GFAP signal (C). Scale bars, 20 μm. (D) Some hGFAP::NeuroD1-P2A-GFP infected cells (green) were immunopositive for both NeuN and GFAP, suggesting a transitional stage from astrocytes to neurons during the conversion process. Scale bar, 20 μm. (E,F) Cell counting analysis of NeuN+ or GFAP+ cells among viral infected cells. Data are presented as mean ± SEM. N = 30 random fields from triplicate sections in the control group; N = 40 random fields from triplicate sections in the ND1 group. n.d., not detected. Data presented as mean ± SEM. ****p < 0.0001 by Mann–Whitney test. (G) Bar graphs showing the different cell type compositions among all the NeuroD1-GFP infected cells. Data presented as mean ± SEM. N = 40 random fields from triplicate sections in the NeuroD1 side. n.d., not detected.
FIGURE 2
FIGURE 2
An engineered Cre-Flex system for high efficiency conversion in the monkey cortex. (A) Monkey cortex was injected with AAV9 hGFAP::GFP + GFAP::Cre together with either Flex-CAG::mCherry (control) or Flex-CAG::NeuroD1-mCherry and analyzed at 42 dpi. AAV9 GFAP::GFP was used to label local astrocytes in the cortex. (B) Representative images showing astrocytes (GFAP+) co-infected by the control viruses (AAV9 GFAP::GFP + GFAP::Cre + Flex-CAG::mCherry). Scar bars, 20 μm. (C,D) Representative images showing converted neurons (arrowhead, NeuN+) after infected by NeuroD1 viruses (AAV9 GFAP::GFP + GFAP::Cre + Flex-CAG::NeuroD1-mCherry) at 42 dpi. Note that GFAP::GFP-only infected cells were still astrocytes (D, green arrow). Scar bars, 20 μm. (E) Quantification of the neuronal conversion efficiency (NeuN+/GFP+mCherry+) among mCherry control (2.5 ± 2.5%) and NeuroD1-mCherry infected cells (94.4 ± 5.5%). The data are mean ± SEM. N = 9 regions from triplicate sections for each side. ****p < 0.0001 by Mann–Whitney test.
FIGURE 3
FIGURE 3
In vivo neuroregeneration and reduced inflammation after cell conversion in NHP ischemic stroke model. (A) Serial brain sections across the injury core illustrating the neuronal density (NeuN staining) in the monkey cortex following ischemic injury and viral injection. Note that both NeuN signal and cortical tissue were significantly impaired in the mCherry-injected side (left), but significantly rescued in the NeuroD1-mcherry injected side (right). Viral infection was conducted at 21 days post stroke (dps), and immunostaining analysis was performed at 2 months post viral injection (for all panels A–D). Scale bar, 2000 μm. (B) Representative high magnification images of neuronal density (NeuN, green) and viral infection (mCherry, red) in the monkey cortex. NeuroD1-mCherry infected areas always showed a significantly increased neuronal density. Nuclei were counterstained with DAPI (blue). Scale bar, 50 μm. (C) Both low and high magnification images illustrating the astrocytes (GFAP, green) infected by control virus mCherry alone (red, left panels), but rarely in the NeuroD1-mCherry infected areas (right panels). Note that while rarely co-localizing with NeuroD1-mCherry, GFAP+ astrocytes always persisted in the converted area and even showed less reactive morphology, indicating that astrocytes were not depleted after conversion. Scale bar, 200 μm (low mag), 20 μm (high mag). (D) Representative images in low and high magnification illustrate a reduction of microglia and macrophage (Iba1, green) in the NeuroD1-infected areas (bottom row) following ischemic stroke, comparing to the control side (top row). Nuclei are DAPI stained (blue). Scale bar, 1000 μm (low mag, left panels), 200 μm (higher mag, middle panels), 50 μm (highest mag, right panels).
FIGURE 4
FIGURE 4
Long-term effect of NeuroD1-treatment in NHP ischemic stroke model. (A) Representative images illustrating neuronal density (NeuN, green), cortical tissue integrity, and viral infected cell morphology at 4 months post viral injection (virus injected at 21 dps, for panels A–E). Scale bars, 2000 μm for low mag, 50 μm for high mag. (B,C) Identification of NeuroD1 (green) expression at low and high magnification among viral infected cells. As expected, NeroD1 signal (green) was only detected in the NeuroD1-mCherry infected side (C), but not the control side (B). Note that the NeuroD1-mCherry infected cells displayed clear neuronal morphology. Scale bar, 500 μm (low mag, left 4 panels), 200 μm (higher mag, middle 4 panels), 20 μm (highest mag, right 2 panels). (D,E) Representative images in low and high magnifications illustrating significant reduction of microglia and macrophage (IBA1, green) in the NeuroD1-infected areas (E), compared to the control mCherry infected areas (D). Scale bar, 200 μm (low mag, middle panels), 20 μm (high mag, right panels). (F) Representative images illustrating a reduction of microglia and macrophage (IBA1, green) in NeuroD1-infected areas (right panels), compared to the control mCherry infected areas (left panels). Virus injected at 21 dps, and immunostaining performed at 6 months post viral injection (for both panel F and G). Scale bar, 200 μm (low mag), 20 μm (high mag). (G) Representative images illustrating the protection of parvalbumin (PV) interneurons (green, arrow) in and surrounding the NeuroD1-infected areas (right panels), compared to the control mCherry-infected areas (left panels). Scale bar, 200 μm (low mag), 20 μm (high mag). (H) Quantitation of the Iba1 intensity in the NeuroD1 side compared to the control side among the 8 monkeys injected with virus at 21 days following ischemic injury. **p = 0.0078 by Wilcoxon matched-pairs signed rank test.
FIGURE 5
FIGURE 5
Increased neuronal density after NeuroD1-treatment. (A) Schematic illustration of our experimental design. (B) Representative images showing triple immunostaining of mCherry (red), NeuN (green) and NeuroD1 (white) in non-stroke cortex (left column) and the stroke cortex followed with viral injection (right 6 columns). NeuroD1-infected areas showed a consistent increase in the number of NeuN+ neurons (green) compared to the control side at 2, 4, and 6 months post viral infection. Note that NeuroD1 signal showed a significant decrease at 6 months compared to that at 2- and 4-months post viral infection. Scar bars, 50 μm. (C) Quantified data showing the mean number of NeuN+ cells in the motor cortex of non-stroke monkey. Data are represented as mean ± SEM. N = 30 random fields from triplicate slices. Each field = 0.1 mm2. (D) Quantitation of the neuronal density in the NeuroD1 side compared to the control side among the 10 monkeys injected with virus at 21 days following ischemic injury. **p = 0.0039 by Wilcoxon matched-pairs signed rank test. (E–H) Non-biased quantitative analyses on the neuronal density in the NeuroD1-treated versus control mCherry-treated cortex in each individual of the 10 monkeys. Viral infection was conducted at 21 days after ischemic injury, and immunostaining was performed at 2, 4, 6 months and 1-year post viral injection. Data are represented as mean ± SEM (n = 30–40 images per section, 6–8 sections per animal, total 180–240 fields/animal; Each field = 0.1 mm2). *p = 0.020, ****p < 0.0001 by Mann–Whitney test.
FIGURE 6
FIGURE 6
Cortical neuron identity for astrocyte-converted neurons in monkey cortex. (A–B) Representative images showing triple immunostaining of mCherry (red), SV2 (green) and NeuroD1 (white) in the NeuroD1-mCherry or mCherry-infected areas at 2- or 6-months post viral injection (21 days after stroke). Data shows significantly increased synaptic puncta (SV2) in the NeuroD1-infected areas, compared to the control mCherry-infected areas. Note a significant decrease of NeuroD1 expression at 6 months following viral infection. Scale bars, 50 μm. (C,D) Representative images showing triple immunostaining of mCherry (red), Tbr1 (green) and NeuroD1 (white) in the NeuroD1-mCherry or mCherry-infected areas at 2- or 6-months post viral injection (21 days after stroke). Most of the NeuroD1-expressing neurons were Tbr1+. Scar bars, 50 μm.
FIGURE 7
FIGURE 7
Protection of GABAergic neurons after astrocyte-to-neuron conversion. (A) Representative images showing triple immunostaining for mCherry (red), PV (green) and NeuroD1 (white) in non-stroke cortex (left column) and the NeuroD1-mCherry or mCherry-infected areas after stroke. Note a consistent increase of PV+ interneurons in NeuroD1-infected areas compared to the control mCherry-infected areas at 2, 4, and 6 months post viral infection (21 days after stroke). NeuroD1 expression decreased at 4 and 6 months after infection, but mCherry signal was still strong in the viral infected cells. Scar bars, 50 μm. (B) Quantified data showing the mean number of PV+ cells in the motor cortex of non-stroke monkey. Data are represented as mean ± SEM. N = 30 random fields from triplicate slices. Each field = 0.1 mm2. (C) Quantitation of the PV+ cell density in the NeuroD1-treated side compared with the control side among the 10 monkeys injected with virus at 21 days following ischemic injury. **p = 0.0020 by Wilcoxon matched-pairs signed rank test.(D–G) Quantitative analysis on the PV+ neuronal density in the NeuroD1-treated versus control mCherry-treated cortex in 10 monkeys. There were 6 out of 10 monkeys showed significant increase of PV+ neurons after NeuroD1-treatment. Viral injection at 21 days following ischemic injury, and immunostaining at 2, 4, 6 months and 1-year post viral injection. Data are represented as mean ± SEM (n = 180–240 fields/animal). **p < 0.01, ****p < 0.0001 by Mann–Whitney test.
FIGURE 8
FIGURE 8
Beneficial effects of NeuroD1-based gene therapy delivered at 10 days after ischemic stroke in monkey cortex. (A) Experimental design for NeuroD1 treatment at 10 days after ischemic stroke. (B) Representative images showing mCherry (red), NeuN (green) and NeuroD1 (white) expression pattern in non-stroke cortex (left column) or in ischemic cortex after virus infection (right 4 columns). NeuroD1-infected areas consistently showed higher neuronal density. Scar bars, 50 μm. (C) Representative images showing mCherry (red), MAP2 (green), and NeuroD1 (white) expression pattern in non-stroke cortex (left column) or in ischemic cortex after viral injection (right 4 columns). The neuronal dendritic marker MAP2 signal increased significantly in NeuroD1-infected areas, compared to the control mCherry-infected areas. Scar bars, 50 μm.

Comment in

References

    1. Ambasudhan R., Talantova M., Coleman R., Yuan X., Zhu S., Lipton S. A., et al. (2011). Direct reprogramming of adult human fibroblasts to functional neurons under defined conditions. Cell Stem Cell 9 113–118. 10.1016/j.stem.2011.07.002 - DOI - PMC - PubMed
    1. Avasarala J. (2015). Letter by Avasarala Regarding Article, “2015 AHA/ASA Focused Update of the 2013 Guidelines for the Early Management of Patients With Acute Ischemic Stroke Regarding Endovascular Treatment: a Guideline for Healthcare Professionals From the American Heart Association/American Stroke Association”. Stroke 46 E234–E234. - PubMed
    1. Benjamin E. J., Virani S. S., Callaway C. W., Chamberlain A. M., Chang A. R., Cheng S., et al. (2018). Heart Disease and Stroke Statistics-2018 Update: a report from the American Heart Association. Circulation 137 e67–e492. - PubMed
    1. Boltze J., Forschler A., Nitzsche B., Waldmin D., Hoffmann A., Boltze C. M., et al. (2008). Permanent middle cerebral artery occlusion in sheep: a novel large animal model of focal cerebral ischemia. J. Cereb. Blood Flow Metab. 28 1951–1964. 10.1038/jcbfm.2008.89 - DOI - PubMed
    1. Boltze J., Modo M. M., Mays R. W., Taguchi A., Jolkkonen J., Savitz S. I., et al. (2019). Stem cells as an emerging paradigm in stroke 4: advancing and accelerating preclinical research. Stroke 50 3299–3306. 10.1161/strokeaha.119.025436 - DOI - PubMed