

Disease duration in autosomal dominant familial Alzheimer disease: A survival analysis
- PMID: 33225064
- PMCID: PMC7673285
- DOI: 10.1212/NXG.0000000000000507
Disease duration in autosomal dominant familial Alzheimer disease: A survival analysis
Abstract
Objective: To use survival modeling to estimate disease duration in autosomal dominant familial Alzheimer disease (ADAD) and ascertain whether factors influencing age at onset also affect survival.
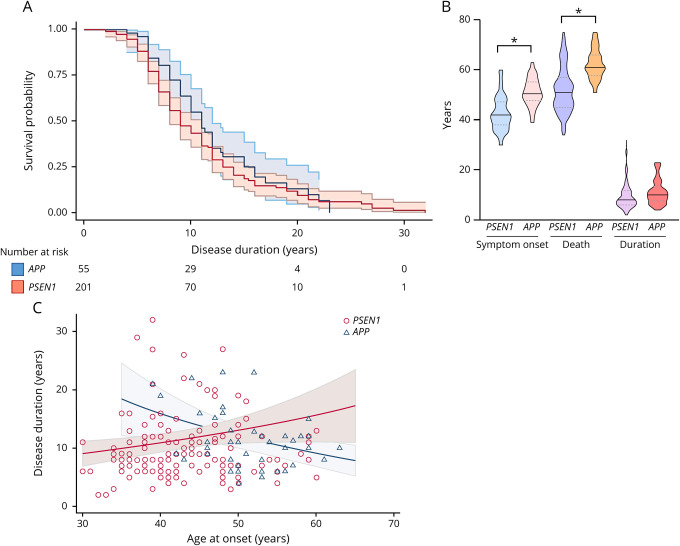
Methods: Symptomatic mutation carriers (201 presenilin 1 [PSEN1] and 55 amyloid precursor protein [APP]) from ADAD families referred to the Dementia Research Centre, between 1987 and 2019, were included. Survival was assessed with respect to age at onset, year of birth, APOE ε4 status, cognitive presentation, and sex using multilevel mixed-effects Weibull survival models. The contribution of mutation and family to variance in age at onset and duration was also assessed.
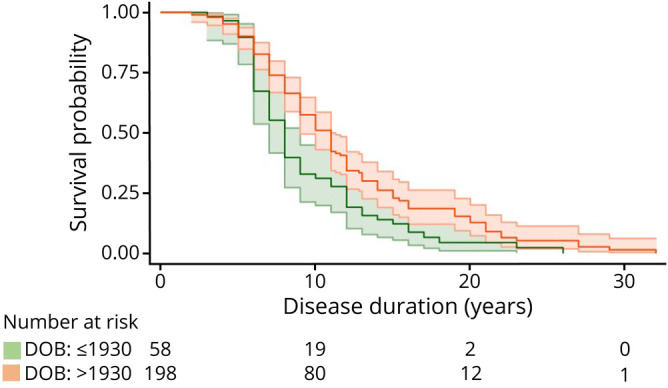
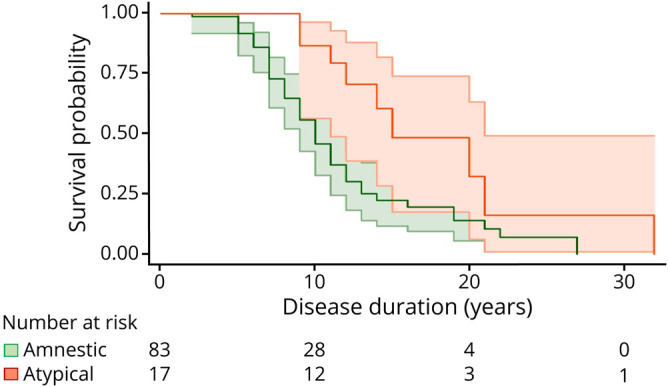
Results: Estimated mean survival was 11.6 (10.4-12.9) years and was similar for APP and PSEN1 mutations. Sixty-seven percent of the variance in age at onset was explained by mutation and 72% by mutation and family together. In contrast, only 6% of the variance in disease duration was explained by mutation specificity and 18% by family membership. Irrespective of gene, survival appeared longer for successive generations and in individuals with atypical presentations. Older age at onset was associated with longer duration within PSEN1 and shorter duration within APP mutation carriers. No differences in survival time were found between sexes or between mutations located before or beyond codon 200 within PSEN1.
Conclusions: Survival is influenced by mutation to a much lesser extent than age at onset. Survival time has increased over time and is longer in atypical presentations. These insights may inform the interpretation of disease-modifying therapy trials in ADAD.
Copyright © 2020 The Author(s). Published by Wolters Kluwer Health, Inc. on behalf of the American Academy of Neurology.
Figures
References
-
- Sherrington R, Rogaev EI, Liang Y, et al. . Cloning of a gene bearing missense mutations in early-onset familial Alzheimer's disease. Nature 1995;375:754–760. - PubMed
-
- Levy-Lahad E, Wasco W, Poorkaj P, et al. . Candidate gene for the chromosome 1 familial Alzheimer's disease locus. Science 1995;269:973–977. - PubMed
-
- Goate A, Chartier-Harlin MC, Mullan M, et al. . Segregation of a missense mutation in the amyloid precursor protein gene with familial Alzheimer's disease. Nature 1991;349:704–706. - PubMed
Grants and funding
LinkOut - more resources
Full Text Sources
Miscellaneous