. 2020;3(4):369-383.
doi: 10.1007/s42113-019-00068-5. Epub 2019 Dec 2.

Measures of Neural Similarity

Affiliations

Measures of Neural Similarity

S Bobadilla-Suarez et al. Comput Brain Behav. 2020.

Abstract

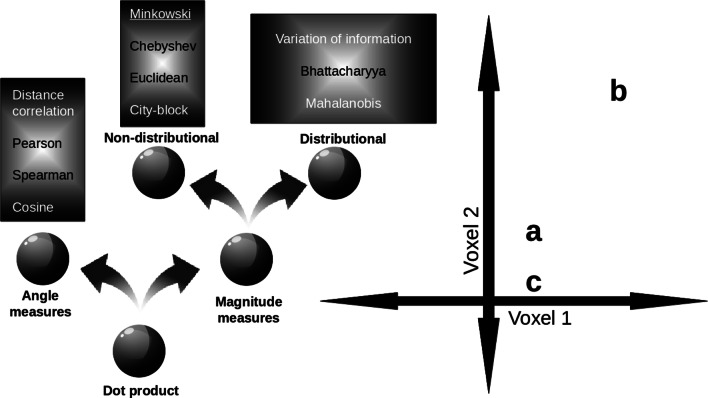
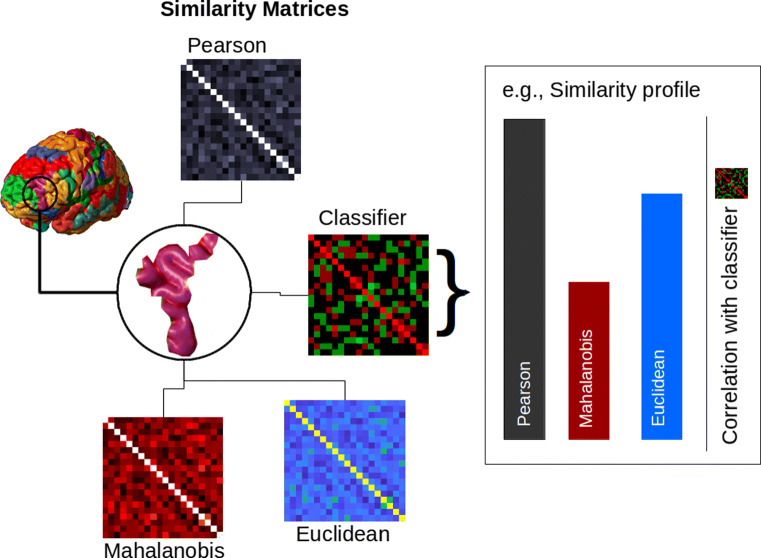
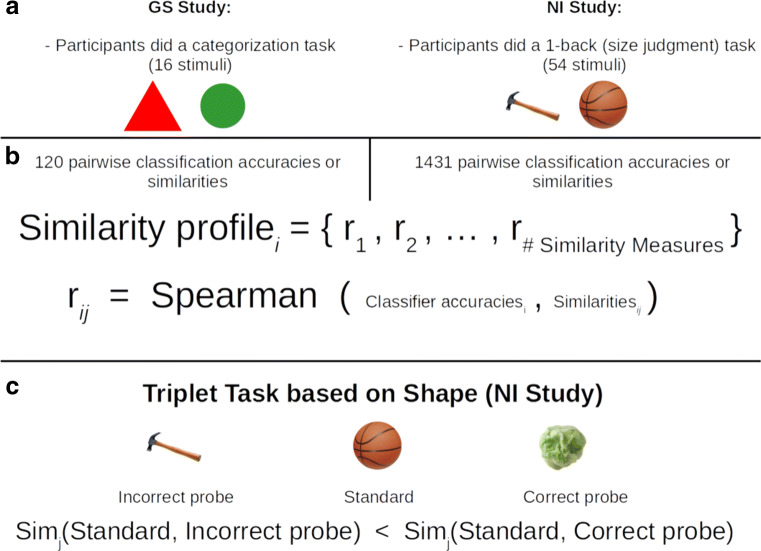
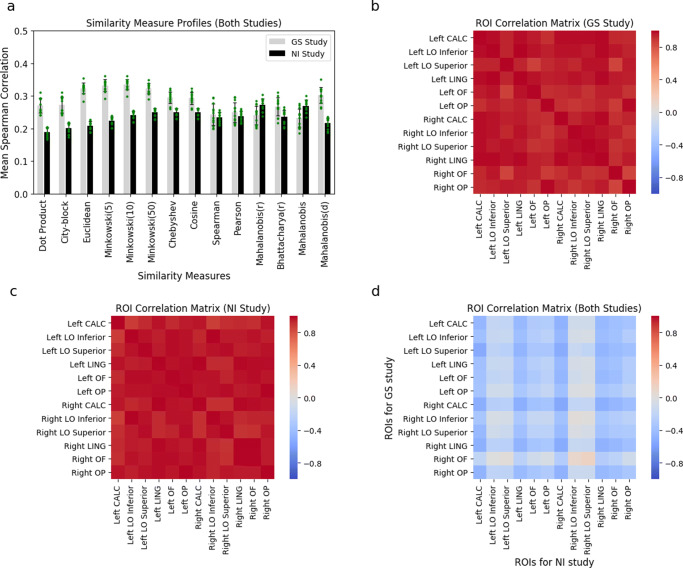
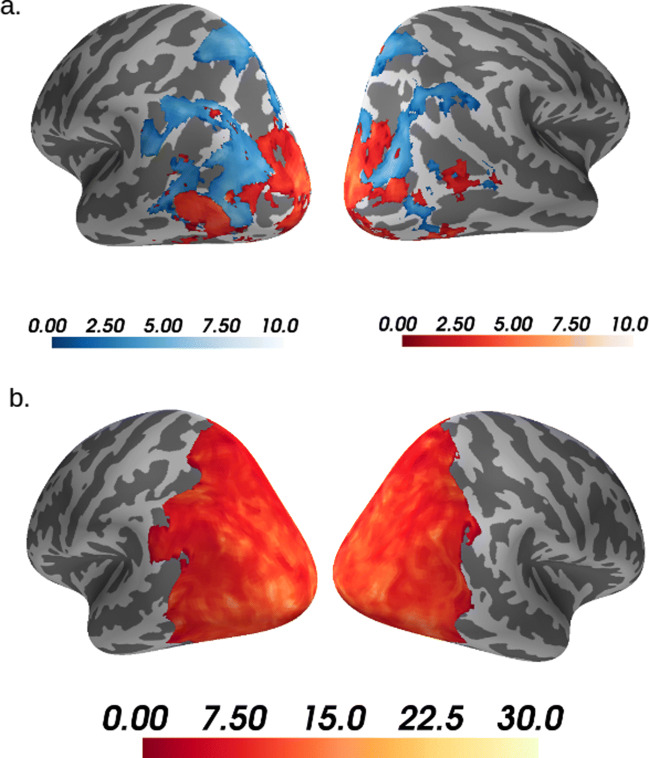
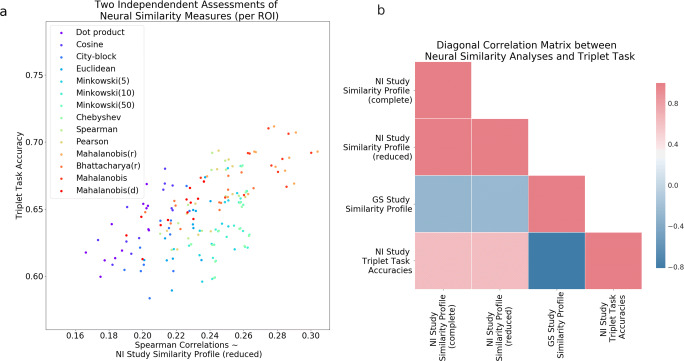
One fundamental question is what makes two brain states similar. For example, what makes the activity in visual cortex elicited from viewing a robin similar to a sparrow? One common assumption in fMRI analysis is that neural similarity is described by Pearson correlation. However, there are a host of other possibilities, including Minkowski and Mahalanobis measures, with each differing in its mathematical, theoretical, and neural computational assumptions. Moreover, the operable measures may vary across brain regions and tasks. Here, we evaluated which of several competing similarity measures best captured neural similarity. Our technique uses a decoding approach to assess the information present in a brain region, and the similarity measures that best correspond to the classifier's confusion matrix are preferred. Across two published fMRI datasets, we found the preferred neural similarity measures were common across brain regions but differed across tasks. Moreover, Pearson correlation was consistently surpassed by alternatives.

Keywords: Machine learning; Neural coding; Neural similarity; fMRI.


Conflict of interest statement

Conflict of InterestsThe authors declare no competing financial interests.

Figures

Fig. 1
Fig. 1
Families of similarity measures. (left panel) Similarity measures divide into those concerned with angle vs. magnitude differences between vectors. Pearson correlation and Euclidean distance are common angle and magnitude measures, respectively. The magnitude family further subdivides according to distributional assumptions. Measures like Mahalanobis are distributional in that they are sensitive to co-variance such that similarity falls more rapidly along low variance directions. (right panel) The choice of similarity measure can strongly affect inferences about neural representational spaces. In this example, stimuli a, b, and c elicit different patterns of activity across two voxels. When Pearson correlation is used, stimulus a is more similar to b than to c. However, when the Euclidean measure is used, the pattern reverses such that stimulus a is more similar to c than b
Fig. 2
Fig. 2
Evaluating the similarity profile for a ROI. The confusion matrix from a classifier is used to approximate the information present in the ROI. The similarity matrix from each similarity measure is correlated with this confusion matrix (i.e., the classifier matrix in the figure). The pattern of these correlations (i.e., the performance of the various similarity measures) is the similarity profile for that ROI. Similarity profiles can be compared between ROIs, both within and between datasets (see “Materials and Methods” section for more details)
Fig. 3
Fig. 3
An overview of the materials and basic analyses. a Participants engaged either in a categorization task for the GS study or in a 1-back task for the NI study. Importantly, the tasks in the original studies are independent of the analyses we perform, which are only concerned with the fMRI activations arising from the stimulus presentations. Examples of the stimuli used for each study are shown. b The neural similarity analysis involved comparing similarity profiles. The similarity profile for region i is a vector in which each entry j is the Spearman correlation between similarity measure j and the classification accuracies of each region i. Each Spearman correlation involves all possible stimulus pairs (excluding an item with itself). For the similarity measure, this includes the similarity of each item with every other item. For the classifier accuracy, the accuracies of the binary classifier for the corresponding two stimulus items are included. For the GS study with 16 stimuli, each Spearman correlation involved 16 × 15/2 = 120 similarity-classifier accuracy pairs. For the NI study with 54 stimuli, each Spearman correlation involved 54 × 53/2 = 1431 similarity-classifier accuracy pairs. c In the triplet analysis, the question is which of the two probe items is more neurally similar to the standard using neural similarity measure j. When the probe that matches the standard in shape is more similar, the trial is scored as correct. All possible triplets (under a few constraints, see SI) are considered for each ROI
Fig. 4
Fig. 4
Similarity measure profiles and ROI correlation matrices. Mean Spearman correlations (a) for each similarity measure and the classifier confusion matrix in the GS study (grey bars) and the NI study (black bars) are displayed. To convey the variability, error bars are plotted as standard deviations, and each ROI mean is plotted as a green point. ROI correlation matrices for the GS (b) and NI (c) studies, demonstrating that the similarity profiles were alike across brain regions (i.e., were positively Pearson correlated). ROI correlation matrix (d) demonstrating that the similarity profiles disagreed across studies (i.e, were negatively Pearson correlated). The 12 ROIs were left and right intracalcarine cortex (CALC), left and right lateral occipital cortex (LO) inferior and superior divisions, left and right lingual gyrus (LING), left and right occipital fusiform gyrus (OF), and left and right occipital pole (OP)
Fig. 5
Fig. 5
Euclidean and Mahalanobis(r) outperform Pearson. Occipito-lateral views of the left and right hemispheres for the GS study (a) and the NI study (b) displaying maximum t statistics where either the Euclidean measure (blue) or the Mahalanobis(r) measure (red) outperformed the Pearson correlation measure (i.e., each voxel displays the t statistic for the measure with highest t). The t statistics were based on a searchlight analysis of Spearman correlations of each measure with each voxel’s SVM confusion matrix (see “Materials and Methods”). Only displaying t statistics where p< 0.001 for paired sample t tests, TFCE corrected; computed with FSL’s randomize function with 5000 permutations, using as a mask the 12 ROIs with best accuracy (see “Materials and Methods”). Note that very few voxels only show the Euclidean measure significantly outperforming Pearson correlation in the NI study, thus do not appear in this visualization
Fig. 6
Fig. 6
Triplet analysis accuracies correlate with NI study similarity profiles. In a, each data point represents one similarity measure per region of interest. The Spearman correlations in a have been recalculated with the removal of held-out pairs used in the triplet analysis (where each pair is the standard and the correct probe), thus termed NI study similarity profile (reduced). In b, we Pearson correlate the similarity profiles from the neural similarity analysis with the accuracies derived from the triplet analysis as well as with each other. NI study similarity profile (complete) and GS study similarity profile are the same Spearman correlations as displayed in Fig. 4a

References

    1. Ahlheim C, Love BC. Estimating the functional dimensionality of neural representations. NeuroImage. 2018;179:51–62. - PMC - PubMed
    1. Allefeld C, Haynes JD. Searchlight-based multi-voxel pattern analysis of fMRI by cross-validated MANOVA. NeuroImage. 2014;89:345–357. - PubMed
    1. Aly M, Ranganath C, Yonelinas AP. Detecting changes in scenes: the hippocampus is critical for strength-based perception. Neuron. 2013;78(6):1127–1137. - PMC - PubMed
    1. Bartlett MS. The effect of standardization on a χ2 approximation in factor analysis. Biometrika. 1951;38(3/4):337–344.
    1. Bates D, Maechler M, Bolker B, Walker S. lme4: linear mixed-effects models using Eigen and S4. R package version. 2014;1(7):1–23.

LinkOut - more resources