. 2020 Aug 25;2(2):fcaa135.
doi: 10.1093/braincomms/fcaa135. eCollection 2020.

Neuronal megalin mediates synaptic plasticity-a novel mechanism underlying intellectual disabilities in megalin gene pathologies

Affiliations

Neuronal megalin mediates synaptic plasticity-a novel mechanism underlying intellectual disabilities in megalin gene pathologies

João R Gomes et al. Brain Commun. .

Abstract

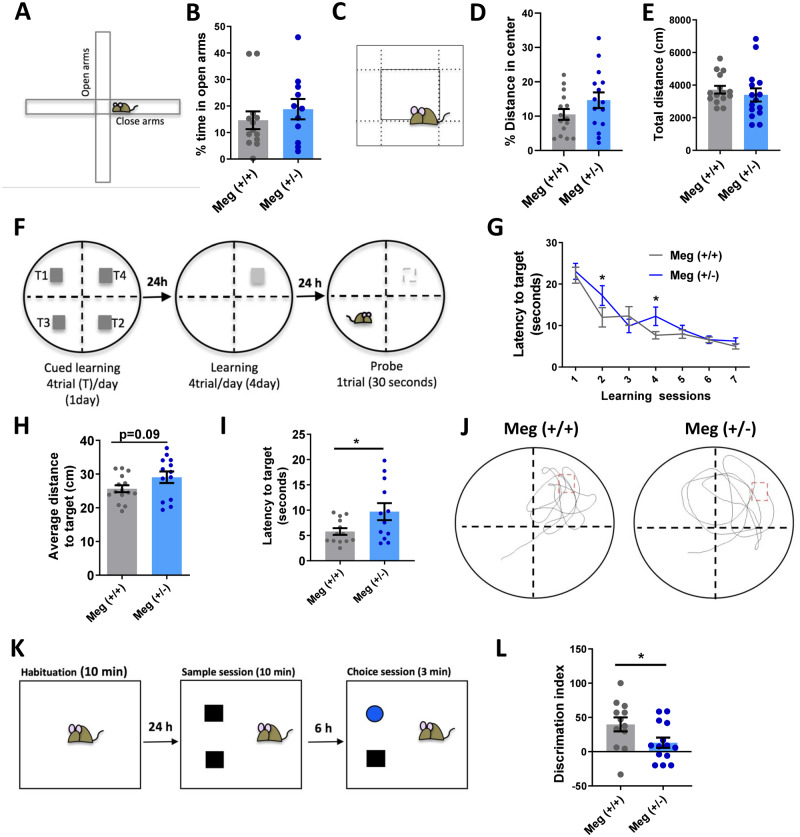
Donnai-Barrow syndrome, a genetic disorder associated to LRP2 (low-density lipoprotein receptor 2/megalin) mutations, is characterized by unexplained neurological symptoms and intellectual deficits. Megalin is a multifunctional endocytic clearance cell-surface receptor, mostly described in epithelial cells. This receptor is also expressed in the CNS, mainly in neurons, being involved in neurite outgrowth and neuroprotective mechanisms. Yet, the mechanisms involved in the regulation of megalin in the CNS are poorly understood. Using transthyretin knockout mice, a megalin ligand, we found that transthyretin positively regulates neuronal megalin levels in different CNS areas, particularly in the hippocampus. Transthyretin is even able to rescue megalin downregulation in transthyretin knockout hippocampal neuronal cultures, in a positive feedback mechanism via megalin. Importantly, transthyretin activates a regulated intracellular proteolysis mechanism of neuronal megalin, producing an intracellular domain, which is translocated to the nucleus, unveiling megalin C-terminal as a potential transcription factor, able to regulate gene expression. We unveil that neuronal megalin reduction affects physiological neuronal activity, leading to decreased neurite number, length and branching, and increasing neuronal susceptibility to a toxic insult. Finally, we unravel a new unexpected role of megalin in synaptic plasticity, by promoting the formation and maturation of dendritic spines, and contributing for the establishment of active synapses, both in in vitro and in vivo hippocampal neurons. Moreover, these structural and synaptic roles of megalin impact on learning and memory mechanisms, since megalin heterozygous mice show hippocampal-related memory and learning deficits in several behaviour tests. Altogether, we unveil a complete novel role of megalin in the physiological neuronal activity, mainly in synaptic plasticity with impact in learning and memory. Importantly, we contribute to disclose the molecular mechanisms underlying the cognitive and intellectual disabilities related to megalin gene pathologies.

Keywords: Donnai-Barrow syndrome; hippocampus; learning and memory; megalin; synaptic plasticity.


Figures

Graphical Abstract
Graphical Abstract
Figure 1
Figure 1
TTR regulates megalin levels: TTR KO versus WT mice. Total RNA was extracted from kidney (A, WT n = 12 mice: 9 males, 3 females; TTRKO n = 12 mice: 8 males, 4 females), choroid plexus (C, WT n = 5 male mice; TTRKO n = 7 mice: 5 males, 2 females), hippocampus (J, WT n = 7 mice: 6 males, 1 female; TTRKO n = 8: 5 males, 3 females) and spinal cord (L, WT n = 7 mice: 6 males, 1 female; TTRKO n = 8 mice: 5 males, 3 females) of WT and TTR KO mice, and megalin and GAPDH mRNA levels were semi-quantified by real-time PCR. Megalin mRNA levels are reduced in the kidney of TTR KO mice. Megalin protein levels were determined by western blot in the Kidney (B, WT n = 6 mice: 4 males, 2 females; TTRKO n = 6 mice: 3 males, 3 females), Choroid Plexus (D, WT n = 4 mice: 3 males, 1 female; TTRKO n = 6 mice: 1 male, 3 females), and in different brain regions of WT and TTR KO mice: Cerebral cortex (F, WT n = 7 mice: 6 males, 1 female; TTRKO n = 8 mice: 5 males, 3 females) Striatum (G, WT n = 6 mice: 5 males, 1 female; TTRKO n = 8 mice: 5 males, 3 females), Cerebellum (H, WT n = 13 mice: 12 males, 1 female; TTRKO n = 15 mice: 10 males, 5 females), Brainstem (I, WT n = 7 mice: 6 males, 1 female; TTRKO n = 8 mice: 5 males, 3 females), Hippocampus (K, WT n = 7 mice: 6 males, 1 female; TTRKO n = 8 mice: 5 males, 3 females) and spinal cord (M, WT n = 7 mice: 6 males, 1 female; TTRKO n = 8 mice: 5 males, 3 females). Megalin protein levels are reduced in the kidney, choroid plexus, hippocampus and spinal cord of TTR KO mice. Statistical analysis was performed using Student’s unpaired t-test. ***P < 0.001, *P < 0.05. (E) Representative images of immunofluorescence of choroid plexus from WT and TTR KO mice stained for TTR and megalin (three mice/genotype), showing a reduction of both TTR and megalin expression in TTR KO mice. Scale bar corresponds to 50 μm.
Figure 2
Figure 2
TTR rescues megalin downregulation in TTR KO hippocampal neuronal cultures, in a megalin-dependent way. (A) Total RNA was extracted from WT (n = 11) and TTR KO (n = 10) hippocampal neuronal cultures (7 DIV), and megalin and 18S mRNA levels were semi-quantified through real-time PCR, showing a reduction in megalin mRNA levels in hippocampal neurons of TTR KO mice. (B) Megalin and tubulin protein levels were determined by western blot in TTR KO (n = 6) and WT (n = 8) hippocampal neuronal cultures, with a decrease in megalin protein levels observed in TTR KO neurons. TTR KO cultured hippocampal neurons were stimulated with recombinant mouse TTR [55 µg/ml (1 µM)] for 4 h (mRNA) (C) or 14 h (protein) (D). When indicated, neurons were treated with TTR, in presence or absence of anti-TTR Nanobodies 169F7 and 165C6 (2 µM), or treated only with the nanobodies (C). TTR treatment rescued megalin mRNA (C, n = 5–7 independent cultures) and protein levels (D, n = 3 independent cultures) in TTR KO neurons, and the effect was abolished in the presence of the 169F7 nanobody, specific for TTR-megalin interaction epitope (C). Megalin (+/−) TTR KO and TTR KO cultured hippocampal neurons (7 DIV) were stimulated with recombinant mutated forms of mouse TTR, I84S (a TTR with low affinity for its ligands) and K15N (55 µg/ml, for 4 h; a TTR mutated in the 169F7 nanobody epitope, affecting TTR-megalin interaction), and megalin and 18S mRNA levels were assessed (E, n = 6–10 neuronal cultures). TTR-induced effect in increasing megalin levels is independent of TTR ligands but depends on TTR binding to megalin and on megalin levels. (F) WT hippocampal neuronal cultures were stimulated with recombinant mouse TTR (55 µg/ml, for 4 h) in the presence or absence of the inhibitor clathrin-mediated endocytosis Dynasore (80 μM) and megalin mRNA levels were assessed (n = 5 neuronal cultures). No effect was observed in the presence of the inhibitor, indicating that TTR-induced increase in megalin levels does not involve receptor internalization. (G) LRP1 and 18S mRNA levels were determined in TTR KO hippocampal neurons (n = 4 neuronal cultures), in the presence or absence of recombinant mouse TTR (55 µg/ml, for 4 h). LRP1 levels are not affected by TTR stimulation, indicating a specific effect for LRP2 (megalin). Statistical analysis was performed using Student’s unpaired t-test or one-way ANOVA followed by Bonferroni’s multiple comparison test. *P < 0.05, **P < 0.01, ***P < 0.001.
Figure 3
Figure 3
TTR leads to LRP2-ICD formation, probably via γ-secretase activity. (A) Cartoons describing mouse megalin and megalin plasmids, representing its structural differences and predicted molecular weights. (B) Representative images of TTR KO cultured hippocampal neurons 11 DIV transfected with either mini-megalin plasmid (pLNCX-M4) or with short-megalin fused with GFP (Short-megalin-GFP) for 48 h, stained with megalin and GFP antibodies, respectively, showing both plasmids with overlapping intracellular distribution. (C) Representative images of TTR KO cultured hippocampal neurons transfected with short-megalin-GFP for 48 h, and stimulated with recombinant mouse TTR in the presence or absence of specific-TTR nanobody 169F7. Quantification of GFP fluorescence intensity in neurites in the different experimental conditions is shown. TTR stimulation reduces the expression of megalin in neurites, and this effect is abolished in the presence of the nanobody. The results represent three independent neuronal cultures. (D) TTR KO neurons transfected with short-megalin-GFP were stimulated, or not, with recombinant mouse TTR (55 µg/ml) for 4 h. Western blot was performed, using an antibody for GFP. The LRP2-ICD immunoreactivity was quantified in Control and TTR exposed neurons, and show the increase in LRP2-ICD upon TTR stimulation. The results represent three independent neuronal cultures (E). (F) The same result was observed in WT cultured hippocampal neurons (15 DIV) stimulated, or not, with recombinant mouse TTR (55 µg/ml) for 5 min. Western blot was performed to assess megalin protein levels using an antibody for megalin. (G) Cartoon describing mouse megalin and megalin constructs being RIP processed, upon ligand (TTR) binding. Statistical analysis was performed using Student’s unpaired t-test. **P < 0.01.
Figure 4
Figure 4
TTR leads to LRP2-ICD nuclear translocation, as a putative transcription regulation mechanism. (A) Mouse megalin C-terminal with highlighted consensus sequences for NLS (nuclear-localizing signals), NES (nuclear-exporting signals), protein DNA-binding residues and metal-binding sites, predicted by different bioinformatics tools. (B) Representative images of TTR KO cultured hippocampal neurons (11 DIV) transfected with short-megalin-GFP, and stimulated, or not, with recombinant mouse TTR (55 µg/ml) for 5 min. (C) Quantification of GFP fluorescence intensity in the nucleus (DAPI co-localization) indicates the nuclear translocation of megalin. The results are the average ±SEM of three independent cultures (Control: 12 neurons, MsTTR = 13 neurons). Statistical analysis was performed using unpaired Student’s t-test. *P < 0.05. Symbol triangle represents the average of each culture, and circles represent each hippocampal neuron of each individual culture, each colour represents each group culture/neuron. (D, E) Nuclear and cytosolic fractions isolated from TTR KO cultured hippocampal neurons (11 DIV) transfected with mini-megalin plasmid (pLNCX-M4) for 48 h and stimulated with recombinant mouse TTR or K15N TTR (55 µg/ml) for 20 min, and analysed by western blot showing the nuclear translocation of megalin. The effect was blocked when neurons were treated with the TTR mutated form that targets the site for TTR–megalin interaction. Histone H2Ax (nuclear fraction) and GAPDH (cytosolic fraction) were used to confirm cytosolic and nuclear fraction separation. The results are representative of two independent neuronal cultures.
Figure 5
Figure 5
Reduction of megalin levels impairs neurite outgrowth and survival of hippocampal neurons. (A) Representative MAP2 staining of WT, TTR KO and Meg+/− cultured hippocampal neurons (1 DIV). (B) Neurite number and (C) total neurite length of hippocampal neurons were determined (WT, n = 5 cultures (507 neurons)); TTR KO, n = 9 cultures (613 neurons); Meg+/− TTR KO, n = 6 cultures (359 neurons); Meg+/−, n = 4 cultures (220 neurons), showing that decreased megalin expression reduces neurite number and length. (D, E) TTR KO and Meg+/− TTR KO cultured hippocampal neurons (7 DIV) were subjected to excitotoxic stimulation with glutamate. Neuronal survival was assessed 14 h after the excitotoxic insult through nuclear condensation (n = 3–6 independent cultures), demonstrating that megalin deficiency reduces neuronal survival of hippocampal neurons in physiological and toxic conditions. (F) Time course of normalized FRET/Donor values in the cell body of YC-Nano15 transfected TTR KO or Meg+/− TTR KO cultured hippocampal neurons (7 DIV) under physiologic conditions, or in absence of extracellular calcium (extended results from (Gomes et al., 2016)) (TTR KO, n = 3 cultures (16 neurons), Meg+/− TTR KO, n = 3 cultures (15 neurons)); TTR KO w/out Ca2+, n = 2 cultures (12 neurons) indicating that megalin seems to be required for physiological neuronal activity. (G) Pictorial figure summarizing the association between megalin expression levels and hippocampal neuronal viability. Statistical analysis was performed using one-way ANOVA followed by Bonferroni’s multiple comparison test (D), and a linear mixed model followed by Tukey–Kramer multiple comparison test (B, C, F). *P < 0.05, **P < 0.01, ****P < 0.0001. Symbol triangle represents the average of each culture, and circles represent each hippocampal neuron of each individual culture, each colour represents each group culture/neuron.
Figure 6
Figure 6
Megalin overexpression rescues neurite outgrowth and increases dendritic spine density. (A) WT cultured hippocampal neurons (11 DIV) were transfected with a functional mini-megalin plasmid (pLNCX-M4) for 48/72 h. Megalin protein levels in transfected and untransfected neurons were assessed by western blot (A) and immunocytochemistry. (B–H) TTR KO cultured hippocampal neurons (11 DIV) were transfected with either GFP plasmid (pEGFP) or co-transfected with GFP (pEGFP) and mini-megalin plasmid (pLNCX-M4) for 48 h, and stimulated, or not, as indicated, with recombinant mouse TTR (55 µg/ml) for 24 h. An immunocytochemistry was performed using GFP antibody. (B) Representative images of neurons expressing GFP. (C) Total neurite length, (D) neurite number [GFP Ct, n = 5 (21–23 neurons); GFP TTR, n = 5 (19–20 neurons); pLNCX_M4+GFP Ct, n = 6 (23 neurons); pLNCX_M4+GFP TTR, n = 4/5 (17 neurons)] and (E–G) branching were increased when megalin is overexpressed and or neurons are treated with TTR. (GFP Ct, n = 7 (22 neurons); GFP TTR, n = 5 (22 neurons); Meg Ct, n = 6 (23 neurons); Meg TTR, n = 5 (19 neurons). (H) Dendritic spine density is increased in neurons overexpressing megalin (n = 1 culture, 13–14 dendrites from 8 to 10 neurons. (I) Pictorial figure summarizes the effects in neurite outgrowth triggered by overexpression of megalin versus TTR stimulation. Scale bar in A corresponds to 20 μm and in B to 50 μm. Statistical analysis was performed using linear mixed model followed by Tukey–Kramer multiple comparison test (C–G). *P < 0.05, **P < 0.01. Symbol triangle represents the average of each culture, and circles represent each hippocampal neuron of each individual culture, each colour represents each group culture/neuron.
Figure 7
Figure 7
Megalin heterozygous mice show structural alterations in hippocampal neurons. (A) Schematic representation of mice intravenously injected with AAV.PHP.eB_GFP with representative images of the hippocampus (Scale bar: 100 µm), and high-magnification images of CA1 and DG neurons (Scale bar: 50 µm). Neurite number (B, F), total neurite length (C, G) and branching (Sholl) (D, H) analysis in neurons from CA1 and DG regions of the hippocampus, respectively, show a decrease in neuronal complexity in Meg+/− mice, compared to WT littermates [CA1 neurons: Meg+/+  n = 3 mice (2 females, 1 male), 18 neurons; Meg+/−  n = 3 mice (2 females, 1 male), 15 neurons; DG neurons: Meg+/+  n = 3 mice (2 females, 1 male) 26 neurons; Meg+/−  n = 3 mice (2 females, 1 male), 26 neurons]. Schematic representations of CA1 (E) and DG (I) neurons are shown. (L) Representative images from secondary dendrites of CA1 pyramidal neurons from Meg+/− and WT littermates [Meg+/+  n = 3 mice (2 females, 1 male) 13 neurons, 37 dendrites; Meg+/−  n = 3 mice (2 females, 1 male), 15 neurons, 37 dendrites] (J). The values are represented by 10 µm of dendritic length. Scale bar: 1 µm. (J–M) The density of dendritic spines in secondary branches of hippocampal CA1 neurons of Meg+/− was reduced, when compared to WT littermates (K). This effect was observed only in mature spines, whereas immatures spines were not affected (L, M, and schematic representation bellow graphics). Levels of VGLUT1 are decreased in whole tissue hippocampal extracts in Meg+/− mice (N), and PSD95 levels show a statistical tendency to decrease (P = 0.08) (O), as determined by western blot analysis. Meg+/+  n = 8 mice (4 females, 4 males), Meg+/−  n = 8 mice (4 females, 4 males). (P, Q) The number of excitatory synapses, defined by the co-localization of VGLUT1 and PSD95 puncta, is decreased in Meg+/− mice. Meg+/+  n = 7 mice (4 females, 3 males), 42 hippocampal segments; Meg+/−  n = 8 mice (4 females, 4 males), 45 hippocampal segments. Values are normalized to Meg+/+ mice. Representative images are shown in R. Scale bar: 5 µm. Statistical analysis was performed using Student’s unpaired t-test (N, O) or linear mixed model followed by Tukey–Kramer multiple comparison test. *P < 0.05, **P < 0.01, ***P < 0.001. Symbol triangle represents the average of each mice, and circles represent each hippocampal neuron/region of each mice, each colour represents each group mice/neuron or hippocampal region.
Figure 8
Figure 8
Megalin heterozygous mice show cognitive deficits, but no effects in anxiety-like behaviour or locomotor activity. (A) Schematic representation of the EPM test. (B) Anxiety-like behaviour was not altered in Meg+/− mice, compared to WT littermates, as shown by the % of time spent in open arms in EPM test. Meg+/+= 13 mice (4 females, 9 males), Meg+/− = 11 mice (7 females, 4 males). (C) Schematic design of the open field test. (D, E) Open field reinforces the absence of effects in anxiety in Meg+/− mice compared to Meg+/+ mice (% of distance in centre-D), and demonstrates no impairment in locomotor activity in Meg+/− (total distance travelled-E). Meg+/+  n = 15 mice (7 females, 8 males), Meg+/−  n = 15 mice (8 females, 7 males). (F) Schematic diagram of MWM. (G) Meg+/− mice display increased latency to reach the platform during training sessions 2 and 4. (H, I) During trial session, Meg+/− mice show a tendency for an increased average distance travelled (H) and a higher latency to reach the platform (I). (J) Representative tracing of probe trials of Meg+/− and WT littermates. Meg+/+  n = 15 mice (6 females, 9 males); Meg+/−  n = 13 mice (8 females, 5 males). (K) Schematic representation of Novel Object Recognition test. (L) Meg+/− mice display a reduction of the DI of the novel object versus the familiar object, compared to WT littermates. (M) No differences were observed for the objects total exploration time between genotypes. (N) Representative tracing of choice session of Meg+/− and WT littermates. Meg+/+  n = 12 mice (7 females, 5 males), Meg+/−  n = 14 mice (7 females, 7 males). Statistical analysis was performed using Student’s t-test, except in G, where two-way ANOVA was used. *P < 0.05.

Similar articles

Cited by

References

    1. Almeida MR, Damas AM, Lans MC, Brouwer A, Saraiva MJ. Thyroxine binding to transthyretin Met 119. Comparative studies of different heterozygotic carriers and structural analysis. Endocrine 1997; 6: 309–15. - PubMed
    1. Almeida RD, Manadas BJ, Melo CV, Gomes JR, Mendes CS, Graos MM, et al. Neuroprotection by BDNF against glutamate-induced apoptotic cell death is mediated by ERK and PI3-kinase pathways. Cell Death Differ 2005; 12: 1329–43. - PubMed
    1. Alvarez-Castelao B, Schuman EM. The regulation of synaptic protein turnover. J Biol Chem 2015; 290: 28623–30. - PMC - PubMed
    1. Alvira-Botero X, Perez-Gonzalez R, Spuch C, Vargas T, Antequera D, Garzon M, et al. Megalin interacts with APP and the intracellular adapter protein FE65 in neurons. Mol Cell Neurosci 2010; 45: 306–15. - PubMed
    1. Ambjorn M, Asmussen JW, Lindstam M, Gotfryd K, Jacobsen C, Kiselyov VV, et al. Metallothionein and a peptide modeled after metallothionein, EmtinB, induce neuronal differentiation and survival through binding to receptors of the low-density lipoprotein receptor family. J Neurochem 2008; 104: 21–37. - PubMed

LinkOut - more resources