Male castration increases adiposity via small intestinal microbial alterations
- PMID: 33225575
- PMCID: PMC7788444
- DOI: 10.15252/embr.202050663
Male castration increases adiposity via small intestinal microbial alterations
Abstract
Castration of young males is widely used in the cattle industry to improve meat quality, but the mechanism linking hypogonadism and host metabolism is not clear. Here, we use metataxonomic and metabolomic approaches to evaluate the intestinal microbiota and host metabolism in male, castrated male (CtM), and female cattle. After pubescence, the CtM cattle harbor distinct ileal microbiota dominated by the family Peptostreptococcaceae and exhibit distinct serum and muscle amino acid profiles (i.e., highly abundant branched-chain amino acids), with increased extra- and intramuscular fat storage. We also evaluate the causative factor(s) that underpin the alteration of the intestinal microbiota and host metabolic phenotype in response to hypogonadism. Castration of male mice phenocopies both the intestinal microbial alterations and obese-prone metabolism observed in cattle. Antibiotic treatment and fecal microbiota transplantation experiments in a mouse model confirm that the intestinal microbial alterations associated with hypogonadism are a key contributor to the obese phenotype in the CtM animals. Collectively, targeting the gut microbiota is a potential therapeutic strategy for the treatment of both hypogonadism and obesity.
Keywords: Peptostreptococcaceae; branched-chain amino acids; hypogonadism; ileal microbiota; intramuscular fat.
© 2020 The Authors.
Conflict of interest statement
The authors declare that they have no conflict of interest.
Figures

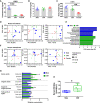
- A–C
Determination of the body weight (A), and serum testosterone (B) and 17β‐estradiol (C) levels, in post‐pubescent male, castrated male (CtM), and female Hanwoo (n = 5 in each group).
- D
PCoA of the rectal bacterial 16S rRNA gene sequences based on the weighted UniFrac distance matrix.
- E
Discriminant taxa of the male and CtM rectal microbiota, as determined by the linear discriminant analysis effect size (LEfSe). The different abundances are represented by LDA scores.
- F
The serum metabolome profiles were analyzed using GC‐TOF‐MS and clustered by PCoA based on the Bray–Curtis dissimilarity matrix.
- G
The relative abundances of serum metabolites displayed as bar graphs (n = 5 in each group).
- H
The BCAA serum levels quantified enzymatically, as described in the Materials and Methods section.

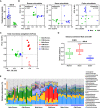
- A
Serum testosterone levels in the adult male and CtM Hanwoo (n = 10 in each group). The scattered dots in the bar graph represent the individual replicates.
- B, C
PCoA, based on the weighted UniFrac distance matrix, of the bacterial 16S rRNA gene sequence data for the rumen, ileum, and colon, shown for the different segments of the gastrointestinal tract (B) and combined data (C).
- D
Microbial dissimilarity (calculated based on the weighted UniFrac distance matrix, 100 values in each group) between the male and CtM groups in the different intestinal compartments. The lines, boxes, and whiskers in the box plot diagrams represent the median, first, and third quartiles, and min‐to‐max distribution of replicate values, respectively.
- E
The relative abundances of abundant bacterial taxa (> 0.5% of the mean abundance).

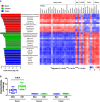
- A
The discriminant microbial taxa of the ileum, cecum, and colon of ten adult CtM Hanwoo are shown, determined to the genus level by the linear discriminant analysis (LDA) effect size (LEfSe) method. The LDA scores represent the degree of consistent difference in the relative abundance between groups. For orphan sequences (i.e., unassigned at the genus level), a high‐rank lineage is provided (f, family; o, order).
- B
The intestinal branched‐chain amino acid (BCAA) levels in the adult male and CtM Hanwoo (n = 10 in each group). BCAA levels in the luminal contents of the ileum, cecum, and colon were quantified by an enzymatic method using a BCAA assay kit. The lines, boxes, and whiskers in the box plot diagrams represent the median, first, and third quartiles, and min‐to‐max distribution of replicate values, respectively. The scattered dots in the box plot diagrams represent the individual replicates.

- A
Representative images of dressed bodies of the adult male and CtM Hanwoo (n = 10 in each group).
- B
Dressed body weight, thickness of the dorsal subcutaneous fat, total weight of the extramuscular fat (posterior subcutaneous fat, mesenteric fat, and retroperitoneal fat), and serum levels of the branched‐chain amino acids (BCAAs).
- C
Representative images of fresh striploin muscle from the adult male and CtM carcasses (n = 5 in each group).
- D
The intramuscular fat area in size‐normalized muscle.
- E
The intramuscular metabolome profiles analyzed using GC‐TOF‐MS and clustered by PCoA based on the Bray–Curtis dissimilarity matrix
- F, G
The relative abundances of intramuscular metabolites (F) and β‐hydroxybutyrate (3‐HB) (G) in the male and CtM samples.
- H
The serum and muscle ketone body levels, quantified enzymatically, as described in the Materials and Methods section (n = 10 in each group).

- A
Schematic design of the hypogonadism experiments in the mouse model (n = 6 in each group).
- B
Serum testosterone levels.
- C
PCoA, based on the weighted UniFrac distance matrix, of the bacterial 16S rRNA gene sequence data for the luminal contents of the ileum and colon, shown according to the different diets and antibiotic treatment.
- D
The relative abundances of the family Peptostreptococcaceae are displayed as a box and dot plots.
- E
The serum branched‐chain amino acid (BCAA) levels quantified enzymatically, as described in the Materials and Methods section.
- F
The total weight of the extramuscular fat, including posterior subcutaneous fat, mesenteric fat, and retroperitoneal fat.
- G, H
Representative images (G) and weight (H) of the hindlimb intermuscular fat. The images are from a longitudinal section of the hind leg. The fat weight data are presented as a percentage of the body weight.
- I
Serum and hindlimb muscle ketone body levels quantified enzymatically.

- A
Schematic design for the mouse FMT experiments (n = 4–5 in each group).
- B
The serum testosterone levels in the Sham‐R and castrated male (CtM)‐R mice.
- C
PCoA, based on the weighted UniFrac distance matrix, of the bacterial 16S rRNA gene sequence data for the luminal contents of the ileum and colon.
- D
The discriminant microbial taxa were determined by using the LEfSe and presented using the LDA score.
- E
The relative abundances of the family Peptostreptococcaceae are displayed as a box and dot plots.
- F
Weights of the posterior subcutaneous fat, epididymal fat, mesenteric fat, and retroperitoneal fat in the Sham‐R and CtM‐R mice.
- G, H
Representative images (G) and weight (H) of the hindlimb intermuscular fat in the Sham‐R and CtM‐R mice. Images were obtained from a longitudinal section of the hind leg. The fat weight data are presented as a percentage of the body weight.
- I
Serum and hindlimb muscle ketone body levels, quantified enzymatically.

- A
Schematic design of the chronic BCAA feeding experiments (n = 6 in each group).
- B
Body weight gain in response to the different levels of dietary BCAAs.
- C
Representative images of gross anatomy.
- D
The total weight of the extramuscular fat (posterior subcutaneous fat, epididymal fat, mesenteric fat, and retroperitoneal fat) in the mice fed high‐fat diet (HFD) with or without BCAAs.
- E
The serum BCAA levels in the mice fed HFD with or without BCAAs.
- F
PCoA, based on the weighted UniFrac distance matrix, of the bacterial 16S rRNA gene sequence data for the luminal contents of the ileum and colon are shown. The body weight gain data are presented as a percentage of the initial body weight. The fat weight data are presented as a percentage of the body weight.
- G
Serum and hindlimb muscle ketone body levels, quantified enzymatically.

Similar articles
-
Genetic hypogonadal mouse model reveals niche-specific influence of reproductive axis and sex on intestinal microbial communities.Biol Sex Differ. 2023 Nov 6;14(1):79. doi: 10.1186/s13293-023-00564-1. Biol Sex Differ. 2023. PMID: 37932822 Free PMC article.
-
Decreased microbial co-occurrence network stability and SCFA receptor level correlates with obesity in African-origin women.Sci Rep. 2018 Nov 20;8(1):17135. doi: 10.1038/s41598-018-35230-9. Sci Rep. 2018. PMID: 30459320 Free PMC article.
-
Bile acid is a significant host factor shaping the gut microbiome of diet-induced obese mice.BMC Biol. 2017 Dec 14;15(1):120. doi: 10.1186/s12915-017-0462-7. BMC Biol. 2017. PMID: 29241453 Free PMC article.
-
The microbiota-gut-brain axis in obesity.Lancet Gastroenterol Hepatol. 2017 Oct;2(10):747-756. doi: 10.1016/S2468-1253(17)30147-4. Epub 2017 Aug 24. Lancet Gastroenterol Hepatol. 2017. PMID: 28844808 Review.
-
[Physiological patterns of intestinal microbiota. The role of dysbacteriosis in obesity, insulin resistance, diabetes and metabolic syndrome].Orv Hetil. 2016 Jan 3;157(1):13-22. doi: 10.1556/650.2015.30296. Orv Hetil. 2016. PMID: 26708682 Review. Hungarian.
Cited by
-
Flaxseed Oil and Heated Flaxseed Supplements Have Different Effects on Lipid Deposition and Ileal Microbiota in Albas Cashmere Goats.Animals (Basel). 2021 Mar 12;11(3):790. doi: 10.3390/ani11030790. Animals (Basel). 2021. PMID: 33809169 Free PMC article.
-
Gut microbiota and meat quality.Front Microbiol. 2022 Aug 23;13:951726. doi: 10.3389/fmicb.2022.951726. eCollection 2022. Front Microbiol. 2022. PMID: 36081790 Free PMC article. Review.
-
The germline coordinates mitokine signaling.Cell. 2024 Aug 22;187(17):4605-4620.e17. doi: 10.1016/j.cell.2024.06.010. Epub 2024 Jul 2. Cell. 2024. PMID: 38959891 Free PMC article.
-
Breed-specific differences of gut microbiota and metabolomic insights into fat deposition and meat quality in Chinese Songliao Black Pig and Large White × Landrace Pig Breeds.BMC Microbiol. 2025 May 28;25(1):334. doi: 10.1186/s12866-025-04051-y. BMC Microbiol. 2025. PMID: 40426050 Free PMC article.
-
Omics in gut microbiome analysis.J Microbiol. 2021 Mar;59(3):292-297. doi: 10.1007/s12275-021-1004-0. Epub 2021 Feb 23. J Microbiol. 2021. PMID: 33624266 Review.
References
-
- Abdoun K, Stumpff F, Martens H (2006) Ammonia and urea transport across the rumen epithelium: a review. Anim Health Res Rev 7: 43–59 - PubMed
-
- Batt RA, Everard DM, Gillies G, Wilkinson M, Wilson CA, Yeo TA (1982) Investigation into the hypogonadism of the obese mouse (genotype ob/ob). J Reprod Fertil 64: 363–371 - PubMed
-
- Birzniece V (2018) Hepatic actions of androgens in the regulation of metabolism. Curr Opin Endocrinol Diabetes Obes 25: 201–208 - PubMed
-
- Bojesen A, Kristensen K, Birkebaek NH, Fedder J, Mosekilde L, Bennett P, Laurberg P, Frystyk J, Flyvbjerg A, Christiansen JS et al (2006) The metabolic syndrome is frequent in Klinefelter's syndrome and is associated with abdominal obesity and hypogonadism. Diabetes Care 29: 1591–1598 - PubMed
Publication types
MeSH terms
LinkOut - more resources
Full Text Sources

