

PIDDosome-induced p53-dependent ploidy restriction facilitates hepatocarcinogenesis
- PMID: 33225610
- PMCID: PMC7726793
- DOI: 10.15252/embr.202050893
PIDDosome-induced p53-dependent ploidy restriction facilitates hepatocarcinogenesis
Abstract
Polyploidization frequently precedes tumorigenesis but also occurs during normal development in several tissues. Hepatocyte ploidy is controlled by the PIDDosome during development and regeneration. This multi-protein complex is activated by supernumerary centrosomes to induce p53 and restrict proliferation of polyploid cells, otherwise prone for chromosomal instability. PIDDosome deficiency in the liver results in drastically increased polyploidy. To investigate PIDDosome-induced p53-activation in the pathogenesis of liver cancer, we chemically induced hepatocellular carcinoma (HCC) in mice. Strikingly, PIDDosome deficiency reduced tumor number and burden, despite the inability to activate p53 in polyploid cells. Liver tumors arise primarily from cells with low ploidy, indicating an intrinsic pro-tumorigenic effect of PIDDosome-mediated ploidy restriction. These data suggest that hyperpolyploidization caused by PIDDosome deficiency protects from HCC. Moreover, high tumor cell density, as a surrogate marker of low ploidy, predicts poor survival of HCC patients receiving liver transplantation. Together, we show that the PIDDosome is a potential therapeutic target to manipulate hepatocyte polyploidization for HCC prevention and that tumor cell density may serve as a novel prognostic marker for recurrence-free survival in HCC patients.
Keywords: PIDD1; caspase-2; hepatocellular carcinoma; p53; polyploidy.
© 2020 The Authors. Published under the terms of the CC BY 4.0 license.
Conflict of interest statement
The authors declare that they have no conflict of interest.
Figures
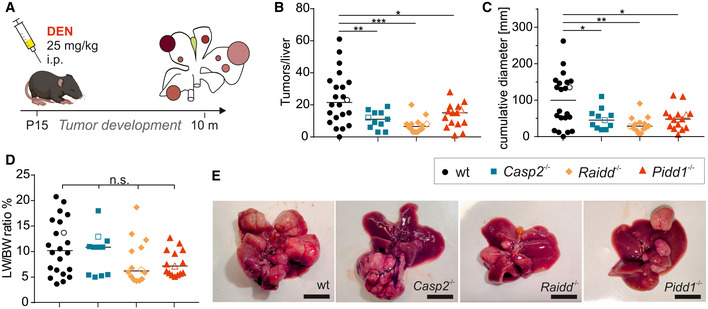
Male wt and PIDDosome‐deficient mice were injected with 25 mg/kg DEN at the age of 15 days, and their livers were analyzed 10 months later.
Numbers of surface tumors per liver were counted.
The cumulative diameter of all surface tumors per liver per mouse reflects the overall tumor load.
Weight of the livers including tumor mass relative to the body weight (LW/BW ratio) was recorded.
Representative pictures of total livers with tumors of the indicated genotypes.
- A
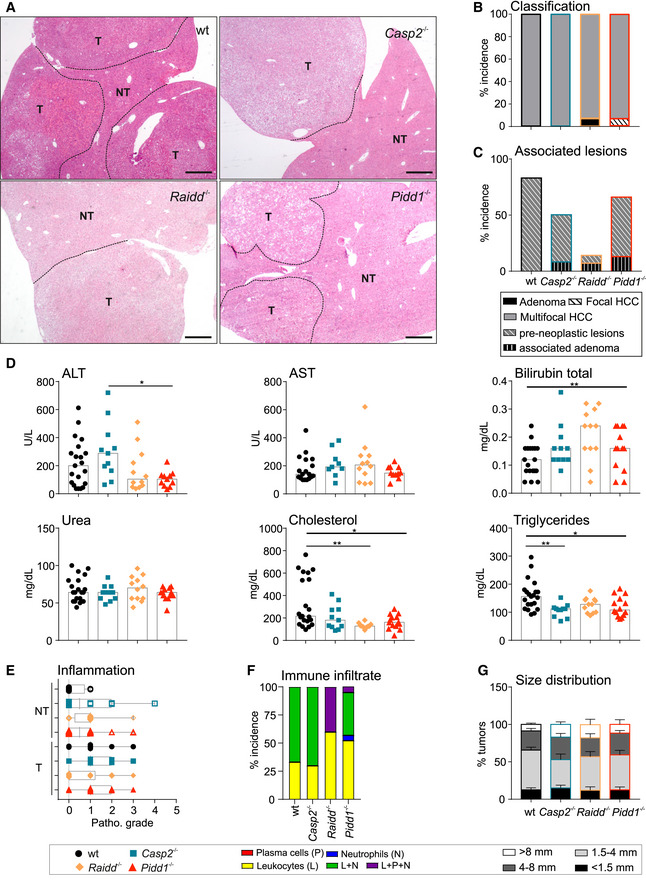
Representative overviews of tumor‐bearing murine liver tissue of all genotypes used. N‐numbers refer to biological replicates. Scale bar size equals 540 µm.
- B, C
Histopathological analysis was performed to define tumor classification and associated and pre‐neoplastic lesions in DEN‐treated mice.
- D
Levels of serum parameters indicative for liver function and integrity in all genotypes tested. AST, aspartate aminotransferase; ALT, alanine aminotransferase. wt n = 21, Casp2−/− n = 11, Raidd−/− n = 12, Pidd1−/− n = 11.
- E
The grade of inflammation was histopathologically analyzed in tumorous (T) and non‐tumorous (NT) tissue of HCC bearing DEN‐treated mice. The central band represents the median, the boxes indicate the 25th and the 75th percentile, and the whiskers represent the range.
- F
The type of immune infiltrate in DEN‐induced HCC tumor tissue was determined as % incidence. Infiltrated found were leukocytes (L), neutrophils (N), plasma cells (P), or mixed population (L + N; L + P + N). No macrophages were found in the immune infiltrates.
- G
Size distribution of DEN‐induced surface tumors, data are shown as mean ± SEM.
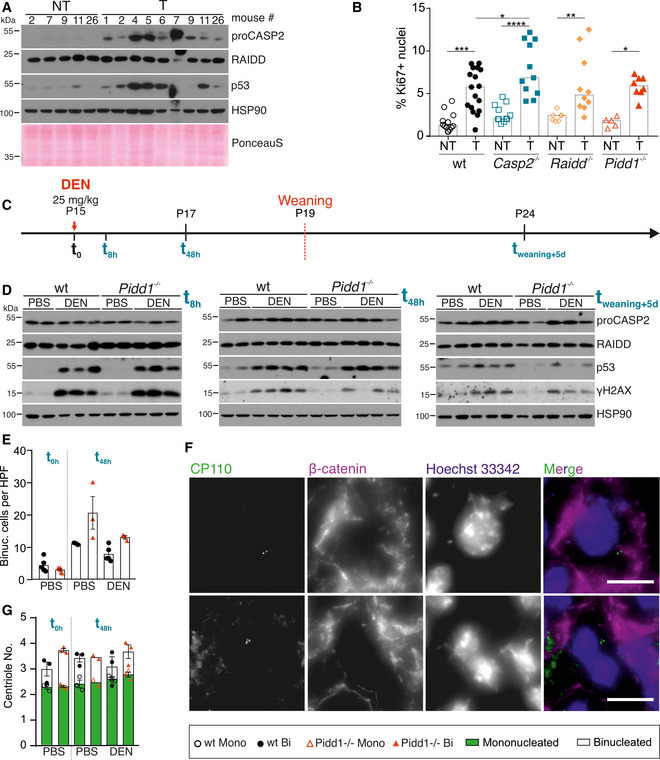
Immunoblots of wt non‐tumorous (NT) and tumor (T) tissue lysates were probed for CASP2, RAIDD, and p53. HSP90 and PonceauS protein staining served as loading controls.
Proliferation of tumor tissue was determined by the percentage of Ki67‐positive nuclei analyzed by flow cytometry. T: wt n = 17, Casp2−/− n = 11, Raidd−/− n = 10, Pidd1−/− n = 8; NT: wt n = 12, Casp2−/− n = 11, Raidd−/− n = 7, Pidd1−/− n = 5. N‐numbers refer to biological replicates.
Experimental outline: 15‐day‐old (P15) female and male wt and Pidd1−/− mice were injected with DEN (25 mg/kg) or PBS at t(0). The livers were analyzed after t(8 h) and t(48 h), or the mice were weaned at P19 to induce polyploidization and livers harvested 5 days later t(weaning + 5 d). t(8 h) PBS: wt n = 5, Pidd1−/− n = 5; DEN: wt n = 3, Pidd1−/− n = 3. t(48 h) PBS: wt n = 3, Pidd1−/− n = 3; DEN: wt n = 5, Pidd1−/− n = 3. t(weaning + 5 d) PBS: wt n = 3, Pidd1−/− n = 3; DEN: wt n = 3, Pidd1−/− n = 3.
Immunoblots of the experiment described in (C) at t(8 h), t(48 h), and t(weaning + 5 d) for CASP2, RAIDD, p53, γH2AX, and HSP90 expression as loading control.
The number of binucleated hepatocytes per field was counted on H&E‐stained paraffin sections of PBS treated wt and Pidd1−/− mice at t(0 h) and at t(48 h) after PBS or DEN treatment. N‐numbers refer to biological replicates.
Immunofluorescence of the same livers shown in (E) performed for the distal centriolar protein CP110 to stain centrioles, β‐catenin for cell borders, and DAPI to stain DNA. Representative images of a mononucleated hepatocyte with 2 centrioles and a binucleated hepatocyte with 4 centrioles are shown.
Centriole number was quantified with respect to the number of nuclei per cell in wt and Pidd1−/− livers at the time points described in (E); n = 3 biological replicates.
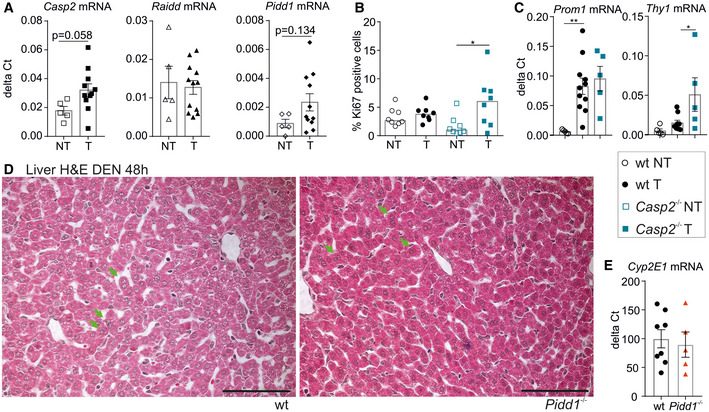
Transcript levels of Casp2, Raidd (P = 0.74) and Pidd1 in non‐tumorous (NT) and tumor tissue (T) from mice bearing DEN‐induced HCC. Hprt mRNA expression was used for normalization.
Proliferation was assessed by immunostaining of Ki67 on paraffin‐embedded tissue sections; n = 8 per genotype and tissue. Data are shown as median.
Transcript levels of Prom1 and Thy1, the genes encoding for the cancer stem cell markers CD133 and CD90, in NT and T of wt and T of Casp2−/− mice with DEN‐HCC. The Ct values were normalized over Hprt expression.
Representative images of H&E‐stained liver sections that were used for the quantification of binucleated cells in Fig 2E (green arrows mark examples). Scale bar represents 100 µm.
Transcript levels of Cyp2E1 in wt (n = 8) and Pidd1−/− (n = 5) livers from 15‐day‐old mice.
- A, B
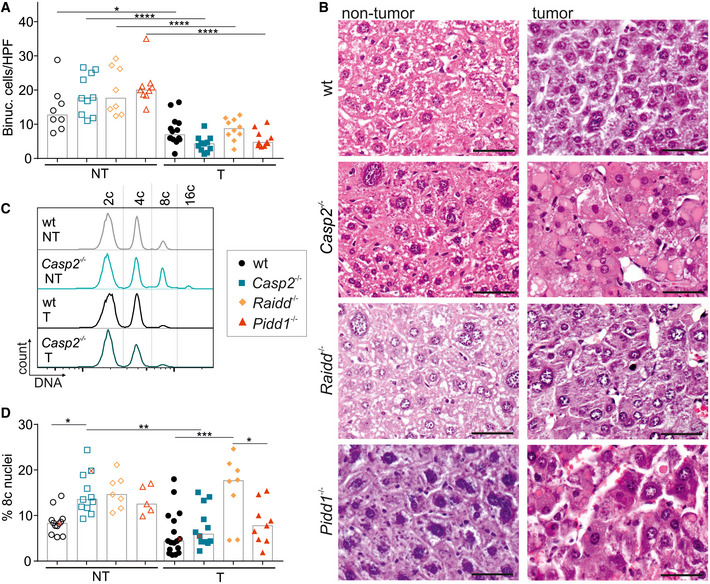
(A) Binucleation was assessed blinded in H&E‐stained sections of murine non‐tumor (NT) and tumor tissue (T) also shown in (B). T: wt n = 14, Casp2−/− n = 11, Raidd−/− n = 10, Pidd1−/− n = 10; NT: wt n = 8, Casp2−/− n = 10, Raidd−/− n = 8, Pidd1−/− n = 9. N‐numbers refer to biological replicates.
- C, D
(C) Representative histograms of nuclei stained for DNA, which were isolated from non‐tumor and tumor tissue of wt and Casp2−/− mice. These animals are marked as red “x” in the quantification shown in (D) where the degree of polyploidy is reflected as percentage of octaploid nuclei (T: wt n = 17, Casp2−/− n = 11, Raidd−/− n = 10, Pidd1−/− n = 8; NT: wt n = 12, Casp2−/− n = 11, Raidd−/− n = 7, Pidd1−/− n = 5). N‐numbers refer to biological replicates.
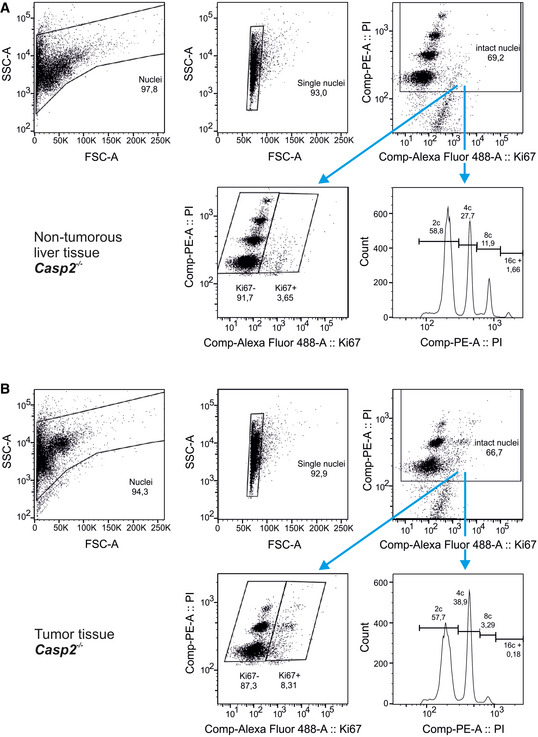
- A, B
Gating strategy for DNA content analysis using flow cytometry to determine the ploidy distribution of non‐tumorous (A) and tumor tissue (B).
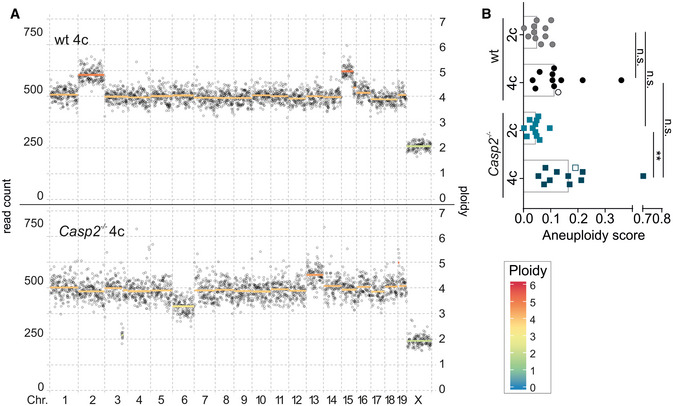
- A, B
(A) Representative dot plots show the degree of aneuploidy and heterogeneity and are quantified in (B, empty symbols). Data are represented as median, statistical significance was determined by one‐way ANOVA with multiplicity correction (Sidak–Holm); *P ≤ 0.05, **P ≤ 0.01. N‐numbers refer to biological replicates.
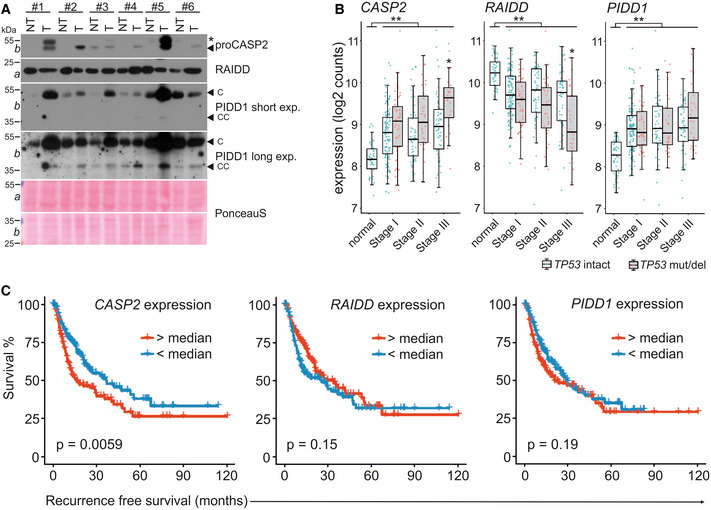
Matched patient non‐tumor (NT) and tumor tissue (T) samples were analyzed by immunoblotting for CASP2, PIDD1, and RAIDD on membranes a and b. PonceauS protein staining serves as loading control. The asterisk refers to an unspecific band; “C” and “CC” indicate the functionally active fragments of PIDD1 generated by autoprocessing, PIDD‐C and PIDD‐CC. Densitometric quantification of these blots is shown in Fig EV4A.
mRNA expression analysis of the PIDDosome components in the TCGA Provisional LIHC data set across disease stages. Patients are divided based on the p53 mutation/deletion (mut/del) status. Statistical significance was determined using two‐way ANOVA with Tukey’s post hoc analysis. The central band represents the median, the boxes indicate the 25th and 75th percentile, the whiskers are the 5th and 95th percentiles, and statistical significance was defined as *P ≤ 0.05, **P ≤ 0.01.
The same data set was analyzed for recurrence‐free survival based on high or low expression of CASP2, RAIDD or PIDD1 divided at the median. Statistical significance was determined using a log‐rank test.
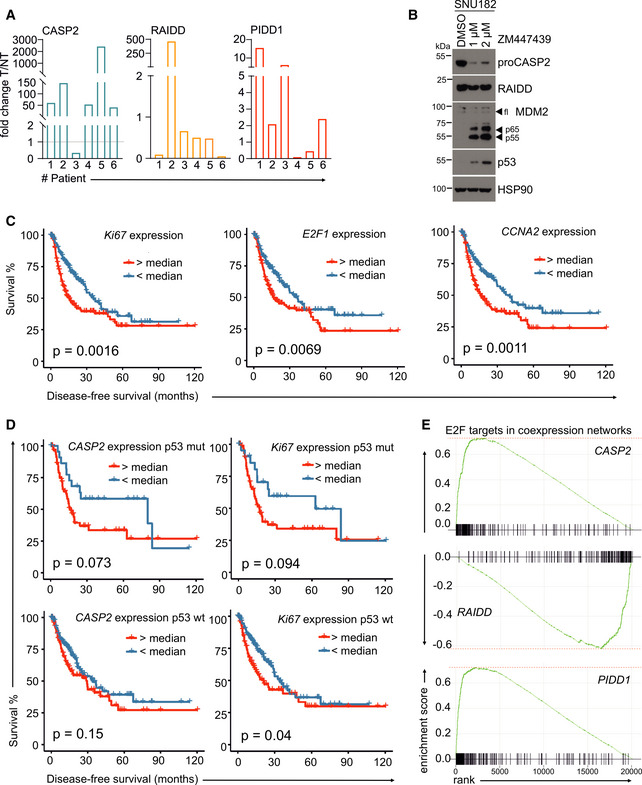
Densitometric quantification of the immunoblot in Fig 5A is shown as the fold change in tumor (T) tissue over non‐tumorous (NT) tissue of the individual patients. The values for proCASP2, PIDD‐C, and RAIDD were normalized to the corresponding PonceauS staining.
Immunoblot of the HCC cell line SNU182 treated with DMSO or increasing concentrations of the Aurora B inhibitor ZM447439. The membrane was probed for CASP2, RAIDD, MDM2, p53, and HSP90 as loading control.
Recurrence‐free survival of HCC patients in the TGCA Provisional data set (LIHC) expressing high or low levels of the proliferation‐associated genes Ki67, E2F1, and CCNA2.
Disease‐free survival of the TGCA HCC patients shown in Fig 5C was analyzed with respect to the p53 (mutated or wt) status. Data are divided at the median, and statistical significance was tested using a log‐rank test.
Butterfly plots showing the enrichment of E2F target genes in the co‐expression networks of CASP2, RAIDD, and PIDD1 in the same TCGA data set.
- A
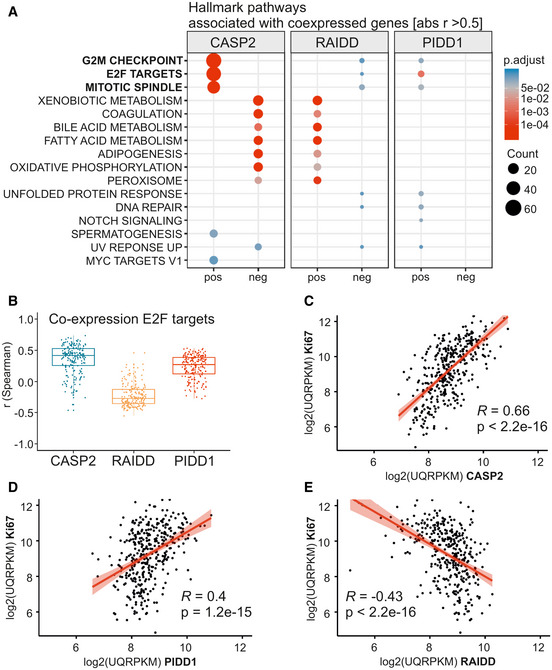
Genes co‐expressed with the PIDDosome components were examined with respect to the associated hallmark pathways taking positive (pos) and negative (neg) correlation into account.
- B
E2F target genes expression was analyzed for correlation with expression of CASP2, RAIDD, and PIDD1 using Spearman’s correlation coefficient. The central band represents the median, the boxes indicate the 2nd and 3rd quartile, and the whiskers are 1.5 times the interquartile range (n = 200 genes).
- C–E
Correlation (Pearson) of CASP2, RAIDD, and PIDD1 mRNA with transcript levels of Ki67 in the TCGA data set.
- A
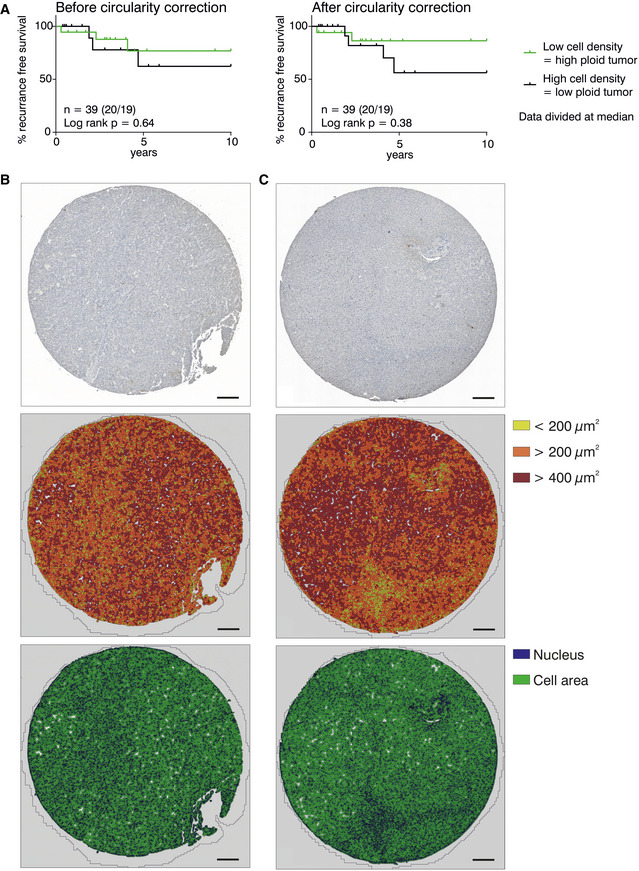
A subset of 39 HCC patient images was analyzed before and after introducing a circularity cutoff (37 HCV, 2 HBV patients). Nuclei above a cutoff of 7 out of 10 were considered as hepatocytes or tumor cells.
- B, C
Representative examples of the morphometric analyses of tumor biopsies from HCC patients with HCV (B) or ALD (C). Paraffin‐embedded tissue sections were stained with hematoxylin and tryptase. Tissue Studio® allows analysis of the cell density by detection of nuclei (blue) and cell area (green) and can be used to classify the cells by size as indicated by the color code. Scale bar size equals 200 µm.
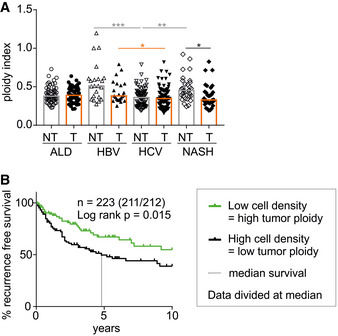
The ploidy index is inferred as 1/cell density of tumorous (T) and non‐tumorous (NT) tissue of HCC patients with different liver diseases. ALD—alcoholic liver disease (n = 65); HBV—hepatitis B virus infection (n = 24); HCV—hepatitis C virus infection (n = 85); NASH—non‐alcoholic steatohepatitis (n = 33). Statistical significance was determined by one‐way ANOVA with multiplicity correction (Sidak–Holm); *P ≤ 0.05, **P ≤ 0.01, ***P ≤ 0.001. n‐numbers refer to the number of patient samples analyzed.
All patients were grouped according to HCC tumor cell density as surrogate for tumor ploidy. Data were divided at the median, and exact patient numbers are shown in the graphs. Median recurrence‐free survival (RFS) for a period of 10 years for patients with low tumor ploidy was 4.8 years. For patients with high tumor ploidy, the median RFS could not be defined as more than 50% of the patients survived without relapse. Patient characteristics are shown in Appendix Table S1. A log‐rank test was used to determine statistical significance.
Comment in
-
Hepatocyte ploidy modulation in liver cancer.EMBO Rep. 2020 Dec 3;21(12):e51922. doi: 10.15252/embr.202051922. Epub 2020 Nov 25. EMBO Rep. 2020. PMID: 33237586 Free PMC article.
References
-
- Anstee QM, Reeves HL, Kotsiliti E, Govaere O, Heikenwalder M (2019) From NASH to HCC: current concepts and future challenges. Nat Rev Gastroenterol Hepatol 16: 411–428 - PubMed
Publication types
MeSH terms
Substances
Grants and funding
LinkOut - more resources
Full Text Sources
Medical
Molecular Biology Databases
Research Materials
Miscellaneous
