. 2021 Feb 23;143(8):805-820.
doi: 10.1161/CIRCULATIONAHA.120.048121. Epub 2020 Nov 23.

Cardiac Pressure Overload Decreases ETV1 Expression in the Left Atrium, Contributing to Atrial Electrical and Structural Remodeling

Affiliations

Cardiac Pressure Overload Decreases ETV1 Expression in the Left Atrium, Contributing to Atrial Electrical and Structural Remodeling

Naoko Yamaguchi et al. Circulation. .

Erratum in

Abstract

Background: Elevated intracardiac pressure attributable to heart failure induces electrical and structural remodeling in the left atrium (LA) that begets atrial myopathy and arrhythmias. The underlying molecular pathways that drive atrial remodeling during cardiac pressure overload are poorly defined. The purpose of this study is to characterize the response of the ETV1 (ETS translocation variant 1) signaling axis in the LA during cardiac pressure overload in humans and mouse models and explore the role of ETV1 in atrial electrical and structural remodeling.

Methods: We performed gene expression profiling in 265 left atrial samples from patients who underwent cardiac surgery. Comparative gene expression profiling was performed between 2 murine models of cardiac pressure overload, transverse aortic constriction banding and angiotensin II infusion, and a genetic model of Etv1 cardiomyocyte-selective knockout (Etv1f/fMlc2aCre/+).

Results: Using the Cleveland Clinic biobank of human LA specimens, we found that ETV1 expression is decreased in patients with reduced ejection fraction. Consistent with its role as an important mediator of the NRG1 (Neuregulin 1) signaling pathway and activator of rapid conduction gene programming, we identified a direct correlation between ETV1 expression level and NRG1, ERBB4, SCN5A, and GJA5 levels in human LA samples. In a similar fashion to patients with heart failure, we showed that left atrial ETV1 expression is downregulated at the RNA and protein levels in murine pressure overload models. Comparative analysis of LA RNA sequencing datasets from transverse aortic constriction and angiotensin II-treated mice showed a high Pearson correlation, reflecting a highly ordered process by which the LA undergoes electrical and structural remodeling. Cardiac pressure overload produced a consistent downregulation of ErbB4, Etv1, Scn5a, and Gja5 and upregulation of profibrotic gene programming, which includes Tgfbr1/2, Igf1, and numerous collagen genes. Etv1f/fMlc2aCre/+ mice displayed atrial conduction disease and arrhythmias. Correspondingly, the LA from Etv1f/fMlc2aCre/+ mice showed downregulation of rapid conduction genes and upregulation of profibrotic gene programming, whereas analysis of a gain-of-function ETV1 RNA sequencing dataset from neonatal rat ventricular myocytes transduced with Etv1 showed reciprocal changes.

Conclusions: ETV1 is downregulated in the LA during cardiac pressure overload, contributing to both electrical and structural remodeling.

Keywords: atrial fibrillation; atrial remodeling; heart failure; signal transduction; transcription factors.


Figures
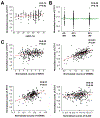
Figure 1.
Figure 1.. Transcription factor ETV1 expression is reduced in patients with reduced ejection fraction.
(A–C)ETV1 expression in the left atrium (LA) of 265 patients (251 patients who underwent heart surgery and 14 donors for heart transplant) correlates with left ventricular ejection fraction (LVEF) (A) but not with atrial fibrillation (AF) (B). Simple linear regression analysis or analysis of variance was used. AF-/SR: patients who had no history of AF and showed sinus rhythm (SR) at the time of surgery, AF+/SR: patients diagnosed with AF who were in SR at time of surgery, AF+/AF: patients diagnosed with AF and were in AF or atrial flutter at time of surgery. (C) ETV1 expression correlates with the NRG1/ERBB4 signaling pathway and rapid conduction genes, SCN5A and GJA5, by simple linear regression analysis.
Figure 2.
Figure 2.. Cardiac pressure overload reduces Etv1-nlz reporter gene expression in the left atrium.
(A–D) Etv1 expression in the Etv1nlz/+ reporter mouse is reduced in the left atrium (LA) after 2 weeks of transverse aortic constriction (TAC) banding (A, B) or 2 weeks of angiotensin II (AngII) treatment (C, D) compared to control. Etv1-nlz reporter gene expression is minimally affected in the right atrium (RA) in TAC banded hearts. AngII treatment showed reduced expression of Etv1-nlz reporter gene expression in the RA but to a lesser extent than in the LA. Scale bars 500 μm in (A, C), 1 mm in (B, D).
Figure 3.
Figure 3.. RNA-seq analysis shows differentially expressed genes in the mouse left atrium (LA) with transverse aortic constriction (TAC) banding and Angiotensin II (AngII) infusion.
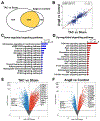
(A) Venn diagram displaying overlap of 3364 differentially expressed genes between TAC and AngII experiments. (B) Pairwise correlation between log fold change of differential gene expression in AngII vs. TAC banded experiments (R = 0.88, P < 2.2×10⁻¹⁶). (C, D) KEGG pathway analysis of the downregulated (C) and upregulated (D) genes involved in signaling pathways from the group of 3364 overlapping genes in (A). (E, F) Volcano plots of differential expression in the LA from TAC banded (E) and AngII infused (F) mice. All significant differentially expressed genes (P < 0.05) are labeled blue (downregulated) or red (upregulated) and all non-significant differentially expressed genes are labeled in gray. Downregulation of Etv1, Erbb4, Scn5a, and Gja5 and upregulation of pro-fibrotic genes (Tgfbr1, Tgfbr2, Igf1, and numerous collagen genes) are similar between TAC banding and AngII infusion.
Figure 4.
Figure 4.. TAC banding and AngII treatment reduced ETV1, ErbB4, and NaV1.5, and increased fibrosis in the left atria.
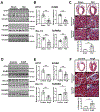
Quantitative values were normalized to vinculin. Values show mean±SD. Student’s t-test was used for statistical analysis except Mann–Whitney test for ETV1 expression for TAC vs. sham. *P < 0.05, **P < 0.01. n = 6–9 per group. (A, B) In the left atrium (LA), ETV1, ErbB4, and NaV1.5 are reduced, while TGFBR2 is increased in transverse aortic constriction (TAC) banded mice compared to sham-operated mice. Molecular weight on western blot: ETV1 ~58 kDa, ErbB4 ~180 kDa, NaV1.5 ~260 kDa, TGFBR2 ~55 kDa, and vinculin ~125 kDa. (C) Masson’s trichrome staining displays fibrotic changes in the LA in TAC banded mice. Whole LA section was analyzed for fibrosis area using ImageJ. Values are shown as mean±SD. **P < 0.01 by Student’s t-test. n = 3 per group. Scale bars 500μm for top, 20μm for middle and bottom. (D, E) In the LA, ETV1, ErbB4, and NaV1.5 are reduced, while TGFBR2 is increased in angiotensin II (AngII) infused mice compared to vehicle control treated mice. Molecular weight on western blot: ETV1 ~58 kDa, ErbB4 ~180 kDa, NaV1.5 ~260 kDa, TGFBR2 ~55 kDa, and vinculin ~125 kDa. (F) Masson’s trichrome staining displays fibrotic changes in the LA in AngII treated mice. Whole LA section was analyzed for fibrosis area using ImageJ. Values are shown as mean±SD. *P < 0.05 by Student’s t-test. n = 3 per group. Scale bars 500μm for top, 20μm for middle and bottom.
Figure 5.
Figure 5.. Etv1 knockout (Etv1f/fMlc2aCre/+) model demonstrates cardiac conduction disturbance and arrhythmia.
(A) PCR analysis of DNA from left atrial tissue displaying targeted Etv1 exon 11 deletion in the left atrium (LA) of Etv1f/fMlc2aCre/+ mice. The 188 and 130 bp bands represent unrecombined and recombined f/f alleles, respectively. (B, C) Western blot assay and densitometric analysis showing reduced ETV1 expression in the LA in Etv1f/fMlc2aCre/+ mice. Molecular weight on western blot: ETV1 ~58 kDa and vinculin ~125 kDa. Values are presented as mean±SD. **P < 0.01 by Student’s t-test. (D) Representative electrocardiogram (ECG) traces recorded from sedated Etv1f/fMlc2aCre/+ and control (Etv1f/f) mice. ECG parameters analyzed with LabChart v8.1.9 demonstrate prolonged P duration, PR interval, and QRS interval in Etv1f/fMlc2aCre/+ mice (n = 13) compared to control (n = 17). Values are presented as mean±SD. *P < 0.05, **P < 0.01 by Student’s t-test. HR, heart rate; QTc, corrected QT interval. (E) Representative ECG traces in Etv1f/fMlc2aCre/+ mice showing abnormalities. Upper trace indicates atrial ectopic beats (red arrowhead), and lower trace indicates non-sustained ventricular tachycardia.
Figure 6.
Figure 6.. Comparison of gene expression between Etv1 loss-of-function, Etv1 gain-of-function, TAC banded, and AngII treated models.
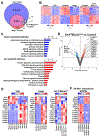
(A) Venn diagram of differentially expressed genes in the left atrium from three model systems, transverse aortic constriction (TAC) banded, angiotensin II (AngII) treated, and Etv1f/fMlc2aCre/+ models, reveals 281 overlapping genes. (B) Heatmap of the 281 overlapping genes from (A) show highly similar expression patterns between TAC banded, AngII treated, and Etv1f/fMlc2aCre/+ models. (C) KEGG pathway analysis of the 281 overlapping genes separated into downregulated (blue) and upregulated (red) groups (18 non-redundant categories are shown). (D) Volcano plot of differential expression from Etv1f/fMlc2aCre/+ shows down-regulation of Erbb4, Scn5a and Gja5 and up-regulation of pro-fibrotic genes (Tgfbr1, Tgfbr2, Igf1, and collagen genes) as similarly seen in pressure overload models. All significant differentially expressed genes (P < 0.05) are labeled blue (down-regulated) or red (up-regulated) and all non-significant differentially expressed genes are labeled in gray. (E) Heatmap showing similar gene expression profiles of Etv1, Erbb4, Scn5a, Gja5 and pro-fibrotic genes in the three model systems. (F) Heat map from neonatal rat ventricular myocytes (NRVMs) transduced with Ad-Etv1-EGFP (normalized to Ad-EGFP) demonstrates that adenoviral mediated expression of Etv1 in NRVMs causes reciprocal changes in gene expression compared to TAC banded, AngII treated, and Etv1f/fMlc2aCre/+ models.
Figure 7.
Figure 7.. Protein level and functional characterization of the left atrium (LA) from Etv1 knockout (Etv1f/fMlc2aCre/+) mice.
(A) Representative immunoblots of ErbB4, NaV1.5, and TGFBR2 in Etv1f/fMlc2aCre/+ vs. littermate control (Etv1f/f) mice. Molecular weight on western blot: ErbB4 ~180 kDa, NaV1.5 ~260 kDa, TGFBR2 ~55 kDa, and vinculin ~125 kDa. (B) Densitometric measurements normalized to vinculin show ErbB4 and NaV1.5 are reduced, while TGFBR2 is increased in the LA in Etv1f/fMlc2aCre/+ compared to Etv1f/f mice (n = 9 per group). Values are presented as mean±SD. **P < 0.01 by Student’s t-test. (C) Masson’s trichrome staining displays fibrotic changes in the LA in Etv1f/fMlc2aCre/+ mice at 16–20 weeks old. Whole LA section was analyzed for fibrosis area using ImageJ. Values are shown as mean±SD. **P < 0.01 by Student’s t-test. n = 4–6 per group. Scale bars 500μm for top, 20μm for middle and bottom. (D–G) Whole-cell patch clamp data from dissociated left atrial myocytes using Etv1f/fMlc2aCre/+ and control (Etv1f/f) mice. (D) I-V relationship curve of sodium currents recorded from Etv1f/fMlc2aCre/+ (n = 17/3 cells/mice) and control (n = 15/3 cells/mice) left atrial cardiomyocytes. The amplitudes of sodium current were normalized to cell capacitance and presented as mean±SD. (E) Voltage dependence of the normalized conductance of INa. (n = 17/3 cells/mice for Etv1f/fMlc2aCre/+ and n = 15/3 cells/mice for control). (F) Voltage dependence of steady-state inactivation (n = 16/3 cells/mice for Etv1f/fMlc2aCre/+ and n = 15/3 cells/mice for control) (G) Time course of recovery from inactivation. (n = 16/3 cells/mice for Etv1f/fMlc2aCre/+ and n = 13/3 cells/mice for control).

References

    1. Dunlay SM and Roger VL. Understanding the epidemic of heart failure: past, present, and future. Curr Heart Fail Rep. 2014;11:404–415. doi: 10.1007/s11897-014-0220-x - DOI - PMC - PubMed
    1. Jessup M, Abraham WT, Casey DE, Feldman AM, Francis GS, Ganiats TG, Konstam MA, Mancini DM, Rahko PS, Silver MA, et al.2009 focused update: ACCF/AHA Guidelines for the Diagnosis and Management of Heart Failure in Adults: a report of the American College of Cardiology Foundation/American Heart Association Task Force on Practice Guidelines: developed in collaboration with the International Society for Heart and Lung Transplantation. Circulation. 2009;119:1977–2016. doi:10.1161/CIRCULATIONAHA.109.192064 - DOI - PubMed
    1. Gaspo R, Bosch RF, Bou-Abboud E and Nattel S. Tachycardia-induced changes in Na+ current in a chronic dog model of atrial fibrillation. Circ Res. 1997;81:1045–1052. doi:10.1161/01.res.81.6.1045 - DOI - PubMed
    1. Gemel J, Levy AE, Simon AR, Bennett KB, Ai X, Akhter S and Beyer EC. Connexin40 abnormalities and atrial fibrillation in the human heart. J Mol Cell Cardiol. 2014;76:159–168. doi: 10.1016/j.yjmcc.2014.08.021 - DOI - PMC - PubMed
    1. Gemel J, Simon AR, Patel D, Xu Q, Matiukas A, Veenstra RD and Beyer EC. Degradation of a connexin40 mutant linked to atrial fibrillation is accelerated. J Mol Cell Cardiol. 2014;74:330–339. doi: 10.1016/j.yjmcc.2014.06.010 - DOI - PMC - PubMed

Publication types

MeSH terms