. 2020 Nov 23;15(1):26.
doi: 10.1186/s13062-020-00277-0.

The power of randomization by sex in multilocus genetic evolution

Affiliations

The power of randomization by sex in multilocus genetic evolution

Liudmyla Vasylenko et al. Biol Direct. .

Abstract

Background: Many hypotheses have been proposed for how sexual reproduction may facilitate an increase in the population mean fitness, such as the Fisher-Muller theory, Muller's ratchet and others. According to the recently proposed mixability theory, however, sexual recombination shifts the focus of natural selection away from favoring particular genetic combinations of high fitness towards favoring alleles that perform well across different genetic combinations. Mixability theory shows that, in finite populations, because sex essentially randomizes genetic combinations, if one allele performs better than another across the existing combinations of alleles, that allele will likely also perform better overall across a vast space of untested potential genotypes. However, this superiority has been established only for a single-locus diploid model.

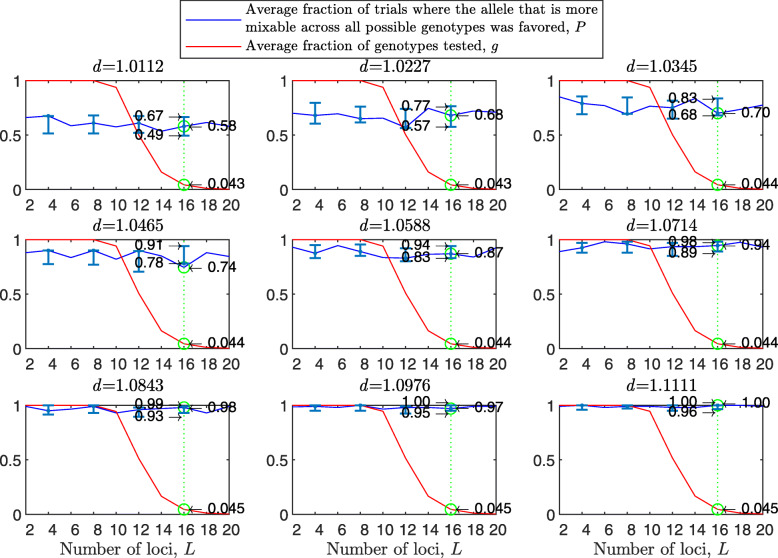
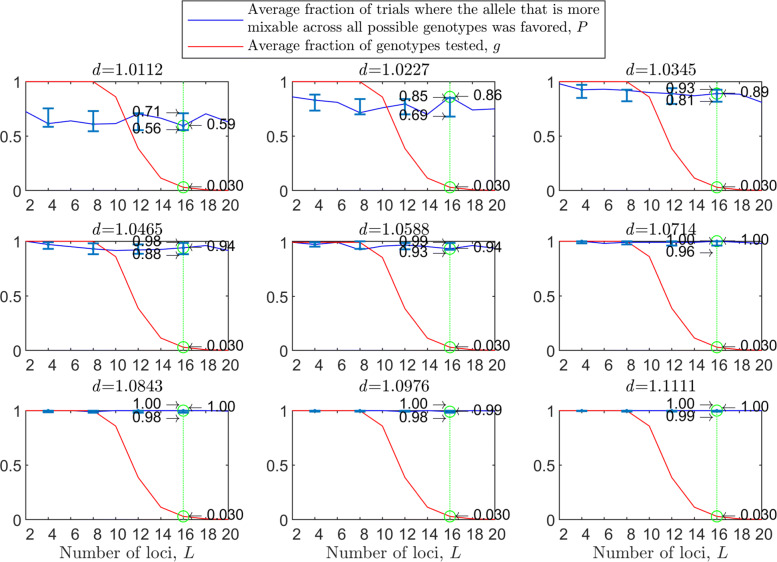
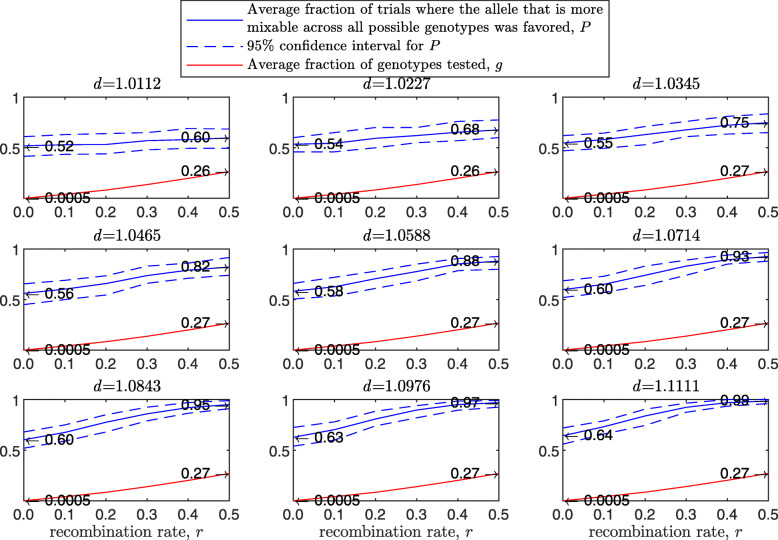
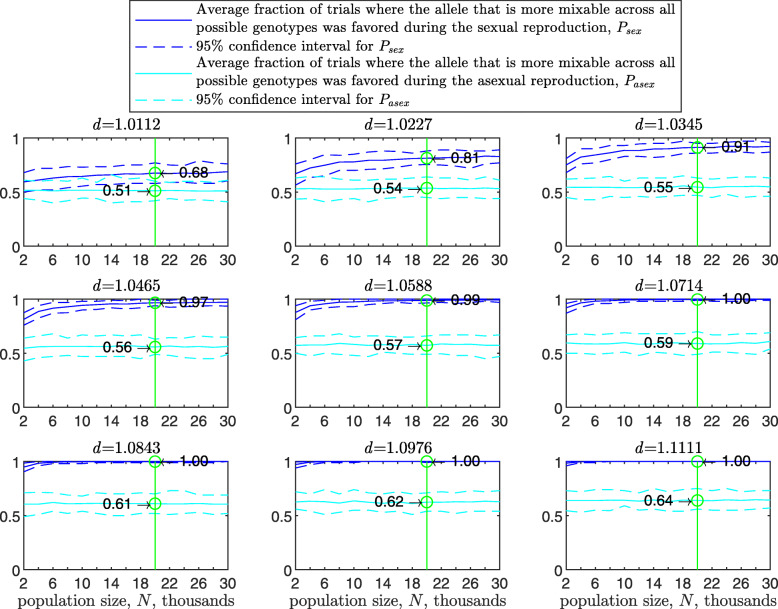
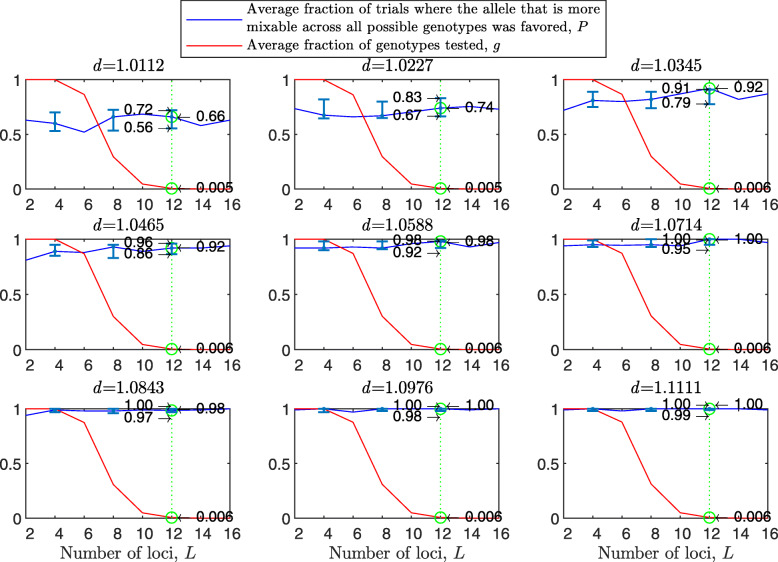
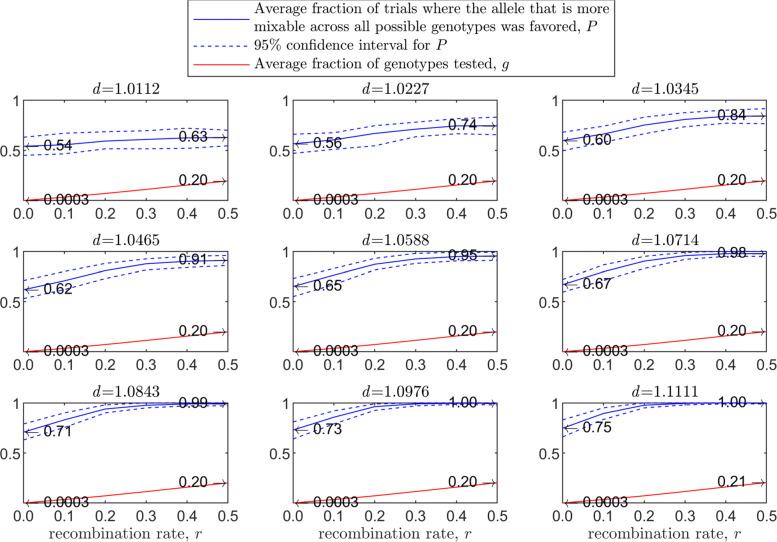
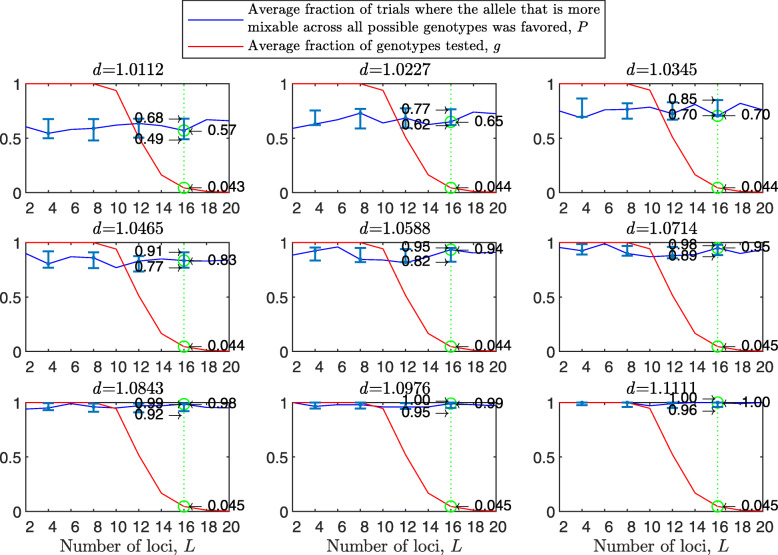
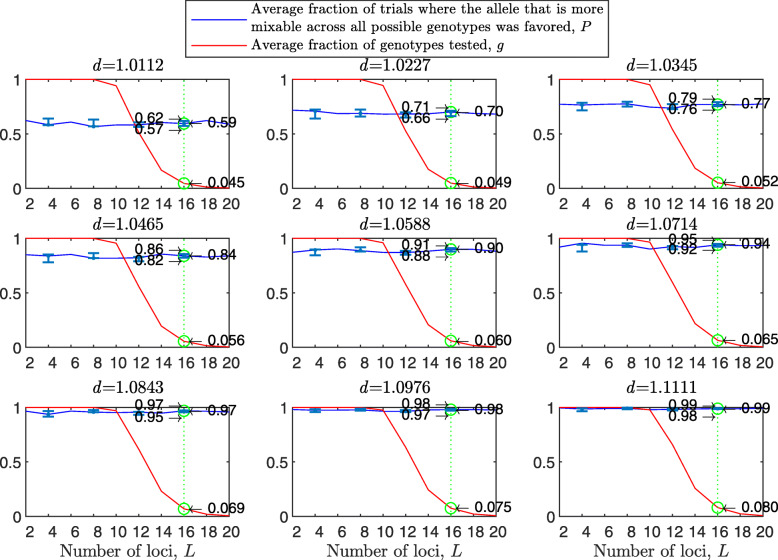
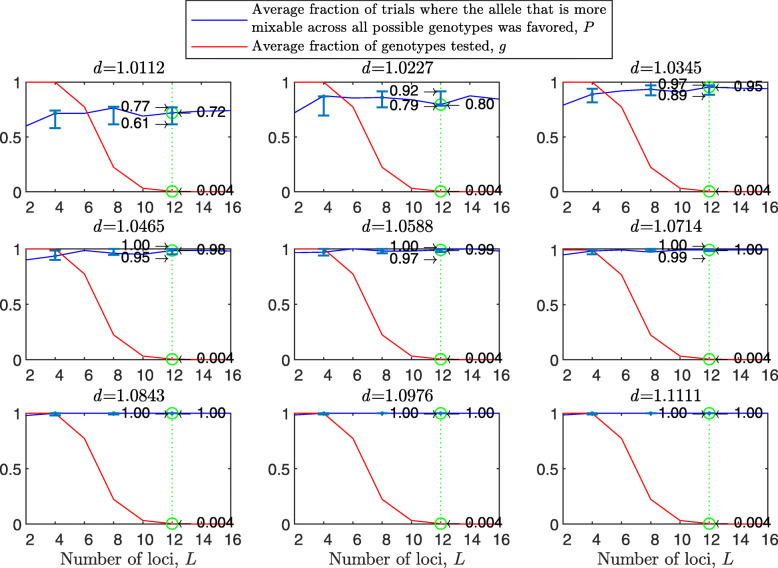
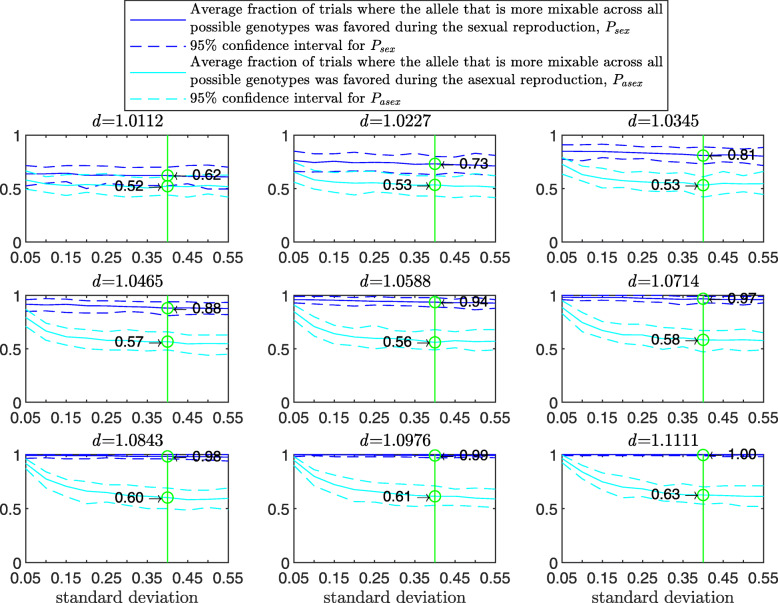
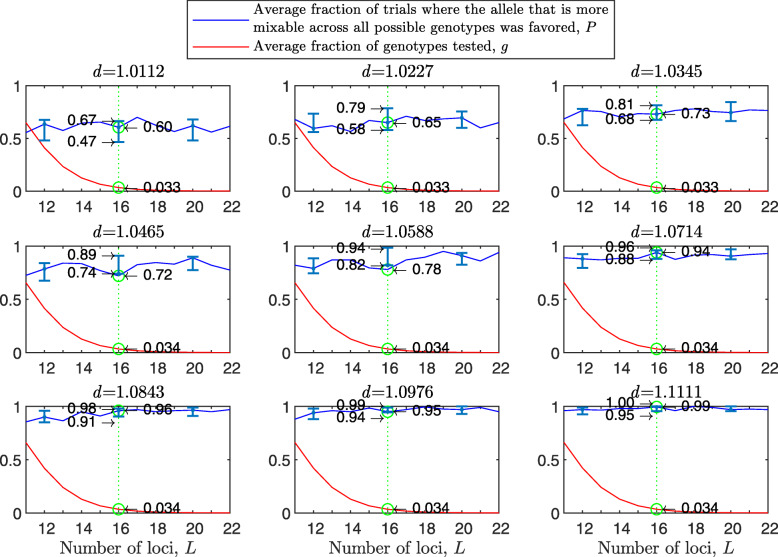
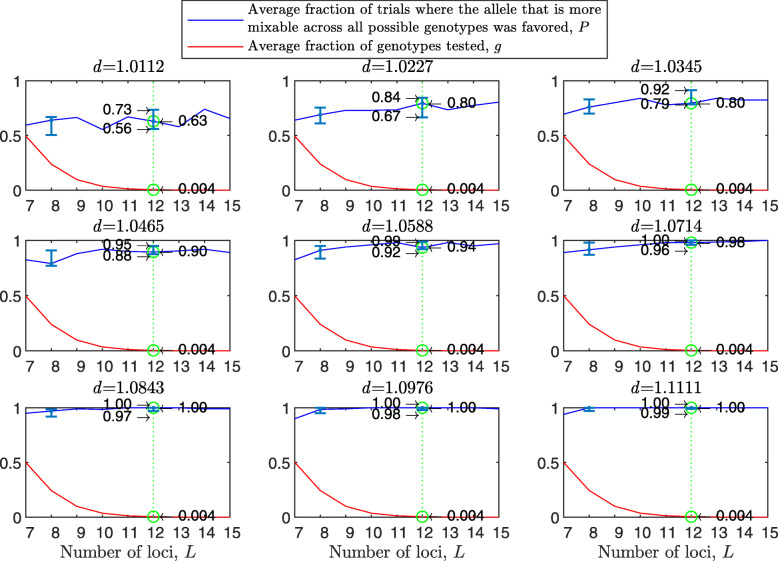
Results: We show that, in both haploids and diploids, the power of randomization by sex extends to the multilocus case, and becomes substantially stronger with increasing numbers of loci. In addition, we make an explicit comparison between the sexual and asexual cases, showing that sexual recombination is the cause of the randomization effect.

Conclusions: That the randomization effect applies to the multilocus case and becomes stronger with increasing numbers of loci suggests that it holds under realistic conditions. One may expect, therefore, that in nature the ability of an allele to perform well in interaction with existing genetic combinations is indicative of how well it will perform in a far larger space of potential combinations that have not yet materialized and been tested. Randomization plays a similar role in a statistical test, where it allows one to draw an inference from the outcome of the test in a small sample about its expected outcome in a larger space of possibilities-i.e., to generalize. Our results are relevant to recent theories examining evolution as a learning process.

Reviewers: This article was reviewed by David Ardell and Brian Golding.

Keywords: Epistasis; Interaction-based evolution; Multilocus models; Random sampling; Randomized algorithms; Sex and recombination.


Conflict of interest statement

The authors declare that they have no competing interests.

Figures

Fig. 1
Fig. 1
Random sampling in a multi-locus haploid model. Fitness values were drawn from the normal distribution N(0.7,0.15). In each panel, results are shown for a population size of 2000, a varying number of loci from 2 to 20 and 2 alleles per locus. In each panel, for each number of loci, based on 100 independent trials, the red line shows g, the average fraction of all possible genotypes that actually materialized and were tested by the population. For each such genotype, at least one individual was born with that genotype and either survived or did not. The blue line shows P, the fraction of trials in which the allele that is more mixable across all possible genotypes increased in frequency more than the allele that is less mixable across all possible genotypes. Bars for the 4, 8, 12 and 16 loci cases represent a 95% confidence interval for P based on 80 values, each of which was obtained based on 100 independent trials
Fig. 2
Fig. 2
Random sampling in the multi-locus haploid model without random genetic drift. The simulation conditions are as described in Fig. 1, except that now parents are divided into two mating types, mating can occur only between type 1 and type 2 individuals, each parent participates in exactly one reproductive event that creates two offspring, and each allele in each parent is transmitted exactly once. The difference between the present figure and Fig. 1 shows the importance of drift due to the sampling of parents and of alleles with replacement
Fig. 3
Fig. 3
Comparison of sampling made by sex and asex in a multi-locus haploid model. Fitness values were drawn from the normal distribution N(0.7,0.15) as described in the text. The starting population consists of two clones. In each panel, for each recombination rate from 0 (asex) to 0.5 (sex, free recombination case) on the x-axis, a population size of 2000, 12 loci and 2 alleles per locus, based on 100 independent trials the red line shows g, the blue solid line shows P, and the blue dashed line demarcates the 95% confidence interval of P, as in Fig. 1
Fig. 4
Fig. 4
Comparison of sampling by sex and by asex in the multi-locus haploid model for different population sizes. The simulation conditions are as described in Fig. 3, except that now the population size varies on the x-axes and only two recombination rates values are used, r=0 (asex, cyan solid line; 95% C.I. cyan dashed lines) and r=0.5 (sex, blue solid line; 95% C.I. blue dashed lines). The probability that the more mixable allele across all possible genotypes was favored, P, is markedly higher in the sexual case. Furthermore, as the population size is increased, P increases in the sexual population but not in the asexual one. This figure shows that with increasing population size, selection for mixability becomes stronger only in the sexual population
Fig. 5
Fig. 5
Random sampling in a multi-locus diploid model. The results were produced and presented in a manner analogous to Fig. 1, the difference being that this model is diploid and number of loci ranges from 2 to 16. Results are much stronger than in the haploid case
Fig. 6
Fig. 6
Comparison of sampling by sex and by asex in a multi-locus diploid model. Fitness values were drawn from the normal distribution N(0.7,0.15). In each panel, results are shown for a population size of 2000, 8 loci and 2 alleles per locus. The simulation conditions are as described in Fig. 3, the difference being that this model is diploid
Fig. 7
Fig. 7
Random sampling in a multi-locus haploid model with two mating types. The simulation conditions are as described in Fig. 1, except that now the parents are divided into two mating types, so that mating can occur only between type 1 and type 2 individuals
Fig. 8
Fig. 8
Random sampling in a multi-locus haploid model when all loci are tracked simultaneously. In each panel, results are shown for a population size of 2000, a varying number of loci from 2 to 20, and 2 alleles per locus, based on 100 independent trials. Bars for the 4, 8, 12 and 16 alleles represent 95% confidence interval for P based on 80 values, each of which was obtained based on 100 independent trials. P now refers to all loci rather than one (see main text). In comparison to the analysis of the first locus case in Fig. 1, L times more transformations are applied here to the fitness matrix. This leads to a decrease in both its variance (the reason for the thinner confidence interval of P) and average (the reason for the increase of g because more genotypes need to be created to obtain N surviving individuals). To facilitate comparison, the green line highlights the results for 16 loci case in Figs. 1 and 8
Fig. 9
Fig. 9
Comparison of sampling by sex and asex in the multi-locus haploid model for different standard deviations of the initial fitness values distribution. The simulation conditions are as described in Fig. 4, except that now the population size is fixed (N=2000) and the standard deviation of the fitness distribution varies. This figure shows that as the standard deviation increases, P decreases rapidly to almost 0.5 in the asexual population, while in the sexual population it decreases far more slowly in an apparently linear fashion
Fig. 10
Fig. 10
Random sampling in a multi-locus diploid model with two mating types. The simulation conditions are as described in Fig. 5, except that now the parents are divided into two mating types, so that mating can occur only between type 1 and type 2 individuals
Fig. 11
Fig. 11
Random sampling in the multi-locus diploid model without random genetic drift. Random sampling in the multi-locus diploid model with fitness values from the normal distribution N(0.7,0.15), two mating types and without replacement of parents and alleles. The simulation conditions are as described in Fig. 5, except that now the parents are divided into two mating types, each parent participates in exactly two reproductive events, and each allele in each parent is transmitted exactly once. The difference between the present figure and Fig. 5 shows the importance of drift due to the sampling of parents and of alleles with replacement
Fig. 12
Fig. 12
Random sampling in a diploid model with two loci and a different number of alleles. The simulation conditions are as described in Fig. 5, except that now the number of loci is fixed (L=2) and the number of alleles per locus, n, varies. This figure shows that as n increases, P decreases
Fig. 13
Fig. 13
Comparison of sampling made by sex and by asex in the multi-locus diploid model for different population sizes. The simulation conditions are as described in Fig. 6, except that now the population size varies on the x-axes and only two recombination rate values are used, r=0 (asex, cyan solid line; 95% C.I. cyan dashed lines) and r=0.5 (sex, blue solid line; 95% C.I. blue dashed lines). This figure shows that P is much higher in the sexual than in the asexual population, and that as the population size is increased, P increases further in the sexual but not in the asexual population
Fig. 14
Fig. 14
Comparison of sampling made by sex and by asex in the multi-locus diploid model for different standard deviations of the initial fitness distribution. The simulation conditions are as described in Appendix Fig. 13, except that now the population size is fixed (N=2000) and the standard deviation of the fitness values, σ, varies. This figure shows that as σ increases, P decreases rapidly in the asexual population to 0.52−0.63, while in the sexual population it decreases slowly in an apparently linear fashion. The maximum difference between P in the sex and asex cases is for σ of approximately 0.3−0.4
Fig. 15
Fig. 15
Random sampling in a multi-locus haploid model with binary fitness values. The fraction of genotypes of fitness 1 out of all possible genotypes for the more mixable allele is 0.9 for each panel, whereas the fraction of genotypes of fitness 1 out of all possible genotypes for the less mixable allele decreases from 0.89 to 0.81, producing a range of d values (the ratio between the fractions of genotypes of fitness 1) from 1.0112 to 1.1111
Fig. 16
Fig. 16
Distribution of fitness values in the haploid multi-locus model with binary fitness values. Each pair of bars shows the fraction of zeros or ones in the fitness matrix for one of the alleles of interest, for a population size of 2000, 18 loci and 2 alleles per locus. The fraction of genotypes of fitness 1 for the more mixable allele is 0.9, whereas the fraction of genotypes of fitness 1 for the less mixable allele decreases from 0.89 to 0.87, producing 3 d values. The left bar-chart shows two pairs of bars for alleles whose fractions of genotypes with fitness 1 are equal to 0.9 and 0.89, respectively, producing a mixability ratio d=0.90.891.0112. The right bar-chart represents two pairs of bars for alleles whose fractions of genotypes with fitness 1 are equal to 0.9 and 0.87, respectively, producing a mixability ratio d=0.90.871.0345. The first pair of bars in each panel shows the fraction of zero values in the fitness matrix and the second pair shows the fraction of ones. Note that the difference between the more mixable allele and the less mixable allele increases with d
Fig. 17
Fig. 17
Random sampling in the multi-locus haploid model with binary fitness values, two mating types and without replacement of parents and alleles. The simulation conditions are as described in Appendix Fig. 15, except that now the fitness values are binary and parents are divided into two mating types, so that mating can occur only between type 1 and type 2 individuals. Each parent participates in exactly one reproductive event, which creates two offspring, such that each allele in each parent is transmitted exactly once. The difference between the present figure and Appendix Fig. 15 shows the importance of drift due to the sampling of parents and of alleles with replacement
Fig. 18
Fig. 18
Comparison of sampling made by sex and by asex in a multi-locus haploid model with binary fitness values. The simulation process is similar to Fig. 3, except that now the fitness values are binary
Fig. 19
Fig. 19
Random sampling in a multi-locus diploid model with binary fitness values. The results are produced in a manner analogous to Appendix Fig. 15, the difference being that this model is diploid and the number of loci ranges from 7 to 15. The results in this model are much stronger than in the haploid case
Fig. 20
Fig. 20
Comparison of sampling made by sex and by asex in the multi-locus diploid model with binary fitness values. In each panel, results are shown for a population size of 2000, 8 loci and for 2 alleles per locus. The simulation conditions are as described in Fig. 6, except that now fitness values are either 0 or 1

Similar articles

Cited by

References

    1. Nei M. Modification of linkage intensity by natural selection. Genetics. 1967;57:625–41. - PMC - PubMed
    1. Feldman MW. Selection for linkage modification: I. Random mating populations. Theor Popul Biol. 1972;3:324–46. doi: 10.1016/0040-5809(72)90007-X. - DOI - PubMed
    1. Feldman MW, Christiansen FB, Brooks LD. Evolution of recombination in a constant environment. Proc Natl Acad Sci. 1980;77:4838–41. doi: 10.1073/pnas.77.8.4838. - DOI - PMC - PubMed
    1. Feldman MW, Liberman U. An evolutionary reduction principle for genetic modifiers. Proc Natl Acad Sci. 1986;83:4824–7. doi: 10.1073/pnas.83.13.4824. - DOI - PMC - PubMed
    1. Altenberg L, Feldman MW. Selection, generalized transmission and the evolution of modifier genes: I. The reduction principle. Genetics. 1987;117:559–72. - PMC - PubMed

Publication types

LinkOut - more resources