. 2020 Nov 23;13(1):50.
doi: 10.1186/s13072-020-00365-5.

Histone modifications associated with gene expression and genome accessibility are dynamically enriched at Plasmodium falciparum regulatory sequences

Affiliations

Histone modifications associated with gene expression and genome accessibility are dynamically enriched at Plasmodium falciparum regulatory sequences

Jingyi Tang et al. Epigenetics Chromatin. .

Abstract

Background: The malaria parasite Plasmodium falciparum has an unusually euchromatic genome with poorly conserved positioning of nucleosomes in intergenic sequences and poorly understood mechanisms of gene regulation. Variant histones and histone modifications determine nucleosome stability and recruit trans factors, but their combinatorial contribution to gene regulation is unclear.

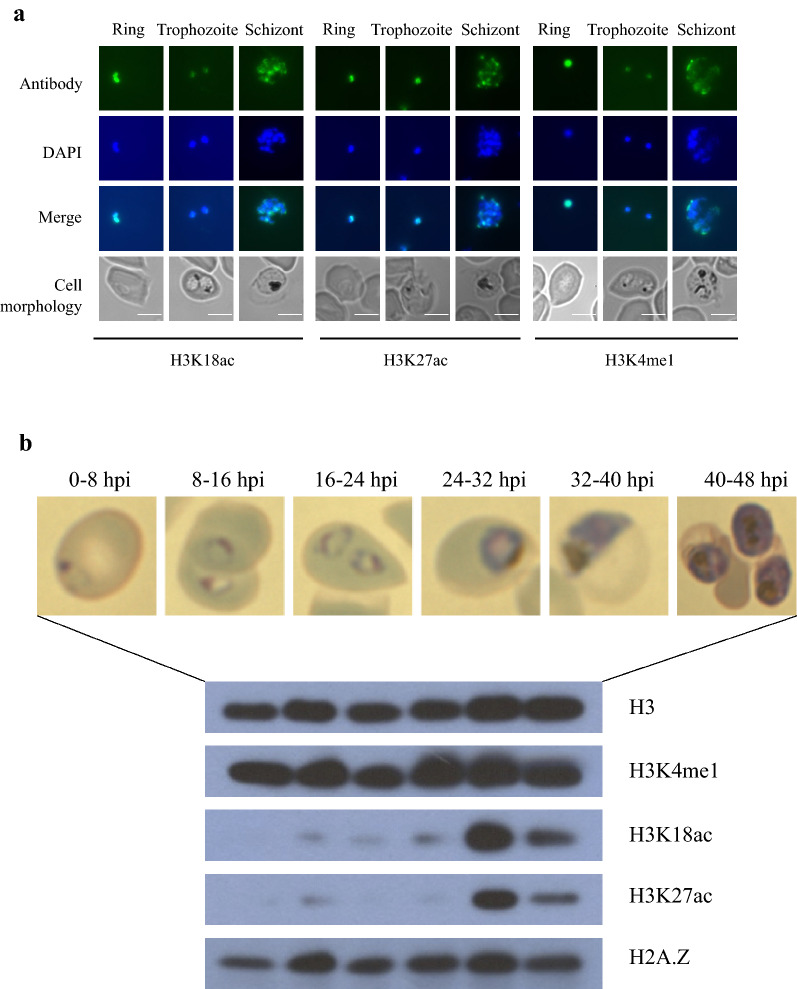
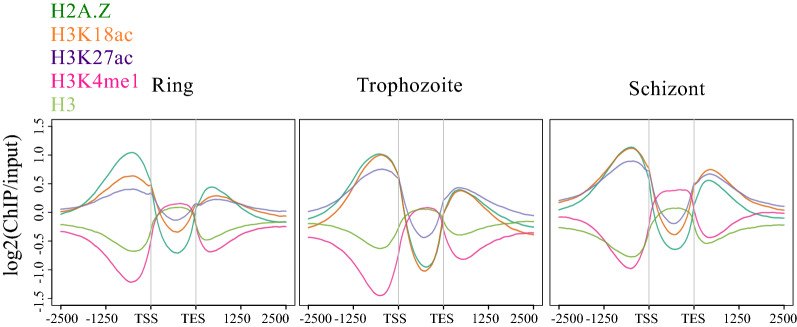
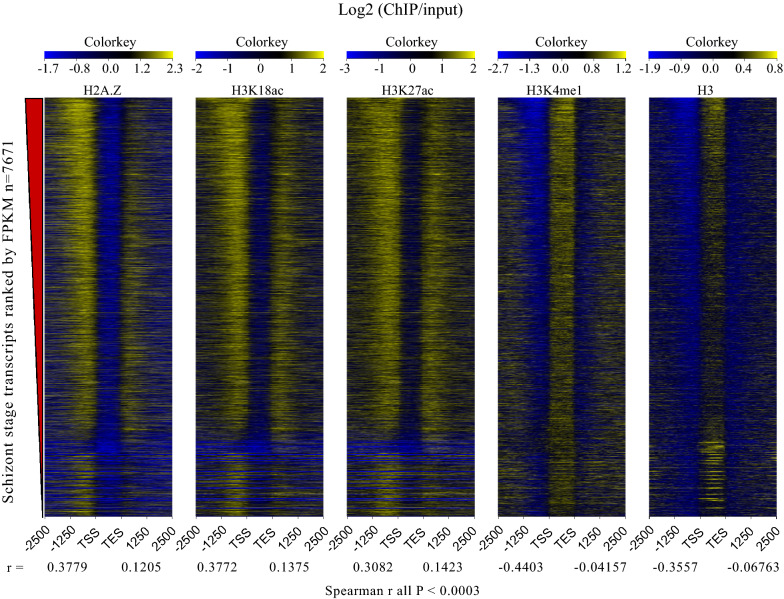
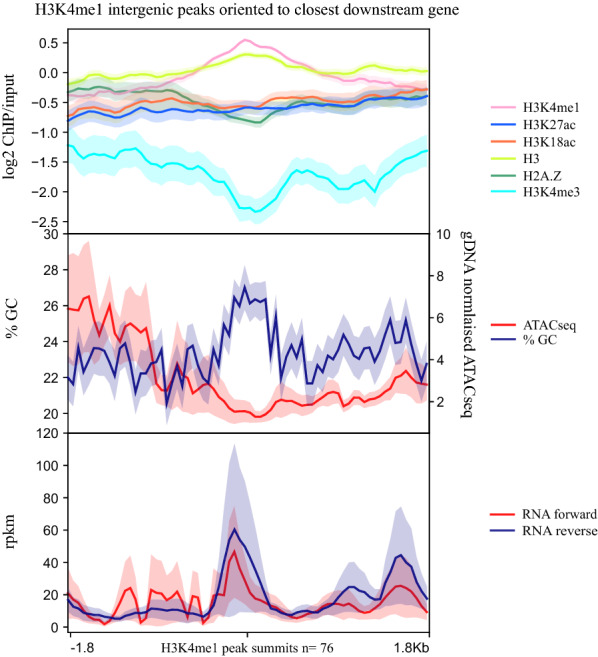
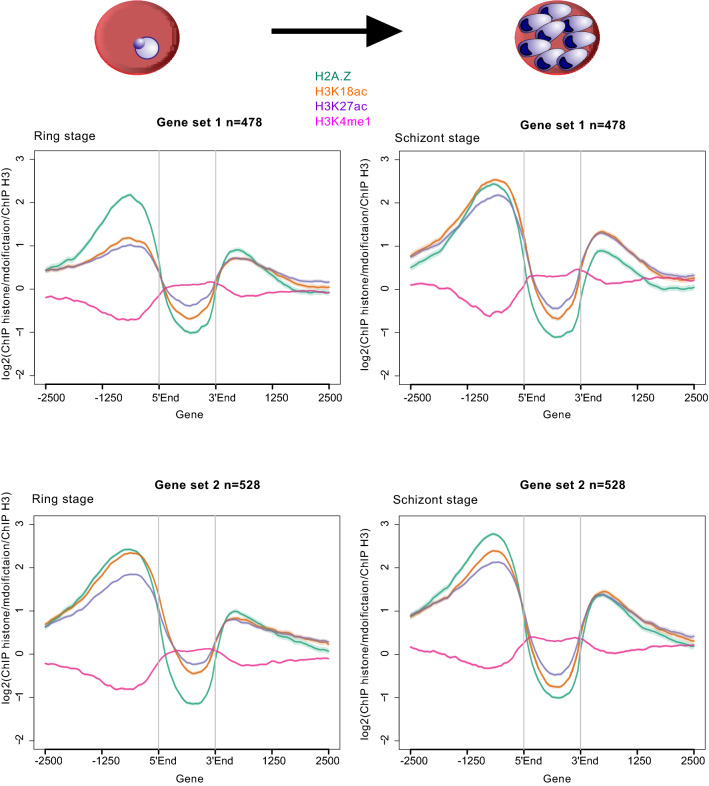
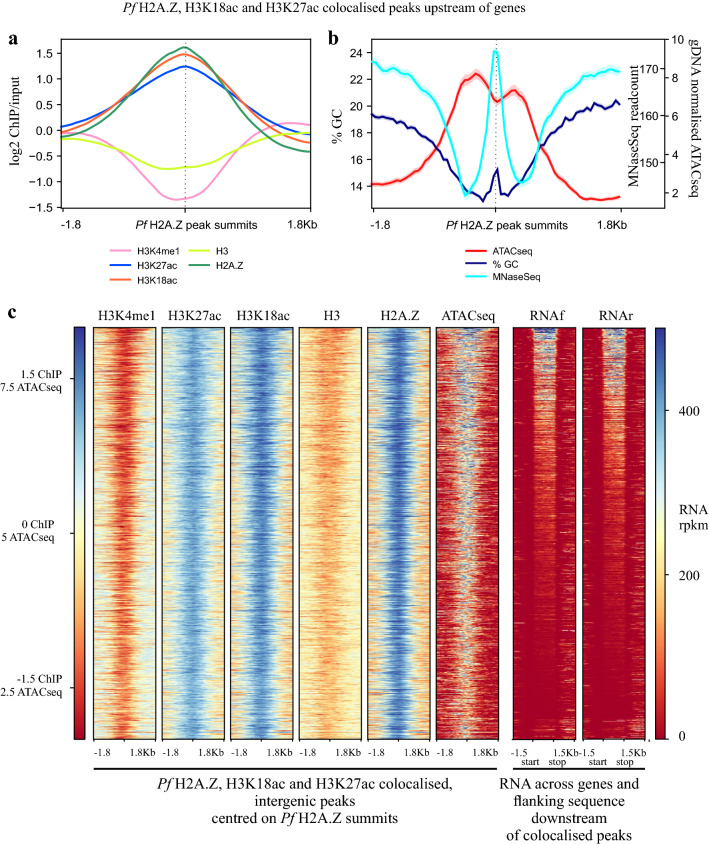
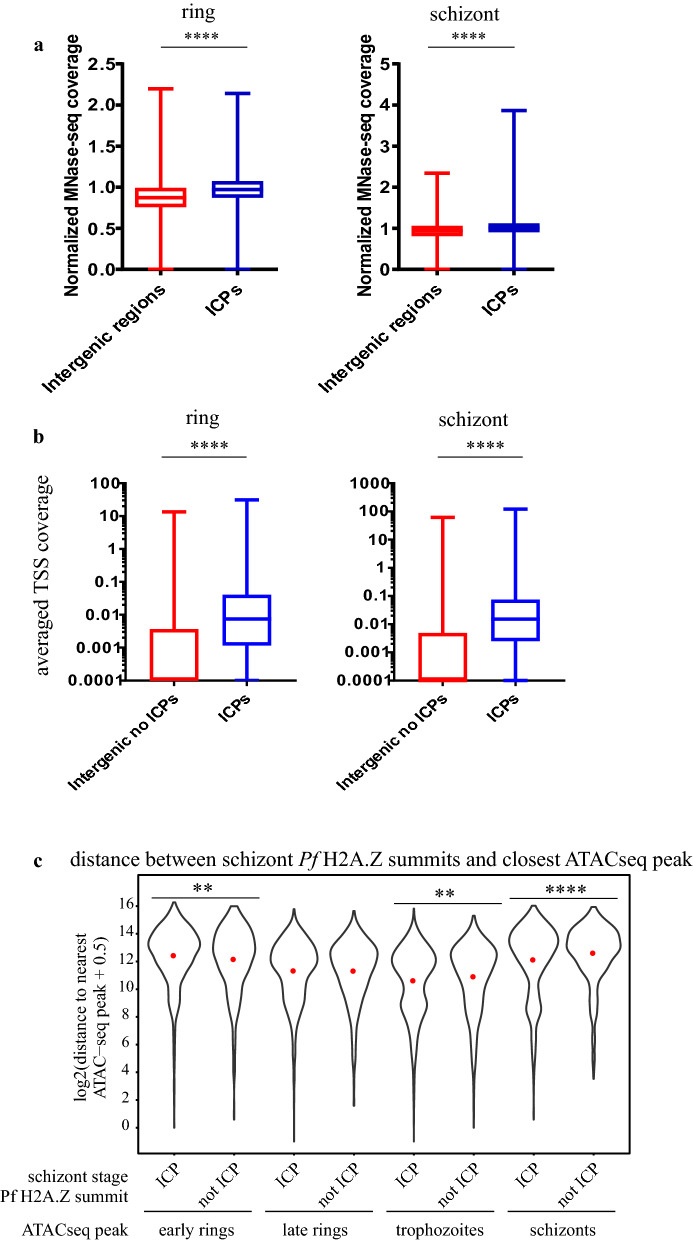
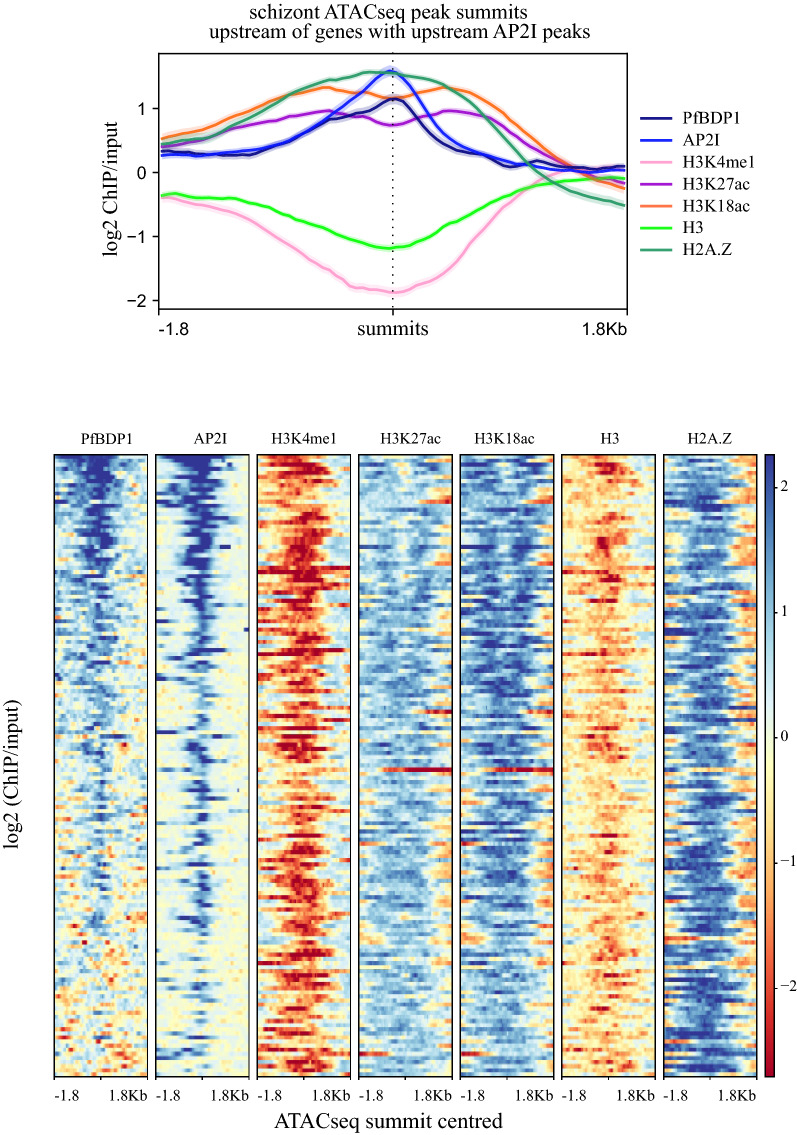
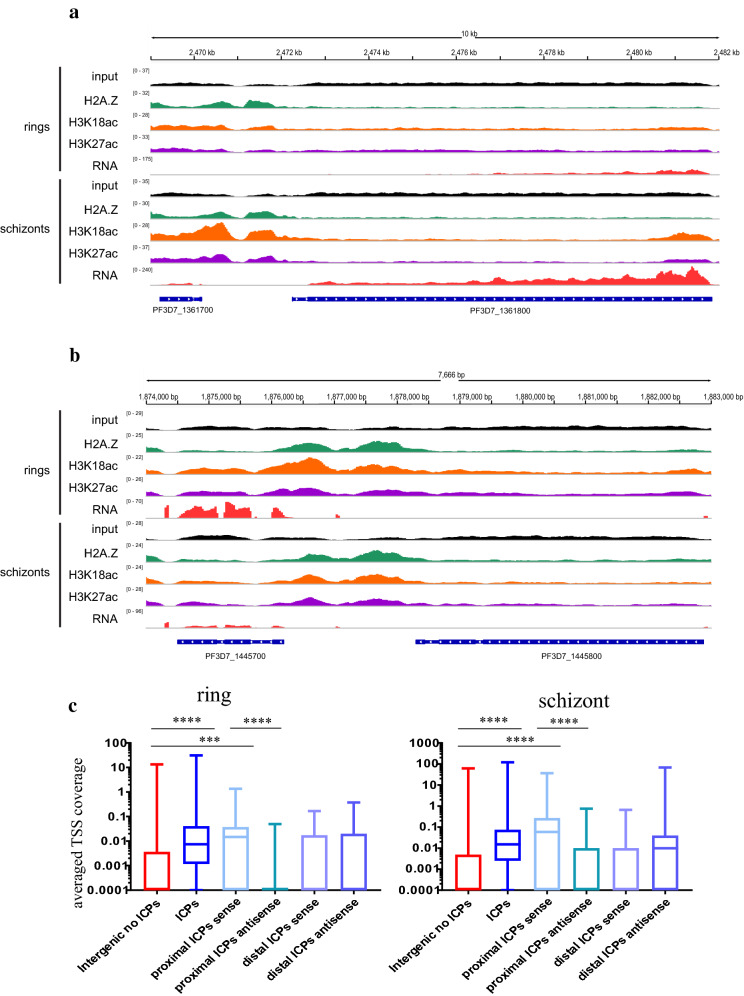
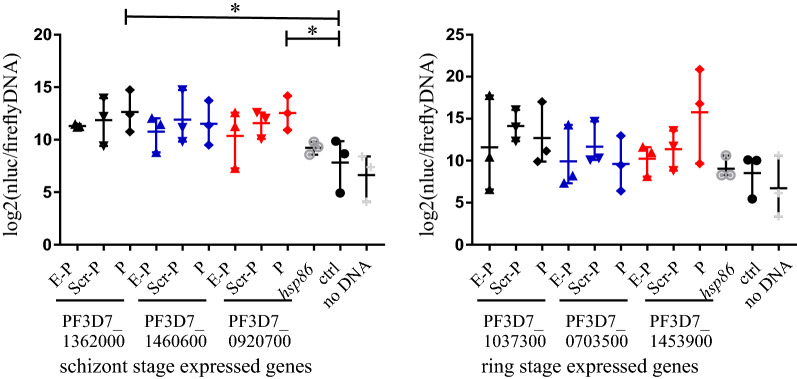
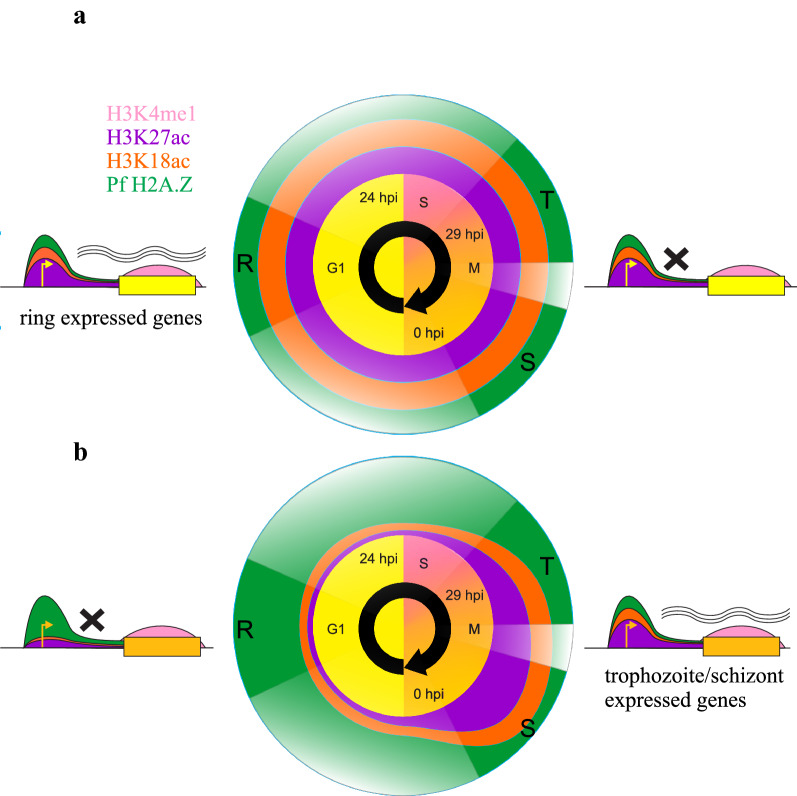
Results: Here, we show that the histone H3 acetylations H3K18ac and H3K27ac and the variant histone Pf H2A.Z are enriched together at regulatory sites upstream of genes. H3K18ac and H3K27ac together dynamically mark regulatory regions of genes expressed during the asexual life cycle. In contrast, H3K4me1 is depleted in intergenic sequence and dynamically depleted upstream of expressed genes. The temporal pattern of H3K27ac and H3K18ac enrichment indicates that they accumulate during S phase and mitosis and are retained at regulatory sequences until at least G1 phase and after cessation of expression of the cognate genes. We integrated our ChIPseq data with existing datasets to show that in schizont stages H3K18ac, H3K27ac and Pf H2A.Z colocalise with the transcription factor PfAP2-I and the bromodomain protein PfBDP1 and are enriched at stably positioned nucleosomes within regions of exposed DNA at active transcriptional start sites. Using transient transfections we showed that sequences enriched with colocalised H3K18ac, H3K27ac and Pf H2A.Z possess promoter activity in schizont stages, but no enhancer-like activity.

Conclusions: The dynamic H3 acetylations define P. falciparum regulatory sequences and contribute to gene activation. These findings expand the knowledge of the chromatin landscape that regulates gene expression in P. falciparum.

Keywords: Gene regulation; Histone modifications; Plasmodium falciparum.


Conflict of interest statement

The authors declare that they have no competing interests.

Figures

Fig. 1
Fig. 1
Distribution of histones and their modifications throughout the intra-erythrocytic developmental cycle. a Immunofluorescence assay shows that PfH3K18ac, PfH3K27ac and PfH3K4me1 localise to the nucleus of P. falciparum in ring-, trophozoite- and schizont-stages in the IDC. Bound antibody shown in green in the first row was specific for the histone modifications indicated at the bottom of the figure. DNA was stained blue with DAPI in the second row. Bright field microscopy shows the cell morphology in the fourth row. Scale bar is 5 μm. b P. falciparum H3K4me1, H3K18ac, H3K27ac and H2A.Z levels at 0–8 hpi, 8–16 hpi, 16–24 hpi, 24–32 hpi, 32–40 hpi and 40–48 hpi during the IDC. Cell morphology at the six time points when the parasite lysates were prepared is indicated on top. H3 levels were shown as the parasite lysate loading control
Fig. 2
Fig. 2
Enrichment profiles of histones and their modifications relative to transcriptional units. Average ± SE enrichment profiles (log2 ratio of ChIP over stage-matched input) of H2A.Z (dark green), H3K18ac (orange), H3K27ac (purple), H3K4me1 (pink) and H3 (pale green) plotted across all transcripts from the transcription start sites (TSSs) to the transcription end sites (TESs) with an extension of 2500 bp upstream and downstream in ring, trophozoite stage and schizont stages
Fig. 3
Fig. 3
Correlations between histones and their modifications and transcription. Log2 (ChIP/input) plotted from 2500 bp upstream (-2500) to 2500 bp downstream (2500) of the transcriptional start (TSS) and stop (TES) sites for all 7671 schizont-stage transcripts assembled by Cufflinks ranked in descending order by transcript abundance (fpkm). The Spearman correlation value (r) for the upstream and downstream enrichment of each histone or histone modification is indicated below the plots
Fig. 4
Fig. 4
Average enrichment profiles of chromatin features and RNA levels across intergenic, H3K4me1 peaks. Average profile plots ± SE covering 1.8 kb up and downstream of the summit of H3K4me1 intergenic peaks (n = 76) oriented according to the closest downstream gene. Top panel is the log2 ratio of ChIP over input average enrichment profiles of H3K4me1, H3K27ac, H3K18ac. H3 and Pf H2A.Z, all from this study and also log2 ratio of H3K4me3 ChIP over input from [38]. Middle panel is GC content and ATACseq normalised to gDNA and the bottom panel is RNA separated by strand
Fig. 5
Fig. 5
Comparison of enrichment profiles of histones and their modifications across genes dynamically expressed in rings and schizonts. Average log2 ratio of ChIP enrichment of Pf H2A.Z (green), H3K18ac (orange), H3K27ac (purple) and H3K4me1 (pink) all relative to ChIP enrichment of H3 plotted over the coding sequences ± 2500 bp of: gene set 1 (n = 478) that were expressed at least threefold more in schizont stage than in ring stage and that were in the top quartile by schizont-stage expression and: gene set 2 (n = 528) that were expressed at least threefold more in ring stage than in schizont stage and that were in the top quartile by ring-stage expression. 5′End: the start codon of a gene; 3′End: the stop codon of a gene
Fig. 6
Fig. 6
Intergenic, colocalised Pf H2A.Z, H3K18ac and H3K27ac mark well-positioned nucleosomes within a region of exposed DNA. a ChIP, b % GC, gDNA normalised ATACseq [41], MNaseSeq readcounts [43] and (c) ChIPseq, matched, stranded RNASeq rpkm and ATACseq plotted across the 2645 colocalised Pf H2A.Z, H3K18ac and H3K27ac schizont-stage intergenic peaks. The plot profiles and heatmaps are centred on the Pf H2A.Z peak summits. The heatmap was sorted in descending order of the schizont-stage RNAseq rpkm of the closest downstream gene
Fig. 7
Fig. 7
Intergenic, colocalised peaks of Pf H2A.Z, H3K18ac and H3K27ac compared to other intergenic regions have increased nucleosomal occupancy and increased density of TSSs and are closer to regions of exposed DNA. a Per site normalised P. falciparum MNase-seq read coverage [43] from ring stages (15 h post-invasion) and schizont stages (40 h post-invasion) plotted across all 5567 intergenic regions and across the 2197 ring stage and 2645 schizont stage intergenic, colocalised H2A.Z, H3K18ac and H3K27ac ChIP peaks. Whiskers are minimum and maximum values. Mann Whitney U test ****p < 0.0001. b Average, stranded, P. falciparum TSS tag coverage at 10 and 42 h post-invasion [42] at ICPs and at all other intergenic regions. (Mann–Whitney U test **** p < 0.0001). c Distance between ATACseq peaks [40] in early rings, late rings, trophozoites or schizonts and schizont-stage Pf H2A.Z summits of colocalised, intergenic peaks (ICP) or schizont-stage Pf H2A.Z, intergenic summits that did not colocalise with H3K18ac or H3K27ac peaks (not ICP), t test **** p < 0.0001, ** p < 0.01
Fig. 8
Fig. 8
H3K18ac and H3K27ac flank sequences bound by AP2-I and enriched in Pf H2A.Z and PfBDP1. The 151 ATACseq peaks that were closest to, and upstream of, the 151 genes that also had upstream AP2-I and PfBDP1 peaks. ATACseq peak average length was 675 bp. Plots are log2 ChIP/input centred on ATACseq peak summits. Profile plots are average values with standard error of mean shaded. Heatmaps were all sorted by descending level of PfBDP1 enrichment
Fig. 9
Fig. 9
Tandem, intergenic colocalised peaks upstream of expressed genes have characteristics of regulatory sequences. Mapped reads normalised for mapped library size from concatenated replicates of input DNA and ChIP of Pf H2A.Z, H3K18ac and H3K27ac and from matched RNAseq for schizont and ring stages. Mapped reads are plotted over the preceding gene, the upstream intergenic sequence and a gene (a) in the forward orientation and expressed in schizont stages and (b) in the reverse orientation and expressed in ring stages. c As per Fig. 7b) Average, stranded, P. falciparum TSS tag coverage at 10 and 42 h post-invasion [42] at ICPs, all other intergenic regions and gene-proximal and distal ICPs from tandem pairs of ICPs. For this comparison the proximal and distal ICPs were defined as ± 50 bp from the colocalized H2A.Z peak summit. Kruskal–Wallis test showed significant variation across all categories in both rings and schizonts (p < 0.0001), shown are P values for post hoc comparisons (Dunn’s multiple comparisons test) **** p < 0.0001, ** P < 0.001
Fig. 10
Fig. 10
Transient transfections to detect whether intergenic colocalised peaks have gene regulatory activity. Shown are Log2 transformed nanoluciferase luminescence normalised to levels of firefly luciferase DNA and parasite genome copy number detected by qPCR. Each transfected plasmid encoded nanoluciferase with its transcription driven by upstream sequences consisting of: the putative enhancer upstream of the putative promoter (E-P); a scrambled version of the PF3D7_1362000 putative enhancer upstream of the putative promoter (Scr-P); the putative promoter alone (P); the hsp86 promoter (hsp86); an AT-matched intergenic control sequence that had no regulatory effect on neighbouring genes during the asexual lifecycle (ctrl) and a mock transfection control (no DNA). ANOVA with post hoc Sidak’s multiple comparisons test of the AT-matched control sequence to each of the putative promoter-alone constructs and the hsp86 promoter alone. *p < 0.05. Bars are the means, whiskers are the ranges
Fig. 11
Fig. 11
Proposed model of Pf H2A.Z, H3K4me1, H3K18ac and H3K27ac dynamics across transcriptional units throughout the intra-erythrocytic developmental cycle. Enrichment patterns of Pf H2A.Z (green), H3K18ac (orange), H3K27ac (purple) and H3K4me1 (pink) throughout the IDC at genes expressed in ring stages or in trophozoites/schizonts. The positions of enrichment of Pf H2A.Z and the H3 modifications are indicated on the models of genes expressed in ring (a) stages during G1 (yellow genes) or (b) in trophozoites and schizonts during asynchronous S phase and mitosis (M) (tan genes). The temporal profiles of abundance of Pf H2A.Z, H3K18ac and H3K27ac at the promoters of genes expressed in (a) ring stages or (b) trophozoites and schizonts are indicated as coloured concentric circles interpolated onto the full cell cycle. Distortions in the concentric circles indicate relative abundance of the histones (modifications) in those periods. The model was interpolated from the ChIPseq experiments conducted on parasites spanning 6-h windows indicated by solid-coloured wedges at 8–14 hpi, rings (R), 30–36 hpi trophozoites (T) and 38–44 hpi schizonts (S). The profiles in the transparent wedges were inferred but are unknown, particularly whether abundance of the H3 acetylations decreased at promoters of ring stage-expressed genes between 14 and 30 hpi

Similar articles

Cited by

References

    1. Gardner MJ, Hall N, Fung E, White O, Berriman M, Hyman RW, et al. Genome sequence of the human malaria parasite Plasmodium falciparum. Nature. 2002;419:498–511. doi: 10.1038/nature01097. - DOI - PMC - PubMed
    1. Miao J, Fan Q, Cui L, Li J. The malaria parasite Plasmodium falciparum histones: organization, expression, and acetylation. Gene. 2006;369:53–65. doi: 10.1016/j.gene.2005.10.022. - DOI - PubMed
    1. Salcedo-Amaya AM, van Driel MA, Alako BT, Trelle MB, van den Elzen AM, Cohen AM, et al. Dynamic histone H3 epigenome marking during the intraerythrocytic cycle of Plasmodium falciparum. Proc Natl Acad Sci U S A. 2009;106:9655–9660. doi: 10.1073/pnas.0902515106. - DOI - PMC - PubMed
    1. Silberhorn E, Schwartz U, Loffler P, Schmitz S, Symelka A, de Koning-Ward T, et al. Plasmodium falciparum nucleosomes exhibit reduced stability and lost sequence dependent nucleosome positioning. PLoS Pathog. 2016;12:e1006080. doi: 10.1371/journal.ppat.1006080. - DOI - PMC - PubMed
    1. Bozdech Z, Llinas M, Pulliam BL, Wong ED, Zhu J, DeRisi JL. The transcriptome of the intraerythrocytic developmental cycle of Plasmodium falciparum. PLoS Biol. 2003;1:85–100. doi: 10.1371/journal.pbio.0000005. - DOI - PMC - PubMed

Publication types

MeSH terms