. 2020 Nov 23:9:e60188.
doi: 10.7554/eLife.60188.

Combined transient ablation and single-cell RNA-sequencing reveals the development of medullary thymic epithelial cells

Affiliations

Combined transient ablation and single-cell RNA-sequencing reveals the development of medullary thymic epithelial cells

Kristen L Wells et al. Elife. .

Abstract

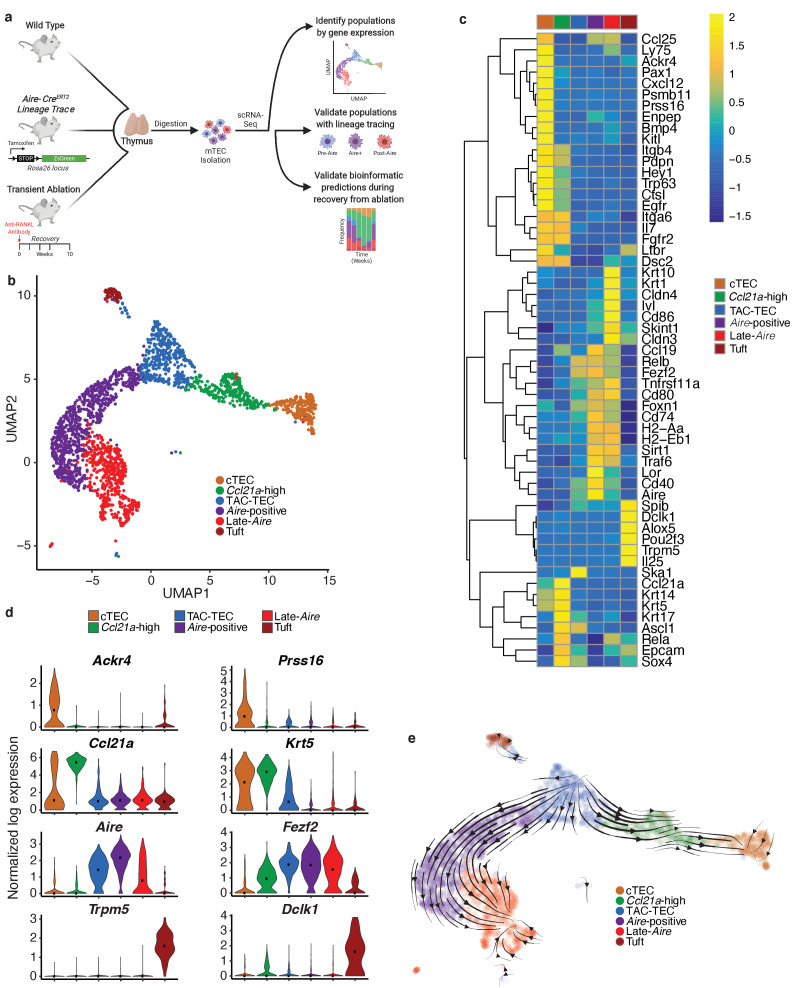
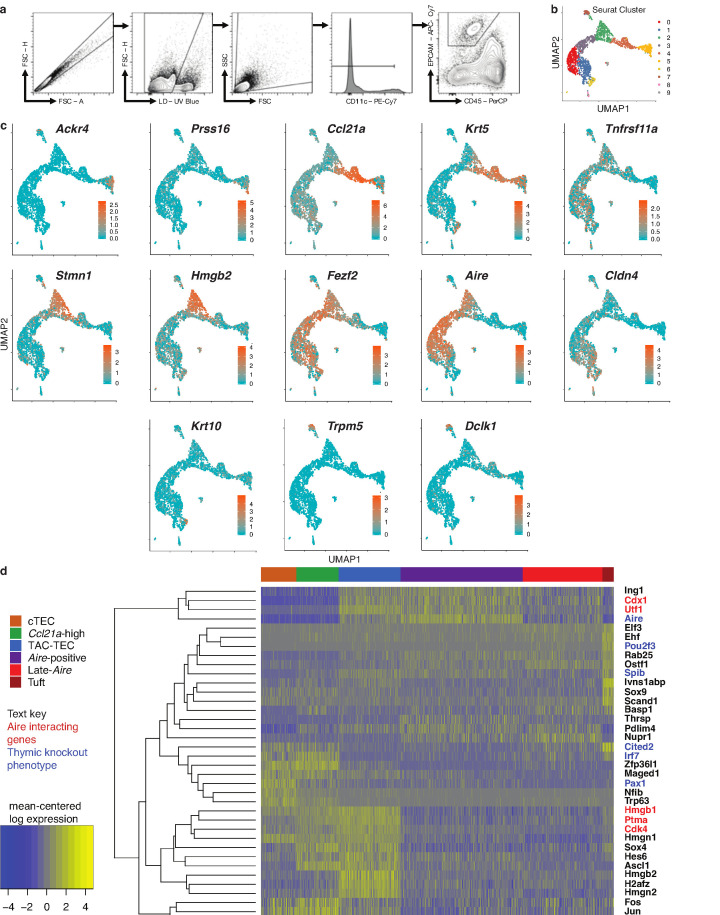
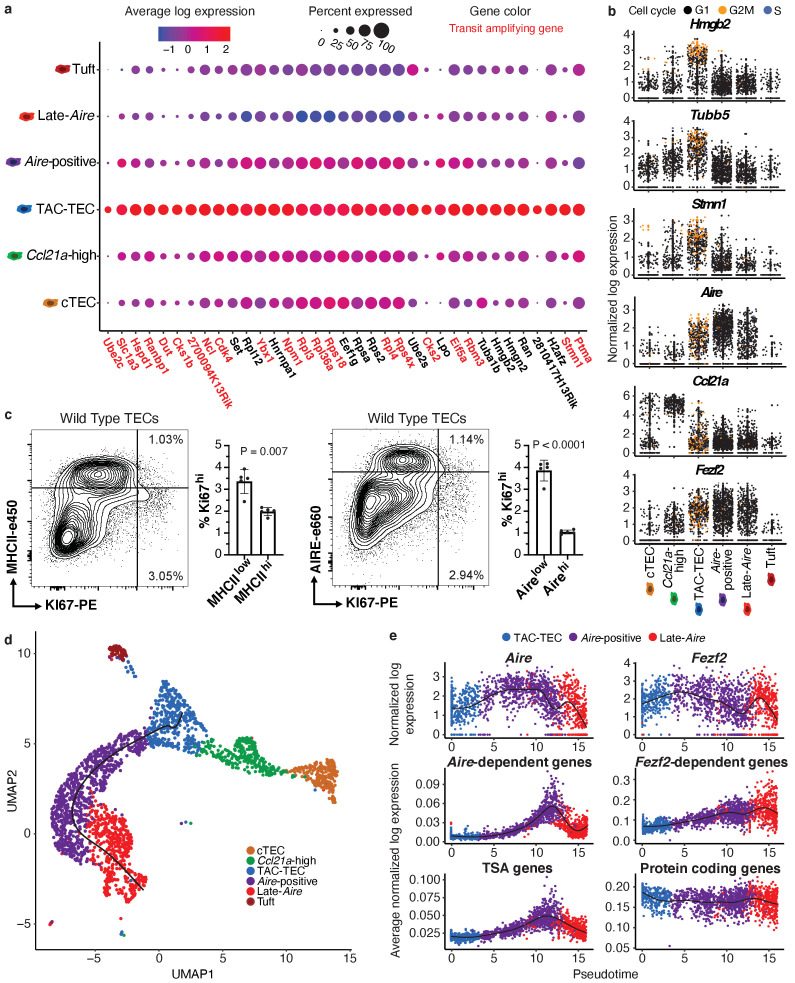
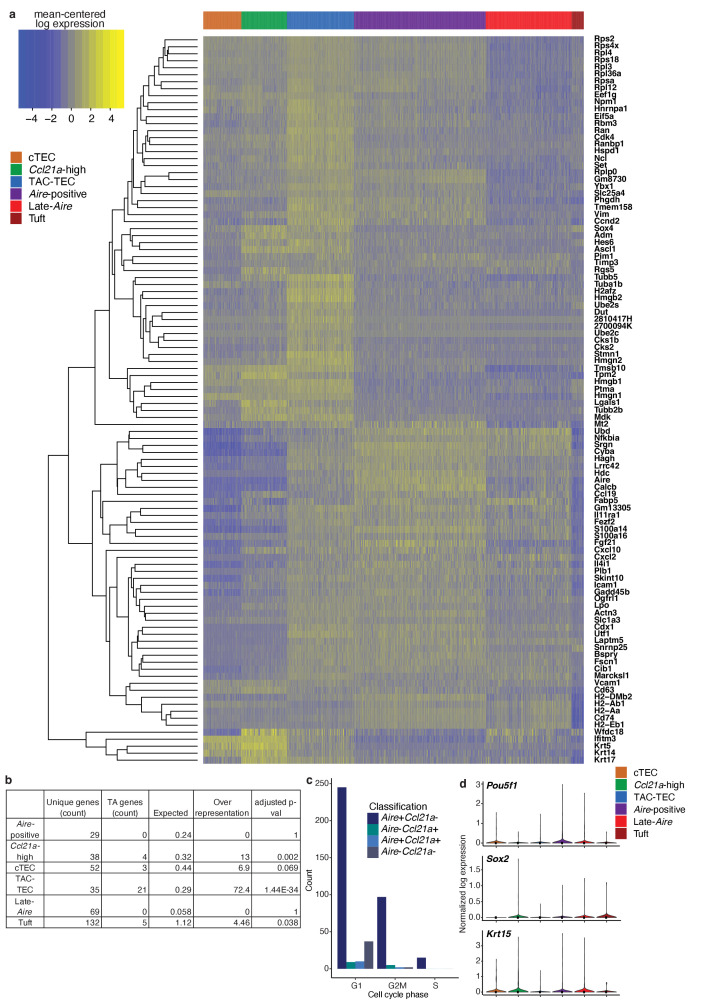
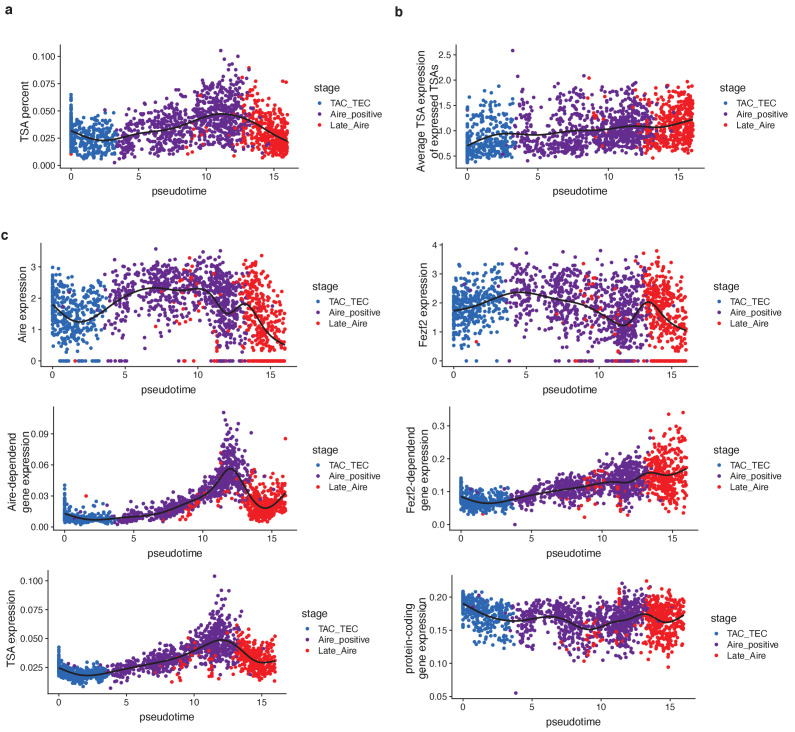
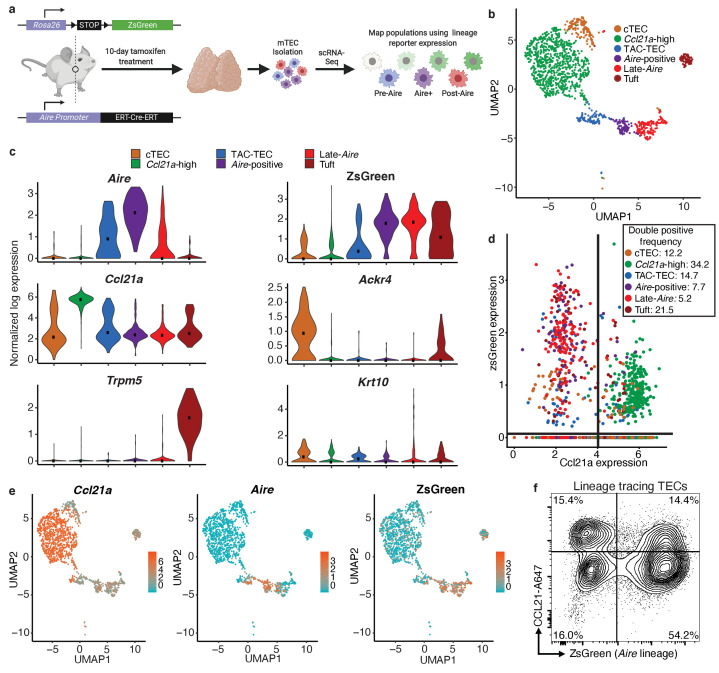
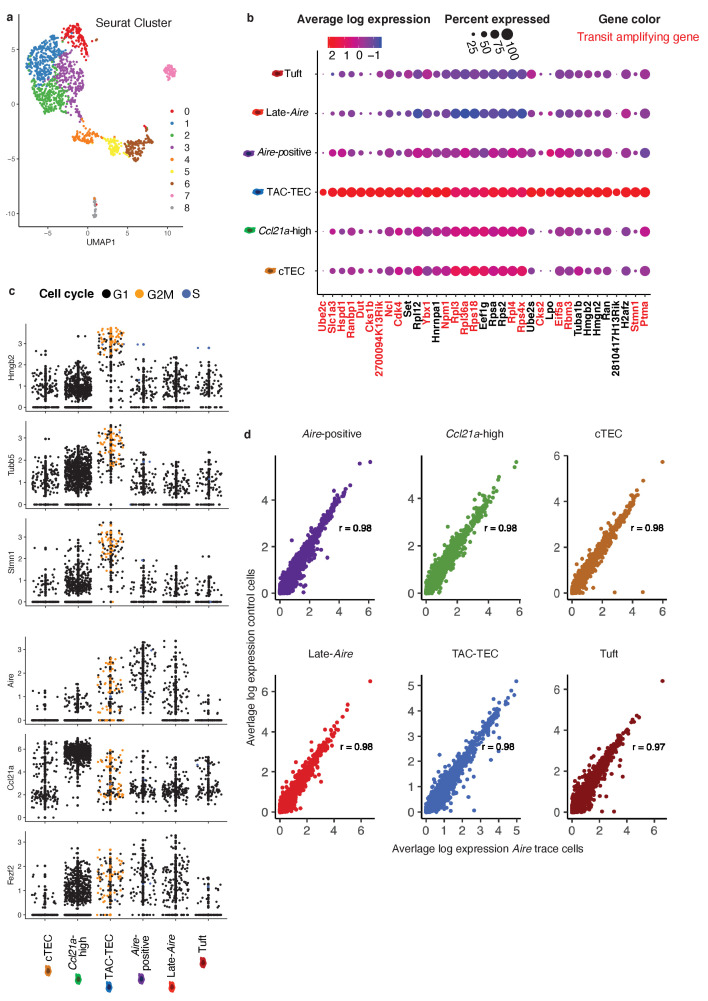
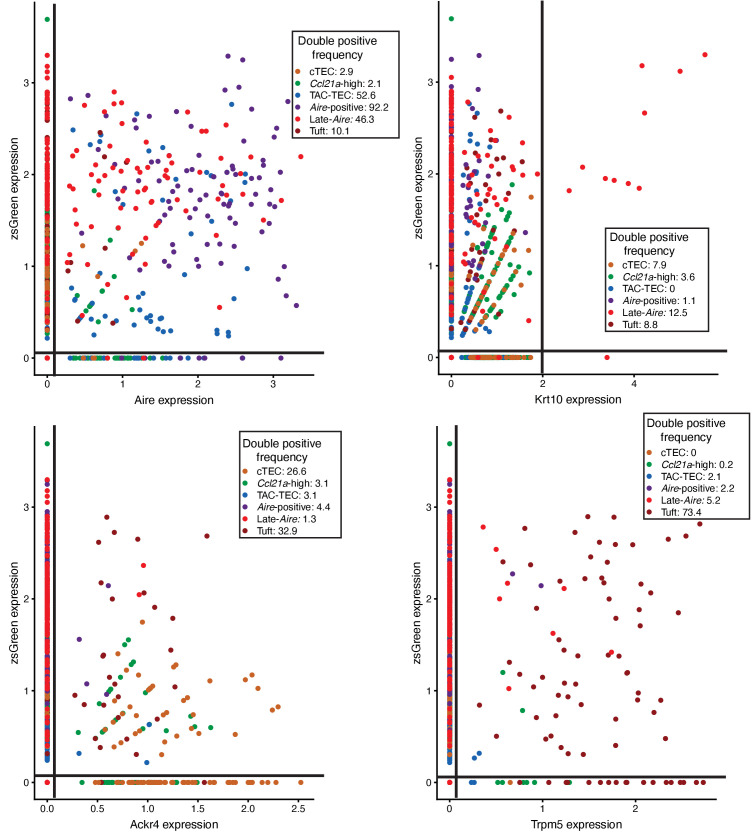
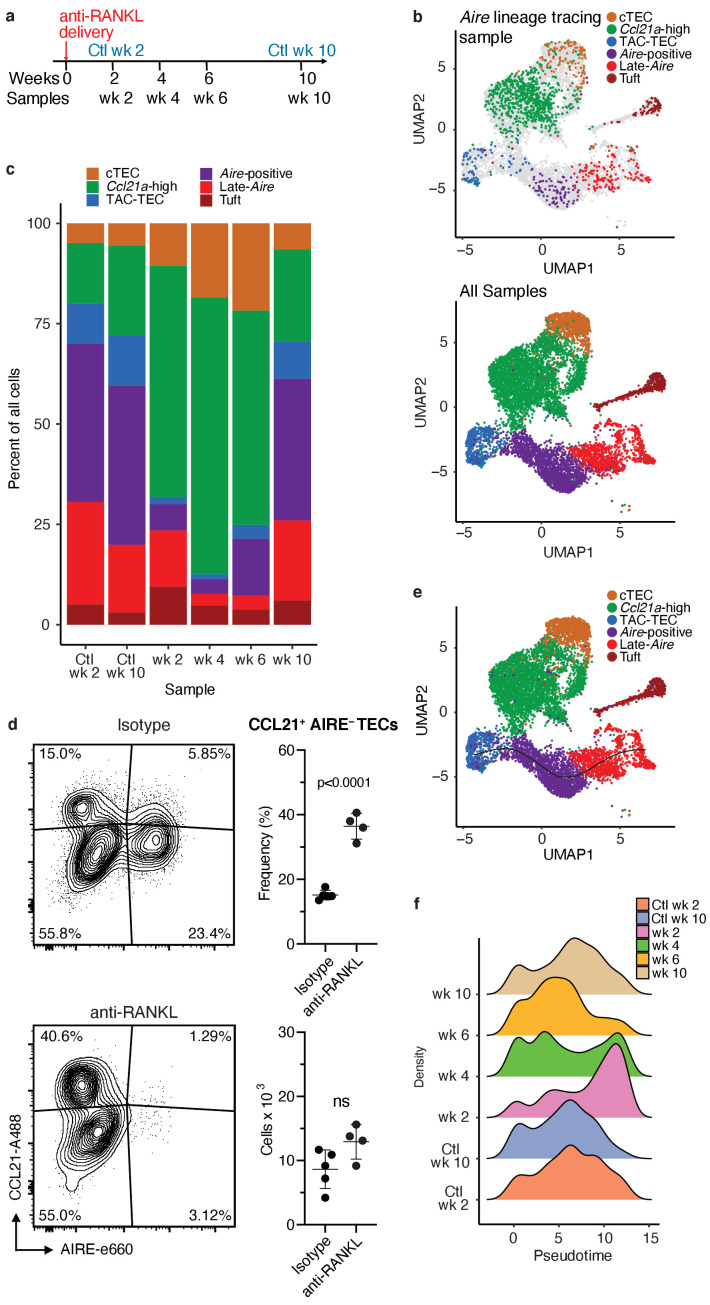
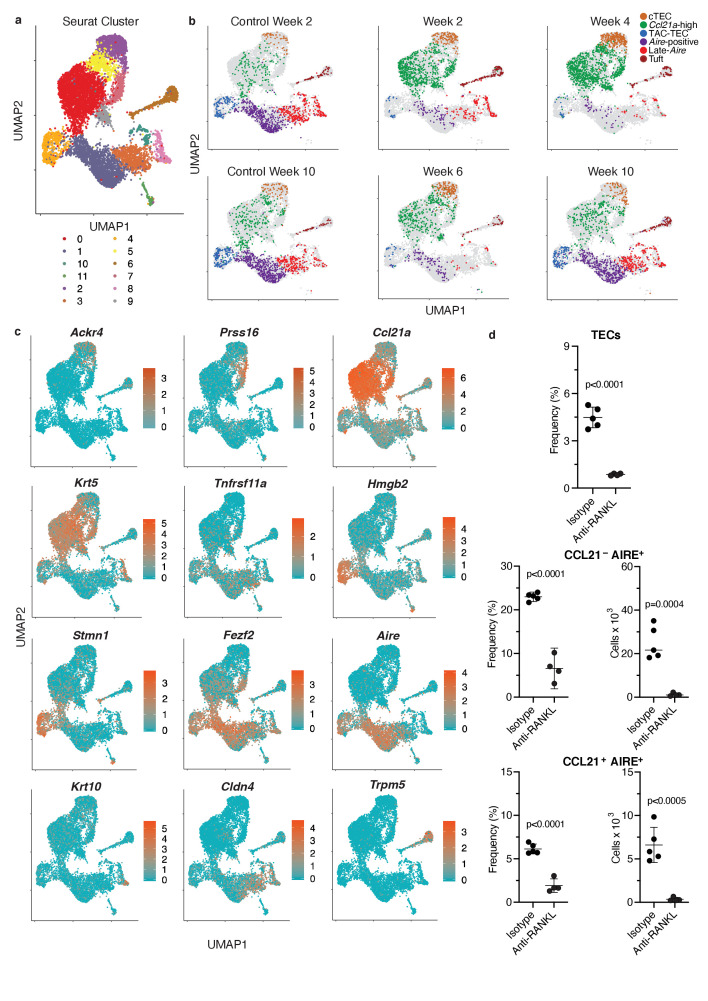
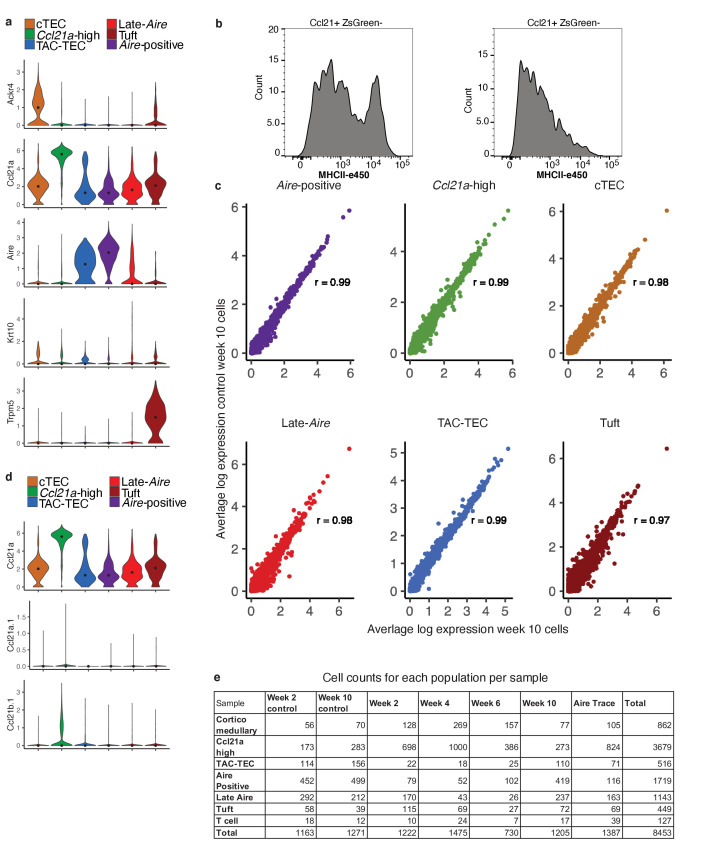
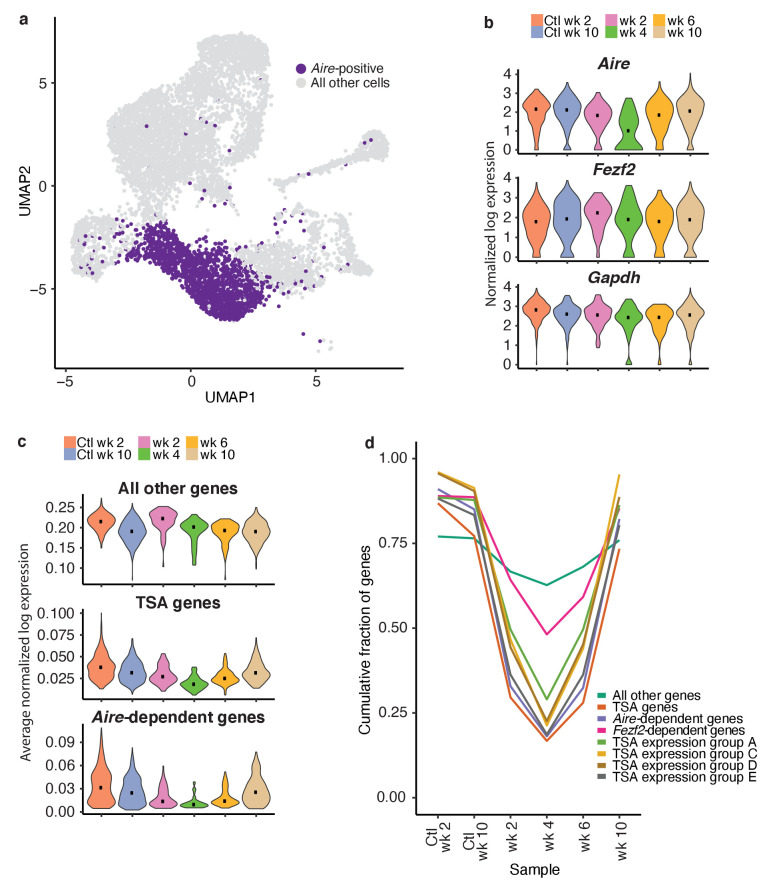
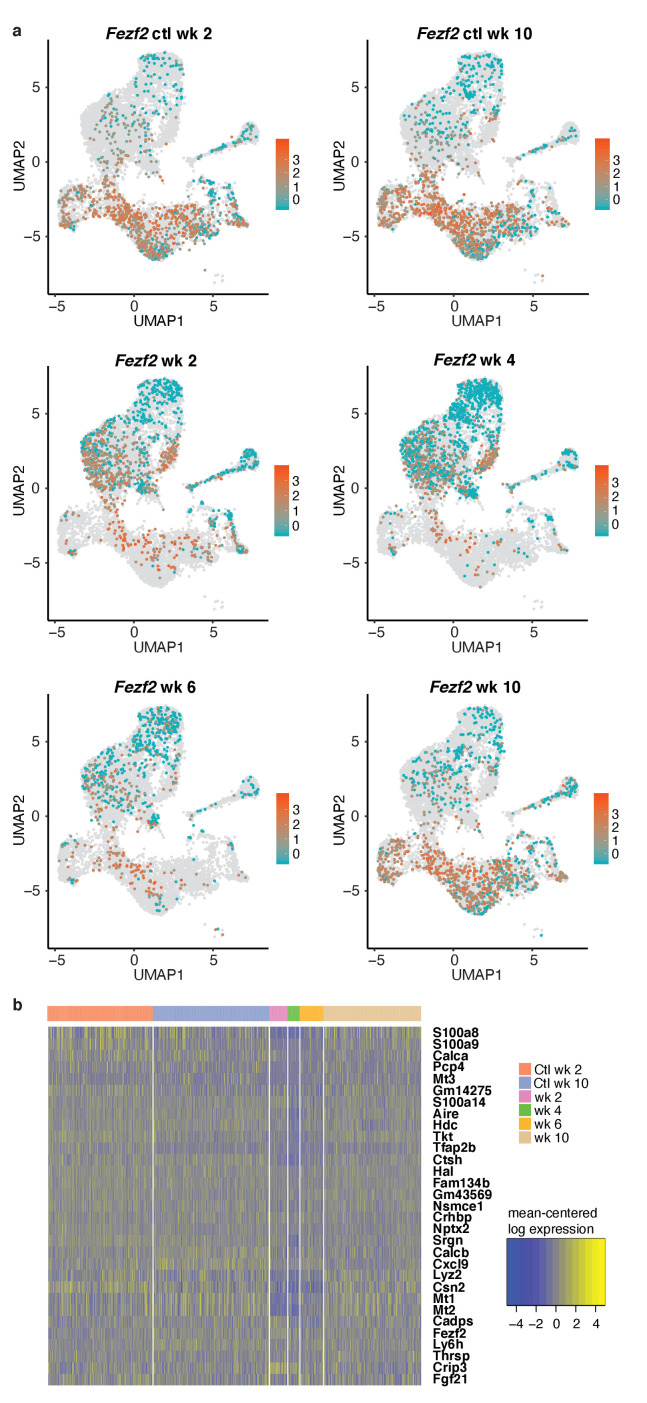
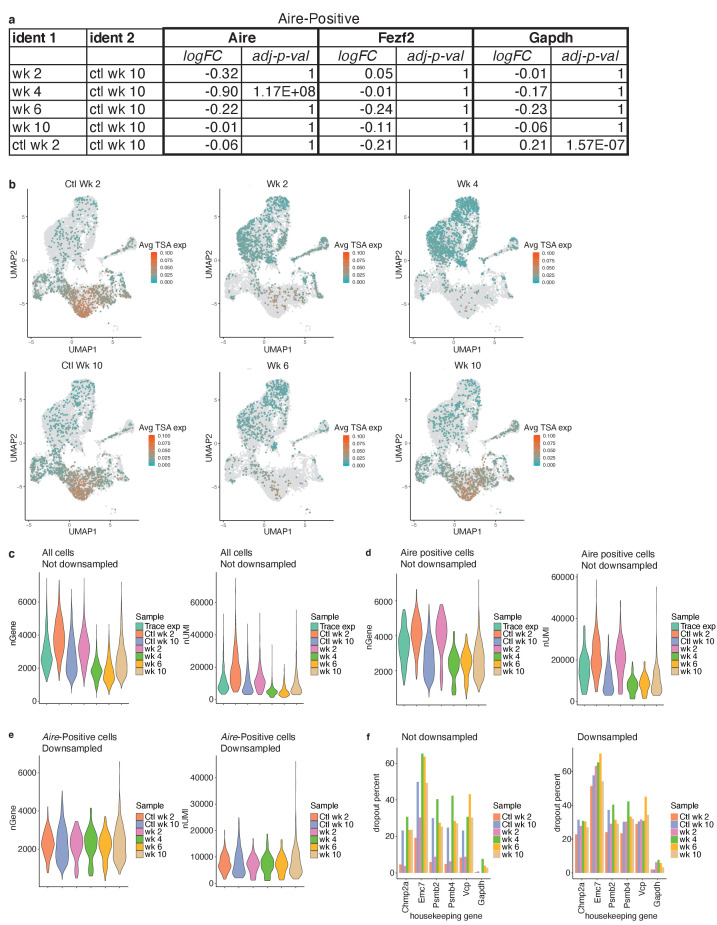
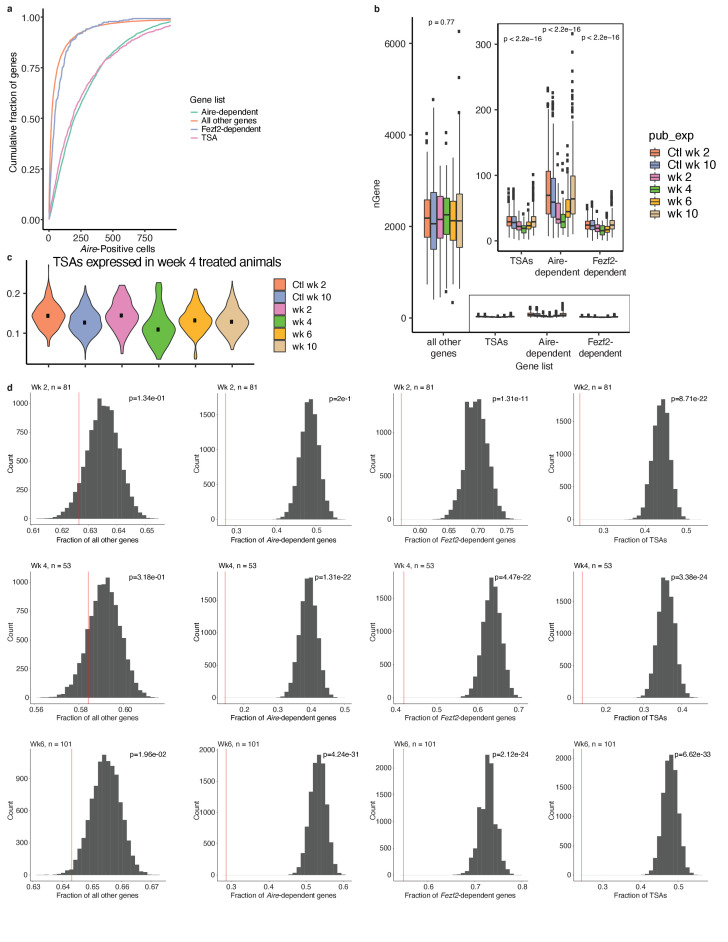
Medullary thymic epithelial cells (mTECs) play a critical role in central immune tolerance by mediating negative selection of autoreactive T cells through the collective expression of the peripheral self-antigen compartment, including tissue-specific antigens (TSAs). Recent work has shown that gene-expression patterns within the mTEC compartment are heterogenous and include multiple differentiated cell states. To further define mTEC development and medullary epithelial lineage relationships, we combined lineage tracing and recovery from transient in vivo mTEC ablation with single-cell RNA-sequencing in Mus musculus. The combination of bioinformatic and experimental approaches revealed a non-stem transit-amplifying population of cycling mTECs that preceded Aire expression. We propose a branching model of mTEC development wherein a heterogeneous pool of transit-amplifying cells gives rise to Aire- and Ccl21a-expressing mTEC subsets. We further use experimental techniques to show that within the Aire-expressing developmental branch, TSA expression peaked as Aire expression decreased, implying Aire expression must be established before TSA expression can occur. Collectively, these data provide a roadmap of mTEC development and demonstrate the power of combinatorial approaches leveraging both in vivo models and high-dimensional datasets.

Keywords: genetics; genomics; immune system; immunology; inflammation; medullary thymic epithelial cell; mouse; single-cell transcriptomics.

Plain language summary

Specialized cells in the immune system known as T cells protect the body from infection by destroying disease-causing microbes, such as bacteria or viruses. T cells use proteins on their surface called receptors to stick to infectious microbes and remove them from the body. Some newly developed T-cells, however, contain receptors that recognize and bind to cells that belong in the body. If these faulty T cells are released, they can attack healthy tissues and cause an autoimmune disease. After a new T cell is developed, it gets carried to a gland in the chest known as the thymus. Cells in the thymus called mTECs screen T cells for receptors that may bind to the body’s tissues. mTECs do this by presenting T cells with proteins that are commonly found on the surface of healthy cells in the body. If a T cell recognizes any of these ‘tissue specific proteins’, it is destroyed or given a new role in the body. Some faulty T cells, however, still manage to evade detection. One way to uncover why this might happen is to investigate how mTECs develop. Previous work showed that mTECs transition through various stages before reaching their final form. However, the order in which these events occur remained unclear. To gain a better understanding of these developmental steps, Wells, Miller et al. extracted mTECs from the thymus of mice and analyzed the genetic make-up of individual cells. This uncovered a missing link in mTEC development: a new type of cell that is the immediate predecessor of the final mTEC. These ‘predecessor’ cells were actively growing, highlighting that mTECs can be constantly generated in the body. By probing the genes that generate tissue-specific proteins in mTECs, Wells, Miller et al. revealed that these proteins were only produced for short periods and in the late stages of mTEC development. These findings contribute to our understanding of how mTECs develop to screen T cells. Mapping these developmental stages will make it easier to identify when faulty T cells are able to evade mTECs. This will lead to earlier detection of autoimmune diseases which could result in better treatments.


Conflict of interest statement

KW, CM, AG, WW, JP, MA, LS No competing interests declared

Figures

Figure 1.
Figure 1.. Single-cell sequencing of medullary thymic epithelial cells reveals population relationships.
(A) Outline of experimental design. Lineage relationships were first determined bionformatically from single-cell RNA-sequencing of control thymus. Lineage relationships and gene-expression events were then validated using both an inducible in vivo lineage tracing system and a model of transient thymus ablation and recovery. (B) UMAP visualization of all 2434 cells and clustering (color) of mTECs (two replicates, three pooled thymi each). Each point represents a cell. (C) Heatmap of genes curated from the literature across mTEC populations identified in this study. Color is mean-centered, log-normalized expression. Gene expression is the average expression within each mTEC population. (D) Normalized log expression of marker genes for known mTEC populations across cells in each cluster. Color represents cluster, black dot is median expression. (E) Single-cell velocity plot showing lineage relationships between mTECs projected onto a UMAP dimensional reduction. Arrows represent predicted developmental trajectories. See also Figure 1—figure supplement 1.
Figure 1—figure supplement 1.
Figure 1—figure supplement 1.. Classification of medullary thymic epithelial cell populations.
(A) Representative sorting strategy to isolate TECs. (B) UMAP dimensional reduction visualization of the thymic epithelial cells. Color represents original Seurat cluster. Some clusters were merged based on gene expression. Clusters 8 and 9 represent t-cells and were removed from the remainder of the analysis. (C) UMAP dimensional reduction visualization of the thymic epithelial cells. Color represents normalized log expression of marker genes for mTEC populations. Each point represents a cell. (D) Heatmap of all transcription factors and histone proteins differentially expressed between populations (adj-p-val<0.05 and log|fold change| > 2). High expression: yellow; low expression: blue. Aire interacting genes: red; knockout phenotype: blue. Cells organized by population, genes organized by hierarchical cluster.
Figure 2.
Figure 2.. Characterization of TAC-TECs and developmental dynamics from this population.
(A) Summary dot plot of expression of genes differentially upregulated uniquely in the TAC-TEC population (adj-p-val<0.05 and log|fold change| > 2) across mTEC populations. Red text color represents genes previously associated with transit-amplifying cells, DE genes were enriched for transit-amplifying genes (p=1.44×10⁻³⁴). Color indicates average expression and size indicates percent of cells expressing the transcript. (B) Normalized log expression of selected cell-cycle genes, chromatin modifiers, and genes important for mTEC function. Colors represent cell-cycle state. (C) Flow-cytometric analysis of mTEC (AIRE and MHCII) vs a cell-cycle (KI67) markers (three pooled thymi per replicate, n = 5 replicates). Bar plots represent percentages of cells positive for Ki67 for each population (data are mean ±s.d. n = 5 mice). (D) Predicted pseudotime line (slingshot algorithm) depicting developmental trajectory exclusively for cells in the Aire branch. (E) Expression patterns of genes (log expression) and gene sets (average log expression) for cells in the Aire branch of development across pseudotime (see E). Color represents population. See also Figure 2—figure supplements 1 and 2.
Figure 2—figure supplement 1.
Figure 2—figure supplement 1.. Characterization of TAC-TEC Population.
(A) Heatmap of all genes differentially upregulated in the TAC-TEC population compared to other populations (adj- p-val <0.05, and log fold change >2). High expression: yellow; low expression: blue. Cells organized by population, genes organized by hierarchical cluster. (B) Over representation of transit-amplifying genes in all identified mTEC populations. Adjusted p-value was calculated using a hypergeometric test. (C) Counts of cells expressing Aire and/or Ccl21a for each sample in the TAC-TEC population separated based on cell-cycle status. Color relates to which genes are expressed. (D) Normalized log expression of stem cell marker across cells in each cluster. Color represents cluster, black dot is median expression.
Figure 2—figure supplement 2.
Figure 2—figure supplement 2.. TSAs are expressed late in pseudotime.
(A) The percent of TSAs expressed as a function of pseudotime (from Figure 2E). Color represents population. (B) The average expression of only expressed TSAs as a function of pseudotime (from Figure 2E). Color represents population. (C) Expression patterns of genes (log expression) and gene sets (average log expression) for cells in the Aire branch of development across psuedotime after the analysis was repeated without using TSAs in the list of ordering genes. Color represents population.
Figure 3.
Figure 3.. Aire–lineage tracing identifies immediate precursors of Aire-positive cells.
(A) Outline of Aire–lineage trace experiment. Aire–lineage tracing mice were treated with Tamoxifen for 10 days. Thymi were then isolated, FACS-purified, and subjected to single-cell RNA-seq using 10x Genomics. In lineage trace mice, any cell that has ever expressed Aire will express ZsGreen. (B) UMAP visualization of all 1387 cells and clustering (color) of cells from the Aire lineage tracing mouse (three pooled thymi). Each point represents a cell. (C) Normalized log expression of marker genes for known mTEC populations across cells in each cluster. Color represents cluster, black dot is median expression. (D) zsGreen expression vs Ccl21a expression across all mTEC populations. Lines indicate values used to determine positive expresssion (0 for zsGreen, four for Ccl21a). Color represents population, axes are log-normalized expression. The frequency of double positive cells within each population is indicated in the key. Frequencies for the other three quadrants can be found in Supplementary file 1. (E) UMAP dimensional reduction visualizations of the Aire lineage tracing cells. Color represents normalized log expression of Ccl21a, Aire, and ZsGreen for mTEC populations. Each point represents a cell. (F) Flow-cytometric analysis of intracellular CCL21 staining vs the Aire–lineage marker ZsGreen (three pooled thymi). See also Figure 3—figure supplements 1, 2 and 3.
Figure 3—figure supplement 1.
Figure 3—figure supplement 1.. Classification of Aire lineage tracing cells.
(A) UMAP dimensional reduction visualization of the thymic epithelial cells. Color represents original Seurat cluster. Some clusters were merged based on gene expression. Cluster 8 represents t-cells and was removed from the remainder of the analysis. (B) Dot plot of genes from Figure 2a across mTEC populations. Color indicates average expression and size indicates percent of cells expressing the transcript. Text color indicates genes previously seen in transit-amplifying cells. (C) Normalized log expression of selected cell-cycle genes, chromatin modifiers, and genes important for mTEC function. Colors represent cell-cycle state. (D) Correlation plots of the Aire lineage tracing cells vs. control cells within each mTEC population. Each point represents a gene. Average expression of each gene was computed across all cells within each population. Color indicates cluster. Pearson’s correlation is shown.
Figure 3—figure supplement 2.
Figure 3—figure supplement 2.. Characterization of ZsGreen in mTEC populations.
Plots of ZsGreen expression against population specific genes (Aire, Krt10, Ackr4, Trpm5) across all mTEC populations. Lines indicate values used to determine positive expression (zsGreen: 0, Aire: 0, Krt10: 2, Ackr4: 0, Trpm5: 0). Color represents population, axes are log-normalized expression. The frequency of double positive cells within each population is indicated in the key. Frequencies for the other three quadrants can be found in Supplementary file 1.
Figure 3—figure supplement 3.
Figure 3—figure supplement 3.. Classification of the CCL21 population by flow cytometry.
(A) MHCII surface expression within the CCL21+ ZsGreen+ gated population. (B) MHCII surface expression within the CCL21+ZsGreen- gated population. (C) Analysis of CCL21 protein expression with and without a permeabilization step. Flow performed without permeabilization was used as a control to determine if the CCL21 population was detected internally or externally in mTECs.
Figure 4.
Figure 4.. Treatment with anti-RANK ligand decreases the relative size of the entire Aire-expressing mTEC population.
(A) Overview of the experimental protocol. Anti-RANKL was given over the course of a week, and thymi were sequenced at weeks 2, 4, 6, and 10 following treatment. Isotype control thymi were also sequenced at weeks 2 and 10. 3 thymi were pooled for all samples. (B) UMAP projections of all 8453 cells from all samples. Top: color represents original Aire trace identity (see Figure 1), gray represents all other samples. Bottom: color represents inferred population labels. Identity of cells in all samples was inferred from the original identity of Aire lineage tracing cells. (C) Proportions of cells in each population for each sample. Color is cell population. (D) Flow-cytometric analysis of the Ccl21a population at week four following treatment with anti-RANKL and an age-matched isotype control mouse (two pooled thymi per replicate, n = 4 replicates for treatment, n = 5 for controls). Plots show the proportion of all TECs in the CCL21 population and the absolute number of cells in the CCL21 population for the anti-RANKL treated and isotype control samples (data are mean ± s.d.). (E) Predicted pseudotime line (slingshot algorithm) depicting developmental trajectory for cells from all samples in exclusively the Aire branch. (F) Density plots of cells in the Aire branch of development across pseudotime (see E) for each sample. Color represents sample. See also Figure 4—figure supplements 1, 2 and 3.
Figure 4—figure supplement 1.
Figure 4—figure supplement 1.. Classification of cell populations following treatment with anti- RANKL.
(A) UMAP dimensional reduction visualization all cells from all samples. Color represents Seurat cluster. Cluster 11 was t-cells and was removed. (B) UMAP dimensional reduction visualizations for each sample. Color represents population for the indicated sample. Each point represents a cell; gray points are all other samples. (C) UMAP dimensional reduction visualizations all samples. Color indicates normalized log expression of marker genes for mTEC populations. (D) Flow-cytometric analysis of KI67-expressing cells at week four following treatment with anti-RANKL and an age-matched isotype control mouse (two pooled thymi per replicate, n = 4 replicates for treatment, n = 5 for controls). Plots show absolute number of TECs, frequency and absolute number of CCL21-AIRE+ TECs, and frequency and absolute number of CCL21+AIRE+ TECs in anti- RANKL treated and isotype control samples (data are mean +/- sd).
Figure 4—figure supplement 2.
Figure 4—figure supplement 2.. Classification of cells following anti-RANKL treatment.
(A) Normalized log expression of marker genes for known mTEC populations across cells from all samples in each cluster. Color represents cluster, black dot is median expression. (B) MHCII surface expression within the CCL21+ZsGreen- gated population. (C) Correlation plots of the week 10 control vs. week-10 treatment within each mTEC population. Each point represents a gene. Average expression of each gene was computed across all cells within each population. Color indicates cluster. Pearson’s correlation is shown. D Normalized log expression of other Ccl21 genes (Ccl21b and Ccl21a.1, Ccl21a included for reference) across all samples. Color represents cluster, black dot is median expression. (E) The number of cells from each sample in each population.
Figure 4—figure supplement 3.
Figure 4—figure supplement 3.. Gene-expression patterns across experiments.
Heatmaps of expression patterns of marker genes of the control populations across all experiments. Gene lists (including gene order) are identical in each heatmap. The x axis represents cells separated by population, populations appear in the same order between heatmaps. Individual cells are colored based on expression level: purple: low expression; yellow: high expression.
Figure 5.
Figure 5.. Analysis of the TAC-TEC population provides insights into population dynamics.
(A) Flow-cytometric analysis of KI67-expressing cells at week four following treatment with anti-RANKL and an age-matched isotype control mouse (two pooled thymi per replicate, n = 4 replicates for treatment, n = 5 for controls). Plots show absolute number of cells that are KI67+, KI67+AIRE+, and KI67+AIRE- in anti-RANKL treated and isotype control samples (data are mean ± s.d.). (B) Analysis for this figure was restricted to the persistent TAC-TEC population of all samples (511 total cells), highlighted on the UMAP of all cells. (C) Percentage of cycling cells within the TAC-TEC population, colored by sample. (D) Normalized log expression of Aire, Ccl21a, and Fezf2, across TAC-TECs in each sample. Color represents sample, black dot is median expression. (E) UMAP visualization and clustering of TAC-TEC reanalysis. Each point represents a cell in the TAC-TEC population, color represents new cluster identity (labeled 0, 1, or 2). (F) Normalized log expression of Aire, Ccl21a, and Fezf2 in the TAC-TEC population across cells in each cluster. Color represents sample, black dot is median expression. (G) Proportions of cells in each cluster in each sample. Color represents cluster. See also Figure 5—figure supplements 1 and 2.
Figure 5—figure supplement 1.
Figure 5—figure supplement 1.. Analysis of the TAC-TEC population.
(A) Differential expression analysis between each sample and the week 10 control. Differential analysis was performed on genes shown as violin plots in Figure 5d and Figure 5—figure supplement 1B (Ccl21a, Aire, Fezf2, Stmn1, Tubb5, and Hmgb2) to indicate significance of deviation from the control. Both log fold change and adjusted p-value are shown for each gene. (B) Normalized log expression of Hmgb2, Tubb5, and Stmn1 across TAC-TECs in each sample. Color represents sample, black dot is median expression. (C) Proportions of cells expressing Aire and/or Ccl21a for each sample in the TAC-TEC population. Color relates to which genes are expressed. (D) Counts of cells expressing Aire and/or Ccl21a for each sample in the TAC-TEC population. Color relates to which genes are expressed. (E) Percentage of cycling cells within the TAC-TEC population after reanalysis, colored by cluster. (F) Normalized log expression of Hmgb2, Tubb5, and Stmn1 across cells in each cluster from the reanalysis of the TAC-TEC population. Color represents cluster, black dot is median expression.
Figure 5—figure supplement 2.
Figure 5—figure supplement 2.. Differentially expressed genes across the ‘TAC-TEC’ clusters.
(A) Heatmap of differentially expressed genes (logFC >0.5, adjusted p-value < 0.05) from the ‘TAC- TEC’ specific clusters. Color is mean-centered, log-normalized expression. Gene expression is the average expression within each ‘TAC-TEC cluster. (B) Heatmap of the same genes from (A) in the same order. Gene expression is the average expression within each mTEC population. Color is mean-centered, log-normalized expression.
Figure 6.
Figure 6.. TSAs are lost after treatment and recover with Aire expression.
(A) Analysis for this figure was restricted to the Aire-positive population of all samples highlighted on the UMAP of all cells. (B) Normalized log expression of Aire, Ccl21a, and Fezf2, across Aire-positive cells in each sample. Color represents sample, black dot is median expression. (C) Average normalized log expression across gene sets in Aire-positive cells for each sample. Color represents sample, black dot is median expression. (D) Cumulative fraction of genes detected in each sample. Color represents gene set. See also Figure 6—figure supplements 1, 2 and 3.
Figure 6—figure supplement 1.
Figure 6—figure supplement 1.. Expression patterns of Aire and Fezf2 following anti-RANKL treatment.
(A) UMAP dimensional visualization of cells. Color represents log expression level of Fezf2. Each UMAP represents one sample. Gray points represent all other samples. (B) Heatmap of mean-centered expression of marker genes for only Aire-positive cells from each sample. Marker genes were determined by finding the top 30 markers of the Aire-positive cells in the control mice. The x axis represents cells separated by sample.
Figure 6—figure supplement 2.
Figure 6—figure supplement 2.. TSA expression occurs after Aire expression.
(A) Differential expression analysis between each sample and the week 10 control. Differential analysis was performed on genes shown as violin plots in Figure 6b (Aire, Fezf2, Gapdh) to indicate significance of deviation from the control. Both log fold change and adjusted p-value are shown for each gene. (B) UMAP dimensional reduction visualizations cells from all samples. Color represents average log expression TSA genes; gray represents all other samples. (C) Number of genes and unique molecular identifiers (UMIs) across all cells in each sample. Color represents sample. (D) Numbers of genes and UMIs for only the Aire-positive population across all cells in each sample. Color represents sample. (E) Numbers of genes and UMIs for only the Aire-positive cells after downsampling of UMIs to match the experiment with the smallest number (week 4) across all cells in each sample. Color represents sample. (F) Percentage of cells from the Aire-positive population with dropouts of common housekeeping genes before and after downsampling of UMIs. Color represents sample.
Figure 6—figure supplement 3.
Figure 6—figure supplement 3.. Downsampling of genes and cells shows recovery patterns consistent with non-downsampled conclusions.
(A) Cumulative fraction of genes detected in the control samples. Color represents gene set. Gene sets include Aire-dependent genes, Fezf2- dependent genes, TSAs, and all genes not included in one of those sets. (B) Distribution of the number of genes expressed per cell from different gene sets within each sample. Color represents sample. P-value was calculated based on an ANOVA test. (C) Average normalized log expression across all TSAs expressed at week four following anti-RANKL treatment in Aire-positive cells for each sample. Color represents sample, black dot is median expression. (D) Distribution of cumulative fraction of genes detected from the week two control following down-sampling 1000 times. Control cells were down- sampled to the number of cells in each other treatment sample. Red line represents observed fraction for each sample. P-values were determined from a z-score.
Author response image 1.

References

    1. Adey AC. Integration of Single-Cell genomics datasets. Cell. 2019;177:1677–1679. doi: 10.1016/j.cell.2019.05.034. - DOI - PubMed
    1. Akiyama N, Shinzawa M, Miyauchi M, Yanai H, Tateishi R, Shimo Y, Ohshima D, Matsuo K, Sasaki I, Hoshino K, Wu G, Yagi S, Inoue J, Kaisho T, Akiyama T. Limitation of immune tolerance-inducing thymic epithelial cell development by Spi-B-mediated negative feedback regulation. Journal of Experimental Medicine. 2014;211:2425–2438. doi: 10.1084/jem.20141207. - DOI - PMC - PubMed
    1. Anderson MS, Venanzi ES, Klein L, Chen Z, Berzins SP, Turley SJ, von Boehmer H, Bronson R, Dierich A, Benoist C, Mathis D. Projection of an immunological self shadow within the Thymus by the aire protein. Science. 2002;298:1395–1401. doi: 10.1126/science.1075958. - DOI - PubMed
    1. Anderson G, Jenkinson WE. Co-ordination of intrathymic self-representation. Nature Immunology. 2015;16:895–896. doi: 10.1038/ni.3251. - DOI - PubMed
    1. Arnold K, Sarkar A, Yram MA, Polo JM, Bronson R, Sengupta S, Seandel M, Geijsen N, Hochedlinger K. Sox2(+) adult stem and progenitor cells are important for tissue regeneration and survival of mice. Cell Stem Cell. 2011;9:317–329. doi: 10.1016/j.stem.2011.09.001. - DOI - PMC - PubMed

Publication types

Associated data